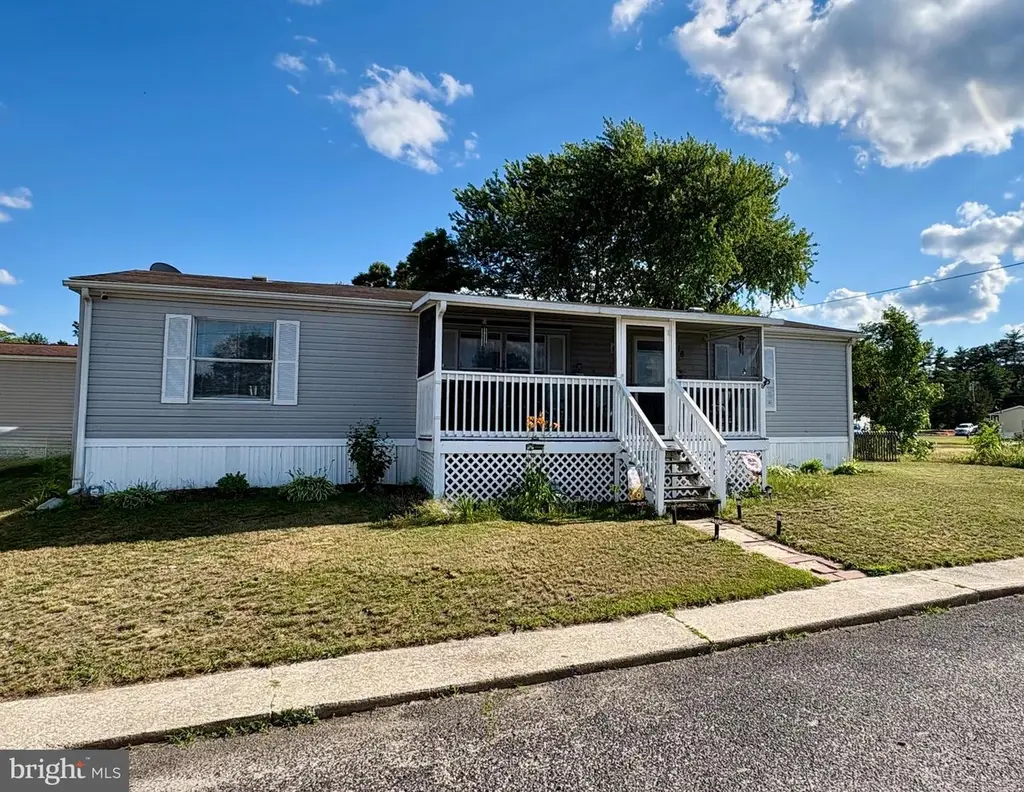
18 Mckinley · Millville, NJ
Flood risk No data
- FEMA flood zone
- —
- Chance of flooding over 30 yrs
- —
- Est. flood insurance / yr
- —
Fire risk No data
- Est. fire insurance / yr
- —
Heat risk No data
- Hot days now (above threshold)
- —
- Hot days in 30 yrs
- —
Wind risk No data
- Chance of severe wind over 30 yrs
- —
Air-quality risk No data
- Unhealthy air days now
- —
- Unhealthy air days in 30 yrs
- —
Risk factors via First Street. Map © Google.
Why this score? — see what drove the B- grade
The composite is a weighted blend of 9 inputs, each scored 0–100. Each bar is that input's sub-score; the figure is the points it added to the 100-point composite (weight × sub-score).
- Cash flow +26.6/30.0
- ARV discount +15.0/15.0
- DSCR +9.1/10.0
- 1% rule +7.1/10.0
- Livability +3.2/5.0
- Rent growth +3.0/5.0
- Condition / age +2.5/5.0
- Schools +1.5/10.0
- Appreciation +0.0/10.0
$145,500
🖨 Deal sheet (PDF) 📄 Offer letter ✓ Due diligence
Listing remarks MLS
NEW PRICE!!!!!!!! You will fall in love with this well kept, neat as a pin home. Open concept living room, dining room , and kitchen make it an entertainer's dream. Three bedrooms, each with large closets , make this a great home to raise your family. Laundry room off of the kitchen doubles as a mud room with an entrance door from the driveway. Two full baths complete the interior. Relax on the front porch and enjoy the well cared for yard. Brand new Amish made shed is included. Home is located in Holly Village. Buyer must be approved by park. Lot rent is currently 590.00 monthly. Sale will be contingent upon the seller finding suitable housing
Key facts
- Updates to kitchen
- Screened in porch
- 3 car driveway
Tags
Property features AI
Finance
- HOA & community: Other monthly fee of $590
Exterior
- Parking: Driveway parking; On-street parking
- Utilities: Public water; Public sewer; Natural gas for heating, hot water, and cooling
- Home design: Manufactured home; Fee simple ownership
- Construction: Vinyl siding exterior; Block foundation; Above-grade structures
- Exterior features: No basement; Tidal water not present
Interior
- Bedrooms: Three bedrooms on the main level
- Bathrooms: Two full bathrooms (both on the main level)
- Heating & cooling: Forced air heating; Natural gas heating and hot water; Natural gas cooling fuel
- Interior features: Estimated living area
Neighborhood map
What this means for you Summary
Snapshot
- This is a 3-bed/2.0-bath single-family listed at $146k.
Deal economics
- At list price, monthly cash flow is $389 ($5k/yr) — positive.
- The deal already cash-flows at list — no discount required.
- Meets the 1% rule at list price ($2k rent vs $146k).
- Cap rate 9.5% vs local median 4.2% in Millville — top-decile yield for the area; either an underpriced asset or a hidden risk that comps aren't pricing in. Stress-test before assuming the spread holds.
Location & tenants
- Location reads 63/100 on livability (#431 in NJ) — a middle-class / working-renter tenant base. Strengths: housing A+, health & safety B+; Watch: schools F, crime F, amenities F.
- Millville School District (suburban): math 6% / reading 28% proficiency, ranked #447 of 472 in NJ (top 95%) — low school quality limits family demand, transient renter base, plan for 1-2y turnover; 60% free/reduced lunch — lower-income household profile, screen leases tightly.
- Market conditions: Rents rising (+1.9%/yr); 296 active listings in the ZIP; 2 comparable units currently listed for rent nearby; 216 units permitted in Cumberland County in 2024 (73 in 5+ unit buildings).
- This rent runs 31% of the median local income ($67k/yr) — at the standard rent-burdened threshold; future hikes will face affordability resistance.
Forward outlook
- Local home prices are declining (-3.0%/yr); year-one equity from $1k of loan paydown is wiped out by about $4k of value loss. Plan a longer hold.
- Cumberland County population projected to shrink 7% by 2050 — rents likely to lag national; underwrite the cash flow, not the appreciation.
Negotiation context
- Only 3 days on market — expect competitive offers; lowballing is unlikely to land.
- 3 sale attempts since 5y ago with the ask held roughly flat each time — persistent listings suggest the price (not the market) is what's stuck; bring a comps-based counter.
- Current owner paid $125k; 16% above their basis — modest negotiation headroom, anchor on the comps not their cost.
Questions for the listing agent
- Is there a deadline driving the sale (1031 exchange, divorce, estate, relocation)? That informs how much negotiation room exists.
- Schools are F-rated, which usually means shorter tenancies and higher turnover. Who's the typical renter profile here, and what's been the actual vacancy rate?
- Crime grade is F in this area — have there been break-ins, vandalism, or insurance claims at this property in the last 3 years? What carrier currently insures it and at what premium?
- What's the average days-on-market for RENTAL listings here right now (not sales)? A rising rental-DOM trend means longer vacancies and softer asking-rent achievability than the comps imply.
- What's the recent tenant-quality profile in this submarket — average credit score on applications, eviction rate, late-payment / NSF rate, and stable-employment percentage? A property-management company in the area should have these aggregated.
- How much new for-sale + rental construction is in the pipeline within 1–3 miles? Heavy new supply typically softens prices + rents 12–24 months out; constrained supply supports both.
Investment metrics
- 1% rule
- 1.21% ✓
- Cap rate
- 9.50%
- Cash-on-cash
- 11.46%
- DSCR
- 1.51
- GRM
- 6.9
CMA / ARV
- ARV (on-the-fly)
- $220,800
- Comps found
- 12
Show comp detail 12 sales within ~0.75 mi
| Address | Dist | Beds/Ba | Sqft | Sold | Price | $/sf | Match |
|---|---|---|---|---|---|---|---|
| 3 Madison Pl | 0.06mi | 3/2.0 | 1,280 (+7%) | 7mo | $168,000 | $131 | 80 |
| 4 Jefferson Ct | 0.09mi | 3/2.0 | 1,363 (+14%) | 13mo | $160,000 | $117 | 62 |
| 815 S 2nd St | 0.50mi | 3/1.0 | 1,230 (+2%) | 8mo | $226,000 | $184 | 62 |
| 21 Jfk Blvd | 0.29mi | 2/2.0 (-1) | 1,100 (-8%) | 12mo | $93,000 | $85 | 58 |
| 19 Garfield St | 0.39mi | 2/1.0 (-1) | 1,179 (-2%) | 15mo | $190,000 | $161 | 58 |
| 833 2nd St S | 0.53mi | 2/1.5 (-1) | 1,224 (+2%) | 9mo | $230,000 | $188 | 57 |
| 375 Peek Ave | 0.44mi | 3/2.0 | 1,071 (-11%) | 5mo | $222,000 | $207 | 57 |
| 309 Stratton Ave | 0.69mi | 2/1.0 (-1) | 1,233 (+3%) | 0mo | $255,000 | $207 | 54 |
| 379 Peek Ave | 0.44mi | 3/2.0 | 1,318 (+10%) | 14mo | $289,000 | $219 | 51 |
| 464 S 3rd St | 0.48mi | 2/1.0 (-1) | 1,306 (+9%) | 10mo | $177,500 | $136 | 46 |
| 35 Cedar St | 0.71mi | 2/1.5 (-1) | 1,304 (+9%) | 9mo | $170,000 | $130 | 38 |
| 17 Hillside Ave | 0.63mi | 4/1.5 (+1) | 1,380 (+15%) | 8mo | $300,000 | $217 | 32 |
Match score weights: distance 35% · size 25% · config 20% · recency 20%. Top-matched comps best support the ARV.
Projected returns pro-forma
-3.0% appreciation · 1.94% rent growth · sell at horizon
- IRR
- -0.4%
- Equity multiple
- 0.98×
- Total profit
- $-633
- Equity at exit
- $21,695
- IRR
- 8.1%
- Equity multiple
- 1.59×
- Total profit
- $23,982
- Equity at exit
- $12,580
Cash invested: $40,740 (down + closing). Projections, not guarantees.
Landlord ↔ Tenant lean methodology
- Overall (STATE)
- 21 Tenant-Leaning
- State New Jersey
- 21 Tenant-Leaning · D+6
- County
- — inherits STATE
- City
- — inherits STATE
ZIP-level market 08332
- Home prices YoY
- -28.9%
- Rents YoY
- 1.9%
- Active inventory
- 296
- Price-to-rent
- 6.9×
Monthly cashflow live
- Estimated rent
- $1,765 medium interval (Pro) →
- Mortgage (P&I)
- −$763
- Tax est. 1.5%
- −$182 /mo · $2,182/yr
- Insurance
- −$61
- HOA
- −$0
- Vacancy / Maint / Mgmt
- −$371
- Net cashflow
- $389
Break-even live
Sensitivity live
| Price | -10% $490 | -5% $439 | +0% $389 | +5% $339 | +10% $289 |
|---|---|---|---|---|---|
| Rent | -10% $250 | -5% $319 | +0% $389 | +5% $459 | +10% $529 |
| Rate | -1.0pp $462 | -0.5pp $426 | base $389 | +0.5pp $351 | +1.0pp $313 |
UW: 25.0% down · 7.5% · 30yr · 1.5% tax · 5.0% vac · 8.0% maint · 8.0% mgmt
Financing live
Cash to close
- Down payment
- $36,375
- Closing costs
- $4,365
- Reserves months
- —
- Total cash needed
- —
Loan-product check · same deal, 3 products live
Conventional
25% down · 7.5% · 30yr
- Down + closing
- —
- Monthly P&I
- —
- Monthly cashflow
- —
- DSCR
- —
- Eligible?
- —
Personal DTI + credit; lowest rate.
DSCR
20% down · 8.5% · 30yr
- Down + closing
- —
- Monthly P&I
- —
- Monthly cashflow
- —
- DSCR
- —
- Eligible?
- —
No personal income docs; deal must DSCR.
Hard money
10% down · 12.0% · 12mo
- Down + closing
- —
- Monthly P&I
- —
- Monthly cashflow
- —
- DSCR
- —
- Eligible?
- —
Short-term bridge; refi at stabilization.
Rent comps 2 comps
| Address | Beds | Baths | Sqft | Rent | $/sqft | DOM | Units | Dist |
|---|---|---|---|---|---|---|---|---|
| 112 W Main St Unit B Millville, NJ | 3.0 | 1.0 | 1384 | $1,500 | $1.08 | 45d | 1 | 0.81mi |
| 313 W Main St Millville, NJ | 3.0 | 1.5 | 1265 | $1,650 | $1.30 | 45d | 1 | 0.89mi |
Listing history 6 events
-
2026-06-19days on market $145,500 Active 3 DOM
-
2026-06-18days on market $145,500 Active 2 DOM
-
2026-06-17remarks 693-char remark
-
2026-06-17status $145,500 Active 1 DOM
-
2026-06-17remarks 673-char remark
-
2026-06-17$145,500 Coming Soon 1 DOM
ⓘ Source: listings_history table (triggers on properties + properties_extension) + one-shot
backfill from property_details.listing_events for pre-trigger history.
Nearby sold comps map
Loading sold comps map…
Walkable amenities ~0.75 mi
Loading nearby amenities…
Taxation est. · year 1
- Rental income
- $21,184
- − Mortgage interest
- −$8,150
- − Property taxes
- −$2,182
- − Insurance
- −$728
- − Repairs & maintenance
- −$1,695
- − Management
- −$1,695
- − Depreciation
- −$4,233
- Taxable income
- $2,501
- Est. tax owed @ 24.0%
- −$600
- After-tax cash flow
- $4,069/yr
For passive investors: Depreciation is non-cash, so a rental often shows a tax loss while cash-flowing — sheltering income. Rental losses are passive: they offset passive income freely, and up to $25,000/yr can offset ordinary (W-2) income if you actively participate and your MAGI is under $100k (phasing out to $0 by $150k); unused losses carry forward. On sale, claimed depreciation is recaptured at up to 25%, and gains may owe capital-gains tax (a 1031 exchange can defer both). Figures are a year-1 estimate at your 24.0% rate — not tax advice; consult a CPA.
Schools (NCES district)
- District
- Millville School District
- NCES district ID
- 3410320
- Math proficiency
- 6% ▼ -11.00%
- Reading proficiency
- 28% ▲ 1.00%
- Median HH income
- $48,851
- Composite
- 15.23/100
- National rank
- #9338
- State rank
- #447 of 472 in NJ
Livability — Millville
- Score
- 63/100
- State rank
- #431
- US rank
- #15561
Category grades
Schools grade is shown separately in the Schools card above.
Census & demographics
- Census place
- Millville, NJ
- County
- Cumberland County · 80,266 people
- City population
- 35,228
- Metro
- Vineland-Bridgeton, NJ
- Population (ZIP)
- 35,228
- Household income
- $67,496
- Rent vs Own
- Severe rent burden
- 1761.0
Population outlook (Cumberland County) Hauer SSP2
- Today (2025)
- 152,743 people
- By 2030
- 150,373 · -1.6%
- By 2040
- 146,881 · -3.8%
- By 2050
- 142,653 · -6.6%
- By 2075
- 129,468 · -15.2%
- By 2100
- 107,456 · -29.6%
Race, ethnicity, and origin ACS 2023
- Neighborhood character
- Diverse neighborhood (Simpson 0.60)
- Race & ethnicity
- White 59% Hispanic / Latino 17% Black 15% Two or more races 11% Asian 2%
- Hispanic origin (detail)
- Mexican 4% Puerto Rican 10%
- Common ancestry
- Romanian 4% Lithuanian 2% Slovak 1%
- Foreign-born
- 7% · Canada
- Languages at home
- 85% English-only · Spanish 11% Other Indo-European 1% Other Asian/Pacific 1%
Political lean MEDSL · Cumberland
- 2024 margin
- Toss-up / Even · D 47.6% · R 51.3% · Other 1.1%
- 2008→2024 swing
- -25.4pp toward R · 2008: 21.6pp · 2024: -3.8pp
- All cycles
- 2024: R+3.8 2020: D+6.0 2016: D+5.3 2012: D+23.1 2008: D+21.6
Not yet ingested
- Civics
- —
Market trends
- HPI YoY
- ▼ -111.45%
- Current HPI
- 274.8011
- Rent YoY
- ▲ 1.94%
- Metro
- Vineland-Bridgeton, NJ
- State GDP YoY
- ▲ 2.05%
- F500 in state
- 34
Industry mix (Fortune 500 HQ in NJ)
| Industry | F500 HQs | Revenue |
|---|---|---|
| Consumer Goods | 3 | $31B |
|
||
| Pharmaceuticals | 2 | $153B |
|
||
| Technology | 2 | $21B |
|
||
| Insurance | 2 | $20B |
|
||
| Healthcare | 2 | $19B |
|
||
| Financial Services | 1 | $70B |
|
||
Price history
+94.0% since first listed14 events — show timeline
- 2026-06-16 Coming Soon $145,500 BRIGHT MLS
- 2024-11-15 Sold (MLS) $125,000 BRIGHT MLS
- 2024-11-05 Pending — BRIGHT MLS
- 2024-10-16 Contingent — BRIGHT MLS
- 2024-10-11 Price Changed $125,000 BRIGHT MLS
- 2024-09-26 Price Changed $138,000 BRIGHT MLS
- 2024-08-31 Listed $141,900 BRIGHT MLS
- 2022-03-28 Sold (MLS) $55,000 BRIGHT MLS
- 2022-02-18 Pending — BRIGHT MLS
- 2022-01-27 Listing Removed — BRIGHT MLS
- 2022-01-27 Listed $70,000 BRIGHT MLS
- 2021-12-01 Price Changed $72,500 BRIGHT MLS
- 2021-10-14 Price Changed $73,000 BRIGHT MLS
- 2021-09-21 Listed $75,000 BRIGHT MLS
Cash-flow waterfall
monthlySold comps — $/sqft
last 12 mo · ≤1 miLoading sold comps…