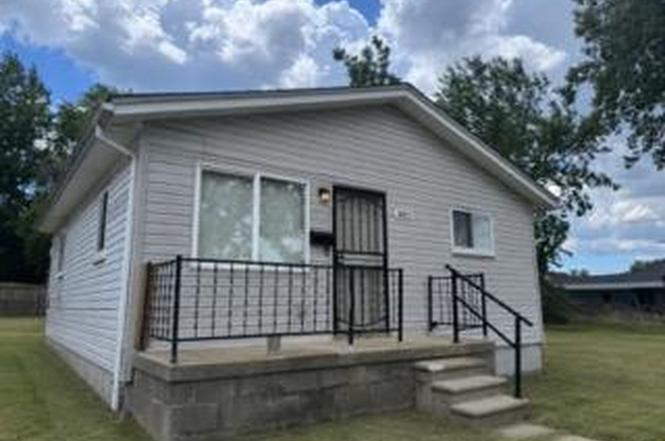
3957 13th St · Ecorse, MI
Flood risk 6/10 · Moderate
- FEMA flood zone
- AE
- Chance of flooding over 30 yrs
- 0.69%
- Est. flood insurance / yr
- $1,737 – $8,500
Fire risk 1/10 · Minimal
- Est. fire insurance / yr
- $784 – $1,456
Heat risk 3/10 · Minor
- Hot days now (above 97°F)
- 7 days/yr
- Hot days in 30 yrs
- 15 days/yr
Wind risk 2/10 · Minimal
- Chance of severe wind over 30 yrs
- —
Air-quality risk 3/10 · Minor
- Unhealthy air days now
- 2 days/yr
- Unhealthy air days in 30 yrs
- 4 days/yr
Risk factors via First Street. Map © Google.
Why this score? — see what drove the B grade
The composite is a weighted blend of 9 inputs, each scored 0–100. Each bar is that input's sub-score; the figure is the points it added to the 100-point composite (weight × sub-score).
- Cash flow +27.4/30.0
- Appreciation +10.0/10.0
- DSCR +9.6/10.0
- 1% rule +8.1/10.0
- ARV discount +7.5/15.0
- Livability +3.5/5.0
- Rent growth +2.5/5.0
- Condition / age +2.5/5.0
- Schools +0.3/10.0
$80,000
🖨 Deal sheet (PDF) 📄 Offer letter ✓ Due diligence
Listing remarks MLS
Move in ready 2-bedroom, 1-bath home in Ecorse offering comfortable living with a functional layout. Features spacious bedrooms, a bright living area, and a convenient location close to schools, parks, shopping, and major freeways. Great opportunity for homeowners or investors alike! All appliances are fairly new and stay with the sale. Newer furnace and water heater along with Central air makes for a simple move while affordable. Property being sold as-is. Buyer responsible for any city repairs if cited upon inspection.
Key facts
- Bright living area
- Newer furnace
- Newer water heater
Tags
Property features AI
Finance
- Other: Residential property in CHESTNUT PARK SUB
Exterior
- Parking: No garage
- Utilities: Public sewer; Water available
- Home design: Single-family residence; One level; Ground-level entry with steps; Vinyl siding construction
- Construction: Vinyl siding
- Exterior features: Paved road access; Lot approximately 0.07 acres (40 x 80.75)
Interior
- Kitchen: Dishwasher; Free-standing electric range; Free-standing refrigerator; Microwave
- Bedrooms: 4 total rooms (includes bedrooms and living areas)
- Bathrooms: 1 full bathroom
- Heating & cooling: Central air conditioning; Forced air heating (natural gas)
- Interior features: Dishwasher; Free-standing electric range; Free-standing refrigerator; Microwave; Washer/dryer stacked; Crawl space basement
- Laundry & utility: Stacked washer/dryer
Neighborhood map
What this means for you Summary
Snapshot
- This is a 2-bed/1.0-bath single-family listed at $80k.
Deal economics
- At list price, monthly cash flow is $-192 ($-2k/yr) — negative.
- To cash-flow at today's rent, offer at most $46k (42.4% below list).
- Meets the 1% rule at list price ($1k rent vs $80k).
- Recommended offer: $46k (42.4% below list) — sets the bar for cash-flow.
Location & tenants
- Location reads 69/100 on livability (#348 in MI) — a middle-class / working-renter tenant base. Strengths: commute A+, cost of living A+, housing A+; Watch: health & safety D+, crime F, amenities F.
- Ecorse Public Schools (suburban): math 3% / reading 7% proficiency, ranked #536 of 540 in MI (top 99%) — low school quality limits family demand, transient renter base, plan for 1-2y turnover; 80% free/reduced lunch — lower-income household profile, screen leases tightly.
- Zoned schools: Ralph J Bunche Academy (math 10% / reading 10%, grade F, #1,230 of 1,397 statewide, top 91%, 318 students, 90% FRL); Grandport Elementary Academy (math 2% / reading 8%, grade F, #488 of 493 statewide, top 100%, 335 students, 89% FRL); Ecorse Community High School (math 5% / reading 15%, grade F, #659 of 713 statewide, top 97%, 296 students, 81% FRL).
- Market conditions: 60 active listings in the ZIP; 15 comparable units currently listed for rent nearby; rentals at typical pace (median 27d on market — plan ~3-4 weeks tenant-placement turnaround); 2,639 units permitted in Wayne County in 2024 (1,216 in 5+ unit buildings).
Forward outlook
- In year one you build about $9k of equity ($553 loan paydown + $8k appreciation (10.0% local appreciation)).
- Wayne County population projected at -17% by 2050 — secular population decline; favor cash flow + early exit over multi-decade hold.
- By year 4, paydown + projected appreciation supports a ~$30k cash-out refi (75% LTV) — recoverable capital for the next deal without selling this one.
Negotiation context
- Only 4 days on market — expect competitive offers; lowballing is unlikely to land.
- 12 sale attempts since 26y ago with the ask held roughly flat each time — persistent listings suggest the price (not the market) is what's stuck; bring a comps-based counter.
Risks & watch-outs
- Watch-outs: flood insurance adds $427/mo.
- Climate carrying-cost: in FEMA flood zone AE (mandatory federal flood insurance) — expect insurance premiums to compound above CPI over the hold.
Questions for the listing agent
- What do current leases actually rent for vs. the listed asking? Can we see a recent rent roll and the last 12 months of T-12 income?
- Built in 1972 — when were the roof, HVAC, electrical panel, plumbing, and water heater last replaced?
- What's the actual annual flood-insurance premium (NFIP or private), and is the property in a SFHA with mandatory coverage?
- Is there a deadline driving the sale (1031 exchange, divorce, estate, relocation)? That informs how much negotiation room exists.
- Schools are F-rated, which usually means shorter tenancies and higher turnover. Who's the typical renter profile here, and what's been the actual vacancy rate?
- Crime grade is F in this area — have there been break-ins, vandalism, or insurance claims at this property in the last 3 years? What carrier currently insures it and at what premium?
- What's the average days-on-market for RENTAL listings here right now (not sales)? A rising rental-DOM trend means longer vacancies and softer asking-rent achievability than the comps imply.
- What's the recent tenant-quality profile in this submarket — average credit score on applications, eviction rate, late-payment / NSF rate, and stable-employment percentage? A property-management company in the area should have these aggregated.
- How much new for-sale + rental construction is in the pipeline within 1–3 miles? Heavy new supply typically softens prices + rents 12–24 months out; constrained supply supports both.
Investment metrics
- 1% rule
- 1.31% ✓
- Cap rate
- 9.81%
- Cash-on-cash
- 12.57%
- DSCR
- 1.56
- GRM
- 6.4
CMA / ARV
- ARV (on-the-fly)
- $51,840
- Comps found
- 12
Show comp detail 12 sales within ~0.75 mi
| Address | Dist | Beds/Ba | Sqft | Sold | Price | $/sf | Match |
|---|---|---|---|---|---|---|---|
| 4241 6th St | 0.58mi | 2/1.0 | 720 (0%) | 6mo | $47,500 | $66 | 68 |
| 30 Ridge St | 0.54mi | 2/1.0 | 748 (+4%) | 3mo | $50,000 | $67 | 66 |
| 2969 S Bassett St | 0.47mi | 3/1.0 (+1) | 775 (+8%) | 2mo | $45,000 | $58 | 59 |
| 27 Knox St St | 0.54mi | 2/1.0 | 792 (+10%) | 10mo | $74,000 | $93 | 50 |
| 4228 11th St | 0.44mi | 2/1.0 | 792 (+10%) | 16mo | $60,000 | $76 | 50 |
| 37 Ruth St | 0.59mi | 3/1.0 (+1) | 680 (-6%) | 12mo | $31,000 | $46 | 48 |
| 4134 17th St | 0.36mi | 3/2.0 (+1) | 822 (+14%) | 5mo | $59,000 | $72 | 47 |
| 494 Polk Ave | 0.62mi | 2/1.0 | 650 (-10%) | 10mo | $40,000 | $62 | 46 |
| 4228 9th St | 0.46mi | 1/1.0 (-1) | 617 (-14%) | 4mo | $50,000 | $81 | 46 |
| 38 Ridge St | 0.52mi | 2/1.0 | 800 (+11%) | 15mo | $58,000 | $73 | 45 |
| 54 W Rockwood St | 0.61mi | 2/1.0 | 820 (+14%) | 10mo | $25,000 | $30 | 39 |
| 1373 Lejeune Ave | 0.69mi | 3/1.0 (+1) | 816 (+13%) | 12mo | $150,000 | $184 | 31 |
Match score weights: distance 35% · size 25% · config 20% · recency 20%. Top-matched comps best support the ARV.
Projected returns pro-forma
10.0% appreciation · 3.0% rent growth · sell at horizon
- IRR
- 17.2%
- Equity multiple
- 2.41×
- Total profit
- $31,649
- Equity at exit
- $72,070
- IRR
- 16.4%
- Equity multiple
- 5.62×
- Total profit
- $103,418
- Equity at exit
- $155,422
Cash invested: $22,400 (down + closing). Projections, not guarantees.
Landlord ↔ Tenant lean methodology
- Overall (STATE)
- 62 Landlord-Friendly
- State Michigan
- 62 Landlord-Friendly · EVEN
- County
- — inherits STATE
- City
- — inherits STATE
ZIP-level market 48229
- Home prices YoY
- 33.9%
- Active inventory
- 60
- Price-to-rent
- 6.4×
Monthly cashflow live
- Estimated rent
- $1,050 high interval (Pro) →
- Mortgage (P&I)
- −$420
- Tax from tax record
- −$142 /mo · $1,701/yr
- Insurance
- −$33
- Flood insurance flood zone
- −$427 /mo · $5,118/yr
- HOA
- −$0
- Vacancy / Maint / Mgmt
- −$220
- Net cashflow
- $-192
Break-even live
Sensitivity live
| Price | -10% $-147 | -5% $-169 | +0% $-192 | +5% $-215 | +10% $-237 |
|---|---|---|---|---|---|
| Rent | -10% $-275 | -5% $-233 | +0% $-192 | +5% $-150 | +10% $-109 |
| Rate | -1.0pp $-152 | -0.5pp $-172 | base $-192 | +0.5pp $-213 | +1.0pp $-234 |
UW: 25.0% down · 7.5% · 30yr · 1.5% tax · 5.0% vac · 8.0% maint · 8.0% mgmt
Financing live
Cash to close
- Down payment
- $20,000
- Closing costs
- $2,400
- Reserves months
- —
- Total cash needed
- —
Loan-product check · same deal, 3 products live
Conventional
25% down · 7.5% · 30yr
- Down + closing
- —
- Monthly P&I
- —
- Monthly cashflow
- —
- DSCR
- —
- Eligible?
- —
Personal DTI + credit; lowest rate.
DSCR
20% down · 8.5% · 30yr
- Down + closing
- —
- Monthly P&I
- —
- Monthly cashflow
- —
- DSCR
- —
- Eligible?
- —
No personal income docs; deal must DSCR.
Hard money
10% down · 12.0% · 12mo
- Down + closing
- —
- Monthly P&I
- —
- Monthly cashflow
- —
- DSCR
- —
- Eligible?
- —
Short-term bridge; refi at stabilization.
Rent comps 15 comps
| Address | Beds | Baths | Sqft | Rent | $/sqft | DOM | Units | Dist |
|---|---|---|---|---|---|---|---|---|
| 3748 15th St Ecorse, MI | 2.0 | 1.0 | 528 | $1,099 | $2.08 | 18d | 1 | 0.34mi |
| 800 Montie Rd Apt 12 Lincoln Park, MI | 1.0 | 1.0 | 700 | $1,000 | $1.43 | 26d | 1 | 0.62mi |
| 1331 Pingree Ave Lincoln Park, MI | 2.0 | 1.0 | 725 | $1,300 | $1.79 | 1d | 1 | 0.66mi |
| 1583 Empire Ave Lincoln Park, MI | 1.0 | 1.0 | 700 | $1,050 | $1.50 | 26d | 1 | 0.93mi |
| 1270 Electric Ave Lincoln Park, MI | 1.0 | 1.0 | 500 | $1,045 | $2.09 | 26d | 1 | 0.99mi |
| 1201 Fort St Lincoln Park, MI | 1.0 | 1.0 | 636 | $795 | $1.25 | 24d | 1 | 0.99mi |
| 1563 Wilson Ave Lincoln Park, MI | 1.0 | 1.0 | 750 | $895 | $1.19 | 7d | 1 | 1.00mi |
| 88 Hill St Unit 2 River Rouge, MI | 1.0 | 1.0 | 700 | $800 | $1.14 | 26d | 1 | 1.00mi |
| 1537 Chandler Ave Lincoln Park, MI | 2.0 | 1.0 | 725 | $1,100 | $1.52 | 19d | 1 | 1.09mi |
| 4471 High St Unit 81-13 Ecorse, MI | 2.0 | 1.0 | 700 | $1,050 | $1.50 | 26d | 1 | 1.11mi |
| 4471 High St Unit 25-4 Ecorse, MI | 1.0 | 1.0 | 600 | $1,025 | $1.71 | 20d | 1 | 1.11mi |
| 4471 High St Unit 71-7 Ecorse, MI | 2.0 | 1.0 | 700 | $1,150 | $1.64 | 26d | 1 | 1.11mi |
| 1308 Hanford Ave Apt 3 Lincoln Park, MI | 1.0 | 1.0 | 650 | $1,200 | $1.85 | 26d | 1 | 1.16mi |
| 4581 High St Unit 13 Ecorse, MI | 2.0 | 1.0 | 700 | $1,050 | $1.50 | 26d | 1 | 1.29mi |
| 25 Le Blanc St Unit 4 Ecorse, MI | 1.0 | 1.0 | 650 | $1,025 | $1.58 | 20d | 1 | 1.30mi |
Listing history 3 events
-
2026-06-21days on market $80,000 Active 4 DOM
-
2026-06-17remarks 527-char remark
Show marketing remark (526 chars)
Move in ready 2-bedroom, 1-bath home in Ecorse offering comfortable living with a functional layout. Features spacious bedrooms, a bright living area, and a convenient location close to schools, parks, shopping, and major freeways. Great opportunity for homeowners or investors alike! All appliances are fairly new and stay with the sale. Newer furnace and water heater along with Central air makes for a simple move while affordable. Property being sold as-is. Buyer responsible for any city repairs if cited upon inspection.
-
2026-06-17$80,000 Active 1 DOM
Show marketing remark (526 chars)
Move in ready 2-bedroom, 1-bath home in Ecorse offering comfortable living with a functional layout. Features spacious bedrooms, a bright living area, and a convenient location close to schools, parks, shopping, and major freeways. Great opportunity for homeowners or investors alike! All appliances are fairly new and stay with the sale. Newer furnace and water heater along with Central air makes for a simple move while affordable. Property being sold as-is. Buyer responsible for any city repairs if cited upon inspection.
ⓘ Source: listings_history table (triggers on properties + properties_extension) + one-shot
backfill from property_details.listing_events for pre-trigger history.
Tax reassessment forecast MI · Partial reset (capped growth)
- Current annual tax
- $1,701 · $142/mo
- Projected year-2 tax
- $1,701 · $142/mo
- Expected delta
- $0/yr ($0/mo · -0.0%)
ⓘ Screening estimate from a state-policy table — verify with the county assessor before closing.
Climate risk First Street
- Flood 6/10 Major FEMA zone AE · 69% chance over 30 yrs
- Wildfire 1/10 Low
- Heat 3/10 Moderate 7 d/yr ≥97°F today · 15 d/yr by 30 yrs out
- Wind 2/10 Low
- Air quality 3/10 Moderate 2 unhealthy d/yr today · 4 by 30 yrs out
Nearby sold comps map
Loading sold comps map…
Walkable amenities ~0.75 mi
Loading nearby amenities…
Taxation est. · year 1
- Rental income
- $12,596
- − Mortgage interest
- −$4,481
- − Property taxes
- −$1,701
- − Insurance
- −$5,518
- − Repairs & maintenance
- −$1,008
- − Management
- −$1,008
- − Depreciation
- −$2,327
- Taxable loss
- −$3,448
- Est. tax savings @ 24.0%
- +$827
- After-tax cash flow
- $-1,476/yr
For passive investors: Depreciation is non-cash, so a rental often shows a tax loss while cash-flowing — sheltering income. Rental losses are passive: they offset passive income freely, and up to $25,000/yr can offset ordinary (W-2) income if you actively participate and your MAGI is under $100k (phasing out to $0 by $150k); unused losses carry forward. On sale, claimed depreciation is recaptured at up to 25%, and gains may owe capital-gains tax (a 1031 exchange can defer both). Figures are a year-1 estimate at your 24.0% rate — not tax advice; consult a CPA.
Schools (NCES district)
- District
- Ecorse Public Schools
- NCES district ID
- 2612930
- Math proficiency
- 3% ▼ -4.00%
- Reading proficiency
- 7% ▼ -6.00%
- Median HH income
- $28,957
- Composite
- 3.46/100
- National rank
- #10075
- State rank
- #536 of 540 in MI
Livability — Ecorse
- Score
- 69/100
- State rank
- #348
- US rank
- #8880
Category grades
Schools grade is shown separately in the Schools card above.
Census & demographics
- Census place
- Ecorse, MI
- City population
- 9,166
- Population (ZIP)
- 9,166
Population outlook (Wayne County) Hauer SSP2
- Today (2025)
- 1,675,273 people
- By 2030
- 1,620,300 · -3.3%
- By 2040
- 1,502,341 · -10.3%
- By 2050
- 1,384,039 · -17.4%
- By 2075
- 1,124,592 · -32.9%
- By 2100
- 881,193 · -47.4%
Race, ethnicity, and origin ACS 2023
- Neighborhood character
- Diverse neighborhood (Simpson 0.69)
- Race & ethnicity
- Black 45% White 26% Hispanic / Latino 21% Two or more races 15% Native American 4%
- Hispanic origin (detail)
- Mexican 18% Puerto Rican 1%
- Common ancestry
- Lithuanian 3% Romanian 2% Slovak 1%
- Foreign-born
- 4% · Canada, Guatemala, Jamaica
- Languages at home
- 86% English-only · Spanish 13%
Political lean MEDSL · Wayne
- 2024 margin
- Strong D (+29.0) · D 62.7% · R 33.7% · Other 3.6%
- 2008→2024 swing
- -20.5pp toward R · 2008: 49.5pp · 2024: 29.0pp
- All cycles
- 2024: D+29.0 2020: D+38.1 2016: D+37.3 2012: D+46.9 2008: D+49.5
Not yet ingested
- Civics
- —
Market trends
- HPI YoY
- ▲ 102.51%
- Current HPI
- 404.5927
- Rent YoY
- —
- Metro
- —
- State GDP YoY
- ▲ 1.37%
- F500 in state
- 28
Industry mix (Fortune 500 HQ in MI)
| Industry | F500 HQs | Revenue |
|---|---|---|
| Automotive Parts | 3 | $48B |
|
||
| Automotive | 2 | $372B |
|
||
| Chemicals | 1 | $45B |
|
||
| Automotive Retail | 1 | $29B |
|
||
| Healthcare / Medical Devices | 1 | $23B |
|
||
| Automotive Technology | 1 | $20B |
|
||
Price history
+433.3% since first listed31 events — show timeline
- 2026-06-17 Listed $80,000 REALCOMP
- 2026-06-17 Listed $80,000 MiRealSource-MiMLS
- 2023-09-17 Rental Removed $1,000 BUILDIUM
- 2023-09-03 Listed for Rent $1,000 BUILDIUM
- 2023-08-30 Rental Removed $1,000 BUILDIUM
- 2023-08-23 Listing Removed — MiRealSource-MiMLS
- 2023-08-23 Listing Removed — REALCOMP
- 2023-08-18 Listed for Rent $1,000 BUILDIUM
- 2023-08-01 Price Changed $79,900 MiRealSource-MiMLS
- 2023-08-01 Price Changed $79,900 REALCOMP
- 2023-06-30 Price Changed $84,900 MiRealSource-MiMLS
- 2023-06-30 Price Changed $84,900 REALCOMP
- 2023-06-09 Listed $89,900 MiRealSource-MiMLS
- 2023-06-09 Listed $89,900 REALCOMP
- 2022-03-30 Price Changed $1,000 BUILDIUM
- 2018-09-25 Sold (MLS) $90,000 MiRealSource-MiMLS
- 2018-09-25 Sold (MLS) $90,000 REALCOMP
- 2018-09-22 Listing Removed — REALCOMP
- 2018-09-18 Listed $90,000 MiRealSource-MiMLS
- 2018-09-18 Listed $90,000 REALCOMP
- 2018-08-06 Sold (Public Records) $90,000 Public Records
- 2008-01-29 Sold (MLS) $6,000 REALCOMP
- 2007-12-21 Listed $7,900 REALCOMP
- 2006-07-03 Sold (Public Records) $55,000 Public Records
- 2003-10-08 Listing Removed — REALCOMP
- 2003-10-08 Listing Removed — MiRealSource-MiMLS
- 2003-05-08 Listed $30,000 REALCOMP
- 2003-05-08 Listed $30,000 MiRealSource-MiMLS
- 2000-10-23 Sold (MLS) $15,000 REALCOMP
- 2000-09-26 Sold (Public Records) $12,500 Public Records
- 2000-06-15 Listed $15,000 REALCOMP
Property tax history
+1.5%/yrLatest (2025): $1,701 · -0.2% YoY. Source: county tax records.
Cash-flow waterfall
monthlySold comps — $/sqft
last 12 mo · ≤1 miLoading sold comps…