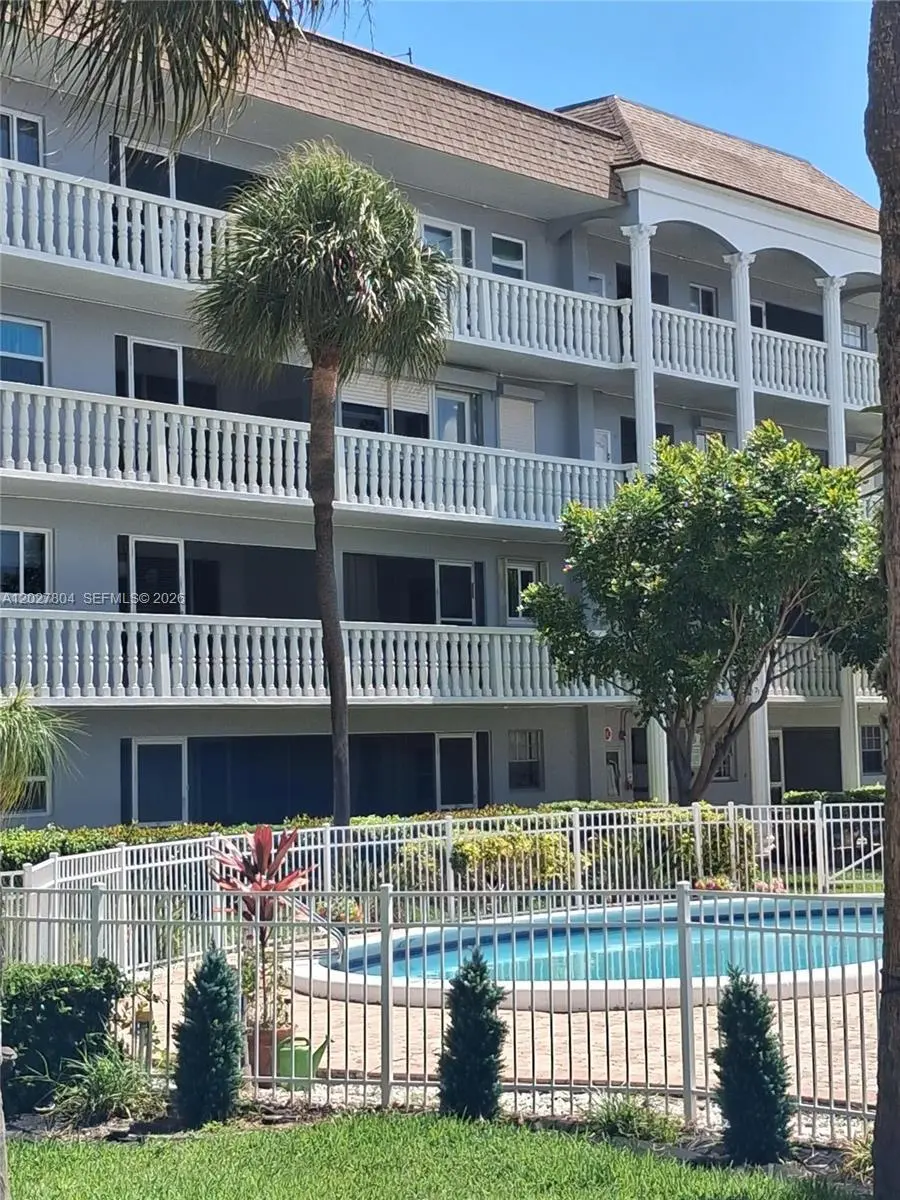
490 SE 19th Ave #107 · Pompano Beach, FL
Flood risk 5/10 · Moderate
- FEMA flood zone
- X (shaded)
- Chance of flooding over 30 yrs
- 0.47%
- Est. flood insurance / yr
- $507 – $1,088
Fire risk 1/10 · Minimal
- Est. fire insurance / yr
- $947 – $1,759
Heat risk 10/10 · Severe
- Hot days now (above 106°F)
- 7 days/yr
- Hot days in 30 yrs
- 26 days/yr
Wind risk 10/10 · Severe
- Chance of severe wind over 30 yrs
- 99.0%
Air-quality risk 2/10 · Minimal
- Unhealthy air days now
- 1 days/yr
- Unhealthy air days in 30 yrs
- 2 days/yr
Risk factors via First Street. Map © Google.
Why this score? — see what drove the D+ grade
The composite is a weighted blend of 9 inputs, each scored 0–100. Each bar is that input's sub-score; the figure is the points it added to the 100-point composite (weight × sub-score).
- Cash flow +15.0/30.0
- ARV discount +7.5/15.0
- 1% rule +5.0/10.0
- DSCR +5.0/10.0
- Schools +4.1/10.0
- Livability +3.7/5.0
- Rent growth +3.0/5.0
- Condition / age +2.5/5.0
- Appreciation +0.0/10.0
$1,650
🖨 Deal sheet 📄 Offer letter ✓ Due diligence
Listing remarks
Welcome to your coastal retreat in Pompano Beach! It's newly painted. Beaches are only 2 miles away. Restaurants, bars and shopping close (Publics). Plenty of bars and restaurants on the ocean. Located just a block off US1 and Atlantic Blvd for shopping and dining. Patio in front of unit with view of pool and canal. Two spacious bedrooms and two modern bathrooms. Enjoy an open-concept living space with abundant natural light and a well-appointed kitchen with sleek appliances. Relax on your private balcony with stunning views, or take advantage of community amenities, including a sparkling pool and lush landscaping. Just minutes from beautiful beaches, dining, and shopping, this location pr
Key facts
- Private balcony
- Community amenities
- View of pool
Tags
Property features AI
Finance
- Other: Annual tax noted
- Financial info: Lease considered; Pets allowed
- HOA & community: Monthly association fee of $625; Association covers pool(s), sewer and water; Association amenities include clubhouse, elevators and pool; Senior community
Exterior
- Parking: Assigned parking (one space)
- Security: Fire alarm
- Utilities: Has cooling; Has heating
- Home design: Attached property; 3-story building; Entry level: 107
- Construction: Block construction; Resale property
- Exterior features: Enclosed porch; Porch (screened); Association pool; Has a view
Interior
- Kitchen: Dishwasher; Disposal; Microwave
- Bedrooms: Bedroom on main level
- Flooring: Tile
- Bathrooms: 2 full bathrooms
- Heating & cooling: Central air; Electric heating
- Interior features: Elevator; Bedroom on main level
- Laundry & utility: Dryer
Neighborhood map
What this means for you Summary
Snapshot
- This is a 2-bed/2.0-bath condo listed at $2k.
Deal economics
- At list price, monthly cash flow is $1k ($15k/yr) — positive.
- The deal already cash-flows at list — no discount required.
- Meets the 1% rule at list price ($2k rent vs $2k).
- Cap rate 937.1% vs local median 3.1% in Pompano Beach — top-decile yield for the area; either an underpriced asset or a hidden risk that comps aren't pricing in. Stress-test before assuming the spread holds.
Location & tenants
- Location reads 74/100 on livability (#284 in FL, #4,541 nationally) — a middle-class / working-renter tenant base. Strengths: commute A+, housing A+, cost of living B+; Watch: schools D+, employment D+, amenities F.
- Broward (suburban): math 42% / reading 53% proficiency, ranked #46 of 73 in FL (top 63%) — families likely to look elsewhere, expect single-tenant / working-renter base with shorter leases.
- Market conditions: Rents rising (+2.1%/yr); 338 active listings in the ZIP; 40 comparable units currently listed for rent nearby; rentals at typical pace (median 22d on market — plan ~3-4 weeks tenant-placement turnaround); 2,111 units permitted in Broward County in 2024 (1,265 in 5+ unit buildings).
- This rent runs 45% of the median local income ($65k/yr) — at the standard rent-burdened threshold; future hikes will face affordability resistance.
Forward outlook
- Local home prices are declining (-3.0%/yr); year-one equity from $12 of loan paydown is wiped out by about $50 of value loss. Plan a longer hold.
- Broward County population projected at +34% by 2050 — long-run rental-demand tailwind backs the buy-and-hold thesis.
- At projected returns (-3.0% appreciation + 2.1% rent growth), your $462 cash investment doubles in ~1 year — after that, you're playing with house money.
Negotiation context
- Only 5 days on market — expect competitive offers; lowballing is unlikely to land.
- 4 sale attempts since 10y ago with the ask held roughly flat each time — persistent listings suggest the price (not the market) is what's stuck; bring a comps-based counter.
Risks & watch-outs
- Watch-outs: HOA is 26% of rent.
- Climate carrying-cost: moderate flood risk; severe wind risk, 99% chance of damaging wind over 30y; extreme-heat days projected 7→26/yr by 2055 (HVAC capex compounding) — expect insurance premiums to compound above CPI over the hold.
Questions for the listing agent
- Built in 1969 — when were the roof, HVAC, electrical panel, plumbing, and water heater last replaced?
- What does the HOA fee cover, when was the last increase, and are there any pending special assessments or reserve-fund shortfalls?
- Any open or pending special assessments — roof, HVAC, plumbing, elevator, façade? What's the per-unit balance and payoff schedule, and is the seller paying it off at close or rolling it to the buyer?
- Is there a deadline driving the sale (1031 exchange, divorce, estate, relocation)? That informs how much negotiation room exists.
- Schools are D-rated, which usually means shorter tenancies and higher turnover. Who's the typical renter profile here, and what's been the actual vacancy rate?
- The area grade is low — what's the realistic commute time and amenity access for the typical tenant pool here? Any planned neighborhood developments (good or bad) we should know about?
- What's the average days-on-market for RENTAL listings here right now (not sales)? A rising rental-DOM trend means longer vacancies and softer asking-rent achievability than the comps imply.
- What's the recent tenant-quality profile in this submarket — average credit score on applications, eviction rate, late-payment / NSF rate, and stable-employment percentage? A property-management company in the area should have these aggregated.
- How much new apartment / multifamily construction is in the pipeline within 1–3 miles? Heavy new supply (>2% of stock underway) typically softens rents 12–24 months out; light construction supports rent growth.
Investment metrics
- 1% rule
- 147.01% ✓
- Cap rate
- 937.07%
- Cash-on-cash
- 3324.19%
- DSCR
- 148.91
- GRM
- 0.1
CMA / ARV
No comps found within radius.
Projected returns pro-forma
-3.0% appreciation · 2.12% rent growth · sell at horizon
- IRR
- —
- Equity multiple
- 173.16×
- Total profit
- $79,536
- Equity at exit
- $246
- IRR
- —
- Equity multiple
- 363.22×
- Total profit
- $167,344
- Equity at exit
- $143
Cash invested: $462 (down + closing). Projections, not guarantees.
Landlord ↔ Tenant lean methodology
- Overall (STATE)
- 87 Strongly Landlord-Friendly
- State Florida
- 87 Strongly Landlord-Friendly · R+3
- County
- — inherits STATE
- City
- — inherits STATE
ZIP-level market 33060
- Home prices YoY
- -23.6%
- Rents YoY
- 2.1%
- Active inventory
- 338
- Price-to-rent
- 0.1×
Monthly cashflow live
- Estimated rent
- $2,426 high interval (Pro) →
- Mortgage (P&I)
- −$9
- Tax est. 1.5%
- −$2 /mo · $25/yr
- Insurance
- −$1
- HOA
- −$625
- Vacancy / Maint / Mgmt
- −$509
- Net cashflow
- $1,280
Break-even live
UW: 25.0% down · 7.5% · 30yr · 1.5% tax · 5.0% vac · 8.0% maint · 8.0% mgmt
Financing live
Cash to close
- Down payment
- $412
- Closing costs
- $50
- Reserves months
- —
- Total cash needed
- —
Loan-product check · same deal, 3 products live
Conventional
25% down · 7.5% · 30yr
- Down + closing
- —
- Monthly P&I
- —
- Monthly cashflow
- —
- DSCR
- —
- Eligible?
- —
Personal DTI + credit; lowest rate.
DSCR
20% down · 8.5% · 30yr
- Down + closing
- —
- Monthly P&I
- —
- Monthly cashflow
- —
- DSCR
- —
- Eligible?
- —
No personal income docs; deal must DSCR.
Hard money
10% down · 12.0% · 12mo
- Down + closing
- —
- Monthly P&I
- —
- Monthly cashflow
- —
- DSCR
- —
- Eligible?
- —
Short-term bridge; refi at stabilization.
Rent comps 40 comps
| Address | Beds | Baths | Sqft | Rent | $/sqft | DOM | Units | Dist |
|---|---|---|---|---|---|---|---|---|
| 1971 SE 5th Ct Unit 303E Pompano Beach, FL | 2.0 | 2.0 | 960 | $2,400 | $2.50 | 22d | 1 | 0.04mi |
| 490 SE 19th Ave #107 Pompano Beach, FL | 2.0 | 2.0 | 960 | $1,650 | $1.72 | 15d | 1 | 0.04mi |
| 1971 SE 5th Ct Pompano Beach, FL | 2.0 | 2.0 | 960 | $2,050 | $2.14 | 24d | 2 | 0.05mi |
| 1891 SE 5th Ct Pompano Beach, FL | 2.0 | 2.0 | 1102 | $3,000 | $2.72 | 16d | 1 | 0.07mi |
| 431 SE 19th Ave Unit 2 Pompano Beach, FL | 1.0 | 1.0 | 700 | $1,600 | $2.29 | 24d | 1 | 0.08mi |
| 1850 SE 7th St Unit B Pompano Beach, FL | 2.0 | 2.0 | 900 | $4,000 | $4.44 | 24d | 1 | 0.19mi |
| 690 SE 23rd Ave #1 Pompano Beach, FL | 2.0 | 2.5 | 1055 | $2,995 | $2.84 | 15d | 1 | 0.25mi |
| 8 SE 19th Ave #11 Pompano Beach, FL | 2.0 | 1.0 | 842 | $1,795 | $2.13 | 24d | 1 | 0.29mi |
| 777 S Federal Hwy Pompano Beach, FL | 1.0–2.0 | 1.0–2.0 | 947 | $3,200 | $3.38 | 15d | 6 | 0.29mi |
| 777 S Federal Hwy Pompano Beach, FL | 1.0–2.0 | 1.0–2.0 | 947 | $3,500 | $3.69 | 24d | 6 | 0.29mi |
| 777 S Federal Hwy Pompano Beach, FL | 2.0 | 2.0 | 1166 | $2,825 | $2.42 | 3d | 3 | 0.29mi |
| 23 NE 19th Ave Pompano Beach, FL | 1.0 | 1.0 | 900 | $2,500 | $2.78 | 7d | 1 | 0.41mi |
| 140 NE 19th Ave Pompano Beach, FL | 1.0 | 1.0 | 850 | $1,800 | $2.12 | 24d | 1 | 0.45mi |
| 801 S Federal Hwy #21 Pompano Beach, FL | 2.0 | 2.0 | 1070 | $3,100 | $2.90 | 3d | 1 | 0.45mi |
| 11 NE 24th Ave Pompano Beach, FL | 3.0 | 1.0–2.0 | 965 | $3,822 | $3.96 | 3d | 36 | 0.45mi |
| 32 NE 22nd Ave #107 Pompano Beach, FL | 1.0 | 1.0 | 742 | $1,650 | $2.22 | 15d | 1 | 0.46mi |
| 1100 Pine Dr #102 Pompano Beach, FL | 2.0 | 2.0 | 950 | $2,100 | $2.21 | 24d | 1 | 0.49mi |
| 344 SE 11th Ave #8 Pompano Beach, FL | 1.0 | 1.0 | 600 | $1,500 | $2.50 | 24d | 1 | 0.50mi |
| 29 NE 15th Ave Pompano Beach, FL | 2.0 | 1.0 | 900 | $1,450 | $1.61 | 15d | 1 | 0.51mi |
| 275 N Federal Hwy Pompano Beach, FL | 1.0–3.0 | 1.0–2.0 | 1117 | $3,047 | $2.73 | 1d | 9 | 0.53mi |
| 208 N Federal Hwy Pompano Beach, FL | 2.0 | 1.0–2.0 | 687 | $3,330 | $4.84 | 2d | 29 | 0.56mi |
| 305 SE 11th Ave Unit D Pompano Beach, FL | 3.0 | 2.0 | 1000 | $2,400 | $2.40 | 16d | 1 | 0.56mi |
| 320 SE 10th Ave Unit D Pompano Beach, FL | 2.0 | 2.0 | 1000 | $2,300 | $2.30 | 24d | 1 | 0.57mi |
| 1001 S Riverside Dr #105 Pompano Beach, FL | 1.0 | 1.0 | 700 | $2,250 | $3.21 | 24d | 1 | 0.60mi |
| 912 Pine Dr #211 Pompano Beach, FL | 2.0 | 2.0 | 949 | $1,900 | $2.00 | 24d | 1 | 0.61mi |
| 1201 S Riverside Dr #307 Pompano Beach, FL | 1.0 | 1.0 | 772 | $2,400 | $3.11 | 7d | 1 | 0.62mi |
| 1201 S Riverside Dr #106 Pompano Beach, FL | 1.0 | 1.0 | 772 | $2,400 | $3.11 | 24d | 1 | 0.62mi |
| 2412 NE 4th St Pompano Beach, FL | 2.0 | 1.0 | 1000 | $2,600 | $2.60 | 24d | 1 | 0.63mi |
| 1261 NE 2nd St Pompano Beach, FL | 2.0 | 1.0 | 1010 | $2,650 | $2.62 | 22d | 1 | 0.64mi |
| 2701 NE 1st St #106 Pompano Beach, FL | 2.0 | 1.0 | 800 | $2,200 | $2.75 | 24d | 1 | 0.64mi |
| 600 S Riverside Dr Pompano Beach, FL | 2.0 | 2.0 | 1108 | $4,000 | $3.61 | 3d | 1 | 0.65mi |
| 2701 NE 1st St Pompano Beach, FL | 1.0–2.0 | 1.0 | 662 | $2,200 | $3.32 | 11d | 2 | 0.65mi |
| 840 Pine Dr #103 Pompano Beach, FL | 2.0 | 2.0 | 904 | $2,800 | $3.10 | 24d | 1 | 0.66mi |
| 3201 SE 12th St Unit B4 Pompano Beach, FL | 2.0 | 2.0 | 1000 | $2,400 | $2.40 | 24d | 1 | 0.67mi |
| 3205 SE 7th St #201 Pompano Beach, FL | 1.0 | 1.0 | 560 | $1,900 | $3.39 | 24d | 1 | 0.67mi |
| 3208 SE 11th St #201 Pompano Beach, FL | 2.0 | 2.0 | 914 | $2,200 | $2.41 | 11d | 1 | 0.68mi |
| 241 SE 9th Ave Pompano Beach, FL | 2.0 | 2.0 | 725 | $1,800 | $2.48 | 11d | 2 | 0.69mi |
| 3216 SE 12th St #28 Pompano Beach, FL | 1.0 | 1.0 | 650 | $2,300 | $3.54 | 7d | 1 | 0.71mi |
| 105 S Riverside Dr #303 Pompano Beach, FL | 2.0 | 2.0 | 1121 | $2,250 | $2.01 | 24d | 1 | 0.71mi |
| 601 N Federal Hwy Pompano Beach, FL | 1.0 | 1.0 | 962 | $2,550 | $2.65 | 7d | 1 | 0.72mi |
HOA detail condo
- Monthly dues
- $625 · $7,500/yr
- Likely covers
- landscapingpool
- Assessments
- None detected in remarks — confirm with the listing agent.
Listing history 6 events
-
2026-06-04days on market $1,650 Active 5 DOM
-
2026-06-03days on market $1,650 Active 4 DOM
-
2026-06-02days on market $1,650 Active 3 DOM
-
2026-06-01days on market $1,650 Active 2 DOM
-
2026-05-31remarks 699-char remark
-
2026-05-31$1,650 Active 1 DOM
ⓘ Source: listings_history table (triggers on properties + properties_extension) + one-shot
backfill from property_details.listing_events for pre-trigger history.
Climate risk First Street
- Flood 5/10 Major FEMA zone X (shaded) · 47% chance over 30 yrs
- Wildfire 1/10 Low
- Heat 10/10 Extreme 7 d/yr ≥106°F today · 26 d/yr by 30 yrs out
- Wind 10/10 Extreme 99% chance of damaging wind over 30 yrs
- Air quality 2/10 Low 1 unhealthy d/yr today · 2 by 30 yrs out
Nearby sold comps map
Loading sold comps map…
Walkable amenities ~0.75 mi
Loading nearby amenities…
Taxation est. · year 1
- Rental income
- $29,107
- − Mortgage interest
- −$92
- − Property taxes
- −$25
- − Insurance
- −$8
- − Repairs & maintenance
- −$2,329
- − Management
- −$2,329
- − HOA
- −$7,500
- − Depreciation
- −$48
- Taxable income
- $16,777
- Est. tax owed @ 24.0%
- −$4,026
- After-tax cash flow
- $11,331/yr
For passive investors: Depreciation is non-cash, so a rental often shows a tax loss while cash-flowing — sheltering income. Rental losses are passive: they offset passive income freely, and up to $25,000/yr can offset ordinary (W-2) income if you actively participate and your MAGI is under $100k (phasing out to $0 by $150k); unused losses carry forward. On sale, claimed depreciation is recaptured at up to 25%, and gains may owe capital-gains tax (a 1031 exchange can defer both). Figures are a year-1 estimate at your 24.0% rate — not tax advice; consult a CPA.
Schools (NCES district)
- District
- Broward
- NCES district ID
- 1200180
- Math proficiency
- 42% ▼ -18.00%
- Reading proficiency
- 53% ▼ -5.00%
- Median HH income
- $52,139
- Composite
- 40.88/100
- National rank
- #3621
- State rank
- #46 of 73 in FL
Livability — Pompano Beach
- Score
- 74/100
- State rank
- #284
- US rank
- #4541
Category grades
Schools grade is shown separately in the Schools card above.
Census & demographics
- Census place
- Pompano Beach, FL
- County
- Broward County · 1,963,430 people
- City population
- 155,861
- Metro
- Miami-Fort Lauderdale-Pompano Beach, FL
- Population (ZIP)
- 37,233
- Household income
- $64,819
- Rent vs Own
- Severe rent burden
- 2870.0
Population outlook (Broward County) Hauer SSP2
- Today (2025)
- 2,207,033 people
- By 2030
- 2,360,704 · +7.0%
- By 2040
- 2,661,208 · +20.6%
- By 2050
- 2,946,698 · +33.5%
- By 2075
- 3,602,273 · +63.2%
- By 2100
- 3,970,984 · +79.9%
Race, ethnicity, and origin ACS 2023
- Neighborhood character
- Diverse neighborhood (Simpson 0.69)
- Race & ethnicity
- Black 38% White 33% Hispanic / Latino 26% Two or more races 14%
- Hispanic origin (detail)
- Mexican 9% Puerto Rican 2% Cuban 3% Dominican 1%
- Common ancestry
- Hispanic 13% Romanian 2% Slovak 1%
- Foreign-born
- 31% · Canada, Jamaica
- Languages at home
- 60% English-only · Spanish 23% French/Haitian/Cajun 13% Other Indo-European 2%
Political lean MEDSL · Broward
- 2024 margin
- D (+17.0) · D 58.0% · R 41.0%
- 2008→2024 swing
- -17.8pp toward R · 2008: 34.7pp · 2024: 17.0pp
- All cycles
- 2024: D+17.0 2020: D+29.8 2016: D+35.0 2012: D+34.9 2008: D+34.7
Not yet ingested
- Civics
- —
Market trends
- HPI YoY
- ▼ -131.09%
- Current HPI
- 425.3083
- Rent YoY
- ▲ 2.12%
- Metro
- Miami-Fort Lauderdale-Pompano Beach, FL
- State GDP YoY
- ▲ 3.28%
- F500 in state
- 36
Industry mix (Fortune 500 HQ in FL)
| Industry | F500 HQs | Revenue |
|---|---|---|
| Industrial Technology | 2 | $29B |
|
||
| Insurance | 2 | $17B |
|
||
| Retail | 1 | $60B |
|
||
| Technology Distribution | 1 | $58B |
|
||
| Homebuilding | 1 | $35B |
|
||
| Technology Manufacturing | 1 | $35B |
|
||
Price history
-96.7% since first listed12 events — show timeline
- 2026-05-29 Listed $1,650 MARMLS
- 2026-05-04 Listed for Rent $1,650 REDFIN
- 2025-06-03 Rental Removed $1,700 GFLMLS
- 2025-04-23 Price Changed $1,700 GFLMLS
- 2025-04-03 Listed for Rent $1,775 GFLMLS
- 2017-04-14 Listing Removed — MARMLS
- 2016-12-30 Price Changed $96,000 MARMLS
- 2016-12-01 Price Changed $98,500 MARMLS
- 2016-10-13 Listed $99,900 MARMLS
- 2015-11-20 Sold (Public Records) $63,000 Public Records
- 1988-04-21 Sold (Public Records) $50,000 Public Records
- 1988-04-01 Sold (Public Records) $50,000 Public Records
Property tax history
+8.6%/yrLatest (2025): $4,003 · +7.4% YoY. Source: county tax records.
Cash-flow waterfall
monthlySold comps — $/sqft
last 12 mo · ≤1 miLoading sold comps…