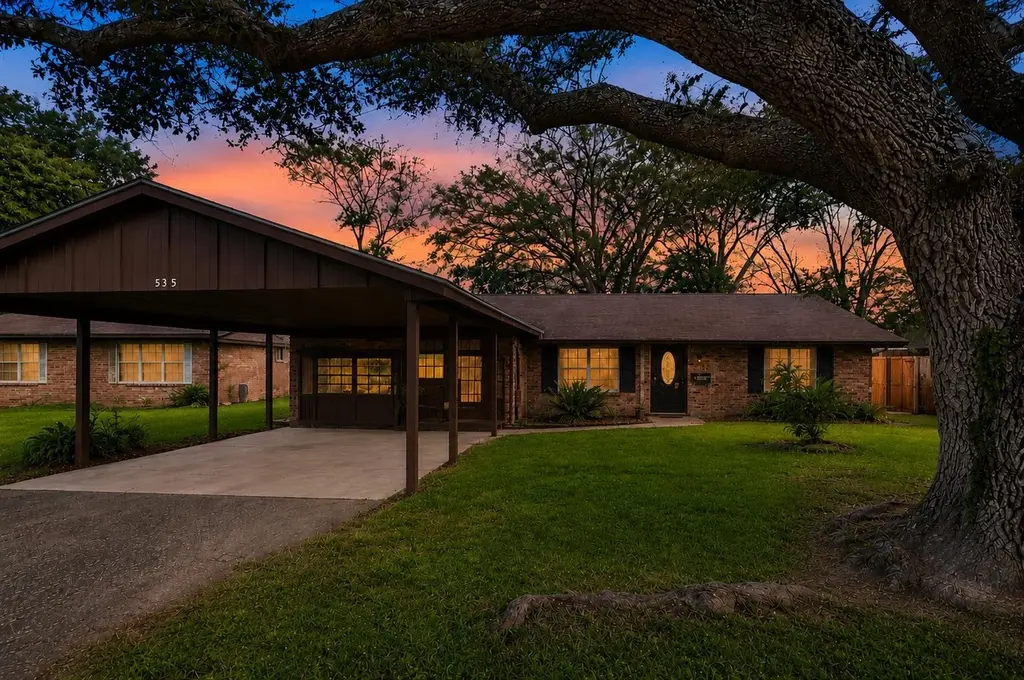
535 Eldridge Dr · Beaumont, TX
Flood risk 8/10 · Major
- FEMA flood zone
- X
- Chance of flooding over 30 yrs
- 0.99%
- Est. flood insurance / yr
- $507 – $1,088
Fire risk 1/10 · Minimal
- Est. fire insurance / yr
- $1,222 – $2,270
Heat risk 9/10 · Severe
- Hot days now (above 110°F)
- 7 days/yr
- Hot days in 30 yrs
- 24 days/yr
Wind risk 9/10 · Severe
- Chance of severe wind over 30 yrs
- 99.0%
Air-quality risk 2/10 · Minimal
- Unhealthy air days now
- 1 days/yr
- Unhealthy air days in 30 yrs
- 1 days/yr
Risk factors via First Street. Map © Google.
Why this score? — see what drove the D grade
The composite is a weighted blend of 9 inputs, each scored 0–100. Each bar is that input's sub-score; the figure is the points it added to the 100-point composite (weight × sub-score).
- Cash flow +16.6/30.0
- 1% rule +5.1/10.0
- DSCR +5.1/10.0
- ARV discount +3.9/15.0
- Livability +3.2/5.0
- Rent growth +2.5/5.0
- Condition / age +2.5/5.0
- Schools +1.5/10.0
- Appreciation +0.0/10.0
$185,000
🖨 Deal sheet (PDF) 📄 Offer letter ✓ Due diligence
Listing remarks
This beautifully updated 3-bedroom, 1.5-bathroom home in Beaumont’s desirable West End is move-in ready! Featuring new luxury vinyl plank flooring throughout, this home offers both a spacious living room and cozy den with a wood-burning fireplace, perfect for hosting family gatherings. The renovated kitchen features granite countertops, stainless steel appliances, subway tile backsplash, pantry, and an eating bar. Recent updates include a new main sewer line, and sellers will install a new roof with a reasonable offer! Enjoy inside laundry, generously sized bedrooms, updated bathrooms, a 1-car carport, and a fenced backyard with storage building. Located in the sought-after Westbrook
Key facts
- Renovated kitchen
- Granite countertops
- 8,712 sq ft lot
Tags
Property features AI
Exterior
- Parking: Attached carport; 1 carport space
- Security: Smoke detectors
- Utilities: Public water; Public sewer
- Home design: Single-family residence; Residential property; Located in Forest Park subdivision
- Construction: Brick veneer construction; Slab foundation; Composition roof
- Exterior features: Chain link fencing; Storage structure on property
Interior
- Kitchen: Dishwasher; Range
- Bathrooms: 1 full bathroom; 1 half bathroom
- Heating & cooling: Central heating (electric); Central air conditioning
- Interior features: Breakfast bar; Pantry; Wood-burning fireplace
Neighborhood map
What this means for you Summary
Snapshot
- This is a 3-bed/1.5-bath single-family listed at $185k.
Deal economics
- At list price, monthly cash flow is $44 ($530/yr) — positive.
- The deal already cash-flows at list — no discount required.
- Meets the 1% rule at list price ($2k rent vs $185k).
- Recommended offer: $182k (1.5% below list) — sets the bar for market timing.
- Cap rate 7.0% vs local median 5.3% in Beaumont — top-decile yield for the area; either an underpriced asset or a hidden risk that comps aren't pricing in. Stress-test before assuming the spread holds.
Location & tenants
- Location reads 64/100 on livability (#739 in TX) — a middle-class / working-renter tenant base. Strengths: cost of living A+, housing A+, health & safety A+; Watch: employment D, crime F, amenities F.
- Beaumont ISD (urban): math 14% / reading 22% proficiency, ranked #789 of 826 in TX (top 96%) — low school quality limits family demand, transient renter base, plan for 1-2y turnover; 69% free/reduced lunch — lower-income household profile, screen leases tightly.
- Zoned schools: Amelia El (math 8% / reading 15%, grade F, #4,225 of 4,322 statewide, top 98%, 544 students, 84% FRL); Vincent Middle (math 8% / reading 17%, grade F, #1,616 of 1,662 statewide, top 97%, 688 students, 75% FRL); West Brook Sr H S (math 19% / reading 34%, grade F, #1,228 of 1,632 statewide, top 76%, 2,245 students, 58% FRL) — zoned schools at 72% FRL track the district average.
- Market conditions: 151 active listings in the ZIP; 28 comparable units currently listed for rent nearby; rentals lingering (median 46d on market — plan ~5-8 weeks vacancy on turnover, expect pricing pressure); 54% of comp listings sitting > 30 days — soft ceiling on asking rent; 343 units permitted in Jefferson County in 2024 (0 in 5+ unit buildings).
- This rent runs 32% of the median local income ($70k/yr) — at the standard rent-burdened threshold; future hikes will face affordability resistance.
Forward outlook
- Local home prices are declining (-3.0%/yr); year-one equity from $1k of loan paydown is wiped out by about $6k of value loss. Plan a longer hold.
Negotiation context
- It's been on market 26 days — a 2% lower offer ($182k) is reasonable based on typical stale-listing flexibility.
- 3 sale attempts with the ask held roughly flat each time — persistent listings suggest the price (not the market) is what's stuck; bring a comps-based counter.
Risks & watch-outs
- Watch-outs: flood insurance adds $66/mo.
- Climate carrying-cost: severe flood risk; severe wind risk, 99% chance of damaging wind over 30y; extreme-heat days projected 7→24/yr by 2055 (HVAC capex compounding) — expect insurance premiums to compound above CPI over the hold.
Questions for the listing agent
- Built in 1962 — when were the roof, HVAC, electrical panel, plumbing, and water heater last replaced?
- What's the actual annual flood-insurance premium (NFIP or private), and is the property in a SFHA with mandatory coverage?
- Is there a deadline driving the sale (1031 exchange, divorce, estate, relocation)? That informs how much negotiation room exists.
- Schools are D-rated, which usually means shorter tenancies and higher turnover. Who's the typical renter profile here, and what's been the actual vacancy rate?
- Crime grade is F in this area — have there been break-ins, vandalism, or insurance claims at this property in the last 3 years? What carrier currently insures it and at what premium?
- The area grade is low — what's the realistic commute time and amenity access for the typical tenant pool here? Any planned neighborhood developments (good or bad) we should know about?
- What's the average days-on-market for RENTAL listings here right now (not sales)? A rising rental-DOM trend means longer vacancies and softer asking-rent achievability than the comps imply.
- What's the recent tenant-quality profile in this submarket — average credit score on applications, eviction rate, late-payment / NSF rate, and stable-employment percentage? A property-management company in the area should have these aggregated.
- How much new for-sale + rental construction is in the pipeline within 1–3 miles? Heavy new supply typically softens prices + rents 12–24 months out; constrained supply supports both.
Investment metrics
- 1% rule
- 1.01% ✓
- Cap rate
- 7.01%
- Cash-on-cash
- 2.56%
- DSCR
- 1.11
- GRM
- 8.2
CMA / ARV
- ARV (on-the-fly)
- $171,239
- Comps found
- 2
Show comp detail 2 sales within ~0.75 mi
| Address | Dist | Beds/Ba | Sqft | Sold | Price | $/sf | Match |
|---|---|---|---|---|---|---|---|
| 7730 Wickersham Pl | 0.42mi | 3/1.5 | 1,599 (+2%) | 10mo | $166,000 | $104 | 69 |
| 1310 Amelia St | 0.45mi | 4/3.0 (+1) | 1,744 (+11%) | 13mo | $190,000 | $109 | 39 |
Match score weights: distance 35% · size 25% · config 20% · recency 20%. Top-matched comps best support the ARV.
Projected returns pro-forma
-3.0% appreciation · 3.0% rent growth · sell at horizon
- IRR
- -14.6%
- Equity multiple
- 0.48×
- Total profit
- $-27,040
- Equity at exit
- $27,584
- IRR
- -5.8%
- Equity multiple
- 0.63×
- Total profit
- $-19,410
- Equity at exit
- $15,995
Cash invested: $51,800 (down + closing). Projections, not guarantees.
Landlord ↔ Tenant lean methodology
- Overall (STATE)
- 87 Strongly Landlord-Friendly
- State Texas
- 87 Strongly Landlord-Friendly · R+5
- County
- — inherits STATE
- City
- — inherits STATE
ZIP-level market 77707
- Active inventory
- 151
- Price-to-rent
- 8.2×
Monthly cashflow live
- Estimated rent
- $1,877 high interval (Pro) →
- Mortgage (P&I)
- −$970
- Tax from tax record
- −$325 /mo · $3,904/yr
- Insurance
- −$77
- Flood insurance flood zone
- −$66 /mo · $798/yr
- HOA
- −$0
- Vacancy / Maint / Mgmt
- −$394
- Net cashflow
- $44
Break-even live
Sensitivity live
| Price | -10% $149 | -5% $97 | +0% $44 | +5% $-8 | +10% $-61 |
|---|---|---|---|---|---|
| Rent | -10% $-104 | -5% $-30 | +0% $44 | +5% $118 | +10% $192 |
| Rate | -1.0pp $137 | -0.5pp $91 | base $44 | +0.5pp $-4 | +1.0pp $-53 |
UW: 25.0% down · 7.5% · 30yr · 1.5% tax · 5.0% vac · 8.0% maint · 8.0% mgmt
Financing live
Cash to close
- Down payment
- $46,250
- Closing costs
- $5,550
- Reserves months
- —
- Total cash needed
- —
Loan-product check · same deal, 3 products live
Conventional
25% down · 7.5% · 30yr
- Down + closing
- —
- Monthly P&I
- —
- Monthly cashflow
- —
- DSCR
- —
- Eligible?
- —
Personal DTI + credit; lowest rate.
DSCR
20% down · 8.5% · 30yr
- Down + closing
- —
- Monthly P&I
- —
- Monthly cashflow
- —
- DSCR
- —
- Eligible?
- —
No personal income docs; deal must DSCR.
Hard money
10% down · 12.0% · 12mo
- Down + closing
- —
- Monthly P&I
- —
- Monthly cashflow
- —
- DSCR
- —
- Eligible?
- —
Short-term bridge; refi at stabilization.
Rent comps 28 comps
| Address | Beds | Baths | Sqft | Rent | $/sqft | DOM | Units | Dist |
|---|---|---|---|---|---|---|---|---|
| 7575 Chelsea Pl Beaumont, TX | 3.0 | 2.0 | 2193 | $2,495 | $1.14 | 46d | 1 | 0.52mi |
| 379 Pinchback Rd Beaumont, TX | 2.0 | 1.5 | 1254 | $1,175 | $0.94 | 45d | 1 | 0.60mi |
| 1625 Glendale St Beaumont, TX | 3.0 | 2.0 | 1330 | $1,800 | $1.35 | 45d | 1 | 0.64mi |
| 120 Smelker St Beaumont, TX | 3.0 | 2.0 | 1300 | $1,795 | $1.38 | 15d | 1 | 0.73mi |
| 405 Harbor Oaks Dr Beaumont, TX | 3.0 | 2.5 | 1828 | $2,600 | $1.42 | 25d | 1 | 0.78mi |
| 434 Harbor Oaks Dr Beaumont, TX | 3.0 | 2.0 | 1844 | $2,500 | $1.36 | 25d | 1 | 0.78mi |
| 345 Marceline Blvd Beaumont, TX | 2.0 | 1.5 | 1200 | $1,850 | $1.54 | 23d | 1 | 0.85mi |
| 345 Marceline Blvd Beaumont, TX | 2.0 | 1.5 | 1200 | $2,250 | $1.88 | 25d | 1 | 0.85mi |
| 6561 Lexington Dr Beaumont, TX | 2.0 | 2.0 | 1321 | $1,011 | $0.77 | 45d | 1 | 0.96mi |
| 9225 Shepherd Dr Beaumont, TX | 3.0 | 1.0 | 1136 | $1,495 | $1.32 | 45d | 1 | 0.98mi |
| 9260 Josey St Beaumont, TX | 3.0 | 2.0 | 1500 | $2,100 | $1.40 | 45d | 1 | 0.98mi |
| 2065 88th Cir Beaumont, TX | 3.0 | 2.0 | 1750 | $1,800 | $1.03 | 25d | 1 | 1.14mi |
| 520 Dowlen Rd Beaumont, TX | 1.0–2.0 | 1.0–2.0 | 940 | $1,050 | $1.12 | 15d | 10 | 1.18mi |
| 8960 Manion Dr Beaumont, TX | 2.0 | 2.5 | 1358 | $1,550 | $1.14 | 45d | 1 | 1.19mi |
| 976 Sunmeadow Dr Beaumont, TX | 3.0 | 2.5 | 1656 | $1,995 | $1.20 | 15d | 1 | 1.20mi |
| 976 Sunmeadow Dr Unit 05/04/26 Beaumont, TX | 3.0 | 2.5 | 1656 | $2,150 | $1.30 | 45d | 1 | 1.20mi |
| 1170 Brandywine St Beaumont, TX | 3.0 | 2.0 | 2100 | $1,890 | $0.90 | 25d | 1 | 1.23mi |
| 880 Lockwood Dr Beaumont, TX | 3.0 | 2.0 | 1819 | $1,995 | $1.10 | 45d | 1 | 1.24mi |
| 6286 Afton Ln Beaumont, TX | 3.0 | 2.5 | 2024 | $1,675 | $0.83 | 25d | 1 | 1.28mi |
| 1212 N Major Dr Beaumont, TX | 2.0 | 1.5 | 1232 | $1,250 | $1.01 | 15d | 1 | 1.28mi |
| 1069 Green Meadow St Beaumont, TX | 2.0 | 2.0 | 1556 | $1,795 | $1.15 | 46d | 1 | 1.29mi |
| 1212 N Major Dr Unit 4820 Beaumont, TX | 3.0 | 2.5 | 1692 | $1,646 | $0.97 | 25d | 1 | 1.30mi |
| 445 Longmeadow St Beaumont, TX | 3.0 | 2.5 | 2048 | $2,100 | $1.03 | 45d | 1 | 1.31mi |
| 9540 Glen Meadow Ln Beaumont, TX | 3.0 | 2.5 | 2045 | $2,295 | $1.12 | 45d | 1 | 1.38mi |
| 551 Georgetown St Beaumont, TX | 2.0 | 1.5 | 1317 | $1,300 | $0.99 | 45d | 1 | 1.42mi |
| 6795 Greenwood Dr Beaumont, TX | 3.0 | 2.0 | 1650 | $2,500 | $1.52 | 25d | 1 | 1.44mi |
| 405 Georgetown St Beaumont, TX | 3.0 | 2.5 | 2191 | $1,600 | $0.73 | 45d | 1 | 1.44mi |
| 770 Peyton Dr Beaumont, TX | 3.0 | 2.0 | 1769 | $1,895 | $1.07 | 45d | 1 | 1.46mi |
Listing history 25 events
-
2026-06-21days on market $185,000 Active 26 DOM
-
2026-06-18days on market $185,000 Active 23 DOM
-
2026-06-17days on market $185,000 Active 22 DOM
-
2026-06-16days on market $185,000 Active 21 DOM
-
2026-06-15days on market $185,000 Active 20 DOM
-
2026-06-14days on market $185,000 Active 18 DOM
-
2026-06-13days on market $185,000 Active 17 DOM
-
2026-06-10days on market $185,000 Active 15 DOM
-
2026-06-09days on market $185,000 Active 14 DOM
-
2026-06-08days on market $185,000 Active 13 DOM
-
2026-06-07days on market $185,000 Active 12 DOM
-
2026-06-03days on market $185,000 Active 8 DOM
-
2026-06-02days on market $185,000 Active 7 DOM
-
2026-06-01days on market $185,000 Active 6 DOM
-
2026-05-31days on market $185,000 Active 5 DOM
-
2026-05-30days on market $185,000 Active 4 DOM
-
2026-05-27$185,000 Active
-
2025-03-05historical $1,625
-
2025-02-23price $1,625
-
2025-02-22price $189,000
-
2025-02-19$1,650
-
2025-02-13historical $1,650
-
2025-01-13$1,650
-
2023-12-19soldstatus
-
2023-10-13soldstatus
ⓘ Source: listings_history table (triggers on properties + properties_extension) + one-shot
backfill from property_details.listing_events for pre-trigger history.
Tax reassessment forecast TX · Resets to sale price
- Current annual tax
- $3,904 · $325/mo
- Projected year-2 tax
- $3,904 · $325/mo
- Expected delta
- $0/yr ($0/mo · 0.0%)
ⓘ Screening estimate from a state-policy table — verify with the county assessor before closing.
Climate risk First Street
- Flood 8/10 Severe FEMA zone X · 99% chance over 30 yrs
- Wildfire 1/10 Low
- Heat 9/10 Extreme 7 d/yr ≥110°F today · 24 d/yr by 30 yrs out
- Wind 9/10 Extreme 99% chance of damaging wind over 30 yrs
- Air quality 2/10 Low 1 unhealthy d/yr today · 1 by 30 yrs out
Nearby sold comps map
Loading sold comps map…
Walkable amenities ~0.75 mi
Loading nearby amenities…
Taxation est. · year 1
- Rental income
- $22,530
- − Mortgage interest
- −$10,363
- − Property taxes
- −$3,904
- − Insurance
- −$1,722
- − Repairs & maintenance
- −$1,802
- − Management
- −$1,802
- − Depreciation
- −$5,382
- Taxable loss
- −$2,447
- Est. tax savings @ 24.0%
- +$587
- After-tax cash flow
- $1,117/yr
For passive investors: Depreciation is non-cash, so a rental often shows a tax loss while cash-flowing — sheltering income. Rental losses are passive: they offset passive income freely, and up to $25,000/yr can offset ordinary (W-2) income if you actively participate and your MAGI is under $100k (phasing out to $0 by $150k); unused losses carry forward. On sale, claimed depreciation is recaptured at up to 25%, and gains may owe capital-gains tax (a 1031 exchange can defer both). Figures are a year-1 estimate at your 24.0% rate — not tax advice; consult a CPA.
Schools (NCES district)
- District
- Beaumont ISD
- NCES district ID
- 4809670
- Math proficiency
- 14% ▼ -13.00%
- Reading proficiency
- 22% ▼ -7.00%
- Median HH income
- $41,683
- Composite
- 15.43/100
- National rank
- #9316
- State rank
- #789 of 826 in TX
Livability — Beaumont
- Score
- 64/100
- State rank
- #739
- US rank
- #13710
Category grades
Schools grade is shown separately in the Schools card above.
Census & demographics
- Census place
- Beaumont, TX
- County
- Jefferson County · 203,592 people
- City population
- 125,901
- Metro
- Beaumont-Port Arthur, TX
- Population (ZIP)
- 18,323
- Household income
- $69,756
- Rent vs Own
- Severe rent burden
- 596.0
Population outlook (Jefferson County) Hauer SSP2
- Today (2025)
- 259,015 people
- By 2030
- 260,685 · +0.6%
- By 2040
- 263,309 · +1.7%
- By 2050
- 265,237 · +2.4%
- By 2075
- 270,193 · +4.3%
- By 2100
- 255,628 · -1.3%
Race, ethnicity, and origin ACS 2023
- Neighborhood character
- Highly diverse neighborhood (Simpson 0.70)
- Race & ethnicity
- Black 40% White 28% Hispanic / Latino 23% Two or more races 18% Asian 6%
- Hispanic origin (detail)
- Mexican 19%
- Common ancestry
- Lithuanian 3% Italian 1% Romanian 1%
- Foreign-born
- 12% · Canada, Vietnam
- Languages at home
- 75% English-only · Spanish 19% Vietnamese 3% Other Indo-European 1%
Political lean MEDSL · Jefferson
- 2024 margin
- Lean R (+8.9) · D 45.1% · R 54.0%
- 2008→2024 swing
- -11.1pp toward R · 2008: 2.2pp · 2024: -8.9pp
- All cycles
- 2024: R+8.9 2020: R+1.6 2016: R+0.5 2012: D+1.6 2008: D+2.2
Not yet ingested
- Civics
- —
Market trends
- HPI YoY
- ▼ -163.16%
- Current HPI
- 167.8109
- Rent YoY
- —
- Metro
- Beaumont-Port Arthur, TX
- State GDP YoY
- ▲ 3.95%
- F500 in state
- 110
Industry mix (Fortune 500 HQ in TX)
| Industry | F500 HQs | Revenue |
|---|---|---|
| Energy | 16 | $1,198B |
|
||
| Technology | 5 | $198B |
|
||
| Engineering / Construction | 4 | $72B |
|
||
| Energy Services | 3 | $60B |
|
||
| Utilities | 3 | $41B |
|
||
| Healthcare | 2 | $330B |
|
||
Price history
+11112.1% since first listed9 events — show timeline
- 2026-05-27 Listed $185,000 BBOR
- 2025-03-05 Rental Removed $1,625 BBOR
- 2025-02-23 Price Changed $1,625 BBOR
- 2025-02-22 Price Changed $189,000 BBOR
- 2025-02-19 Listed for Rent $1,650 BBOR
- 2025-02-13 Rental Removed $1,650 BBOR
- 2025-01-13 Listed for Rent $1,650 BBOR
- 2023-12-19 Sold (Public Records) — Public Records
- 2023-10-13 Sold (Public Records) — Public Records
Property tax history
+6.0%/yrLatest (2025): $3,904 · +13.4% YoY. Source: county tax records.
Cash-flow waterfall
monthlySold comps — $/sqft
last 12 mo · ≤1 miLoading sold comps…