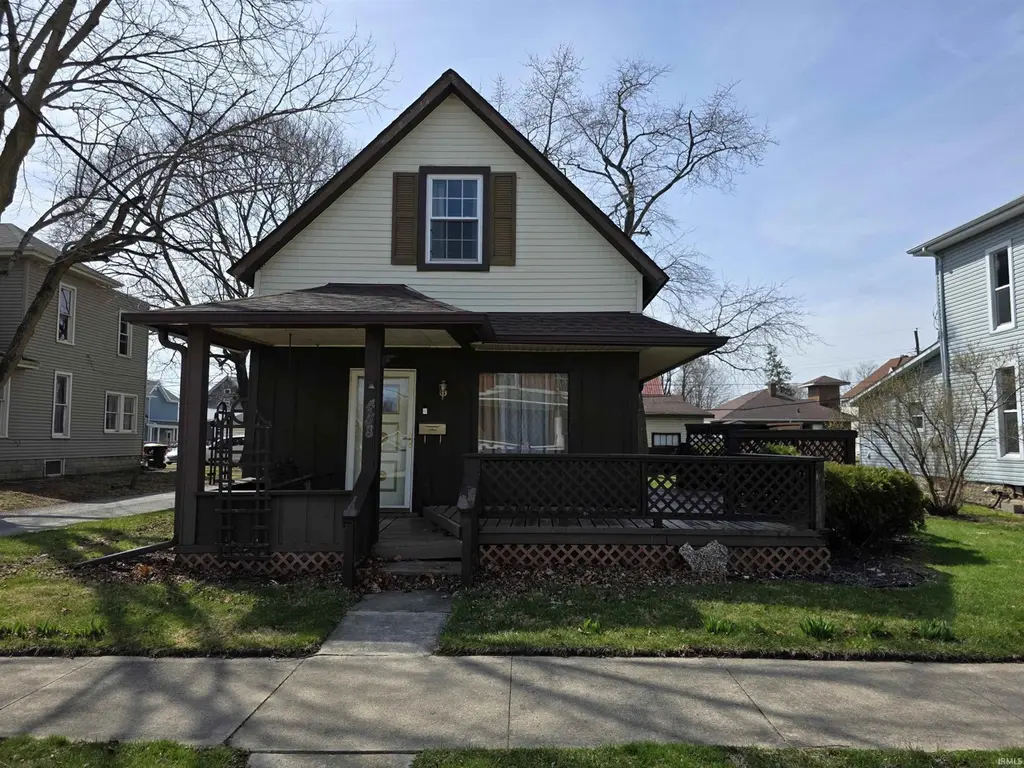
458 Whitelock St · Huntington, IN
Flood risk 1/10 · Minimal
- FEMA flood zone
- X (unshaded)
- Chance of flooding over 30 yrs
- 0.0%
- Est. flood insurance / yr
- $507 – $1,088
Fire risk 1/10 · Minimal
- Est. fire insurance / yr
- $717 – $1,331
Heat risk 3/10 · Minor
- Hot days now (above 101°F)
- 7 days/yr
- Hot days in 30 yrs
- 17 days/yr
Wind risk 2/10 · Minimal
- Chance of severe wind over 30 yrs
- —
Air-quality risk 3/10 · Minor
- Unhealthy air days now
- 1 days/yr
- Unhealthy air days in 30 yrs
- 3 days/yr
Risk factors via First Street. Map © Google.
Why this score? — see what drove the C+ grade
The composite is a weighted blend of 9 inputs, each scored 0–100. Each bar is that input's sub-score; the figure is the points it added to the 100-point composite (weight × sub-score).
- Cash flow +18.7/30.0
- ARV discount +15.0/15.0
- Appreciation +7.4/10.0
- DSCR +5.9/10.0
- 1% rule +5.0/10.0
- Livability +3.5/5.0
- Schools +3.1/10.0
- Rent growth +2.5/5.0
- Condition / age +2.5/5.0
$99,900
🖨 Deal sheet 📄 Offer letter ✓ Due diligence
Listing remarks
Welcome to this charming Huntington home situated on a desirable corner lot, offering space, character, and a fantastic opportunity to build equity. Featuring 3 bedrooms and 1 full bathroom, this home includes a convenient main-floor bedroom. Inside you will find a functional layout with plenty of natural light and room to make it your own. Whether you're a first-time buyer or an investor, this property is a true sweat equity opportunity with potential. Outside, you’ll love the huge detached garage, ideal for storage, hobbies, or a workshop setup. The corner lot provides added privacy and yard space, making it great for outdoor enjoyment or future improvements. Don’t miss your c
Key facts
- Main-floor bedroom
- Natural light
- Corner lot
Tags
Property features AI
Exterior
- Parking: Detached garage; 3 garage spaces; Off-street parking
- Utilities: Public water; Public sewer; Electric service
- Home design: Single-family residence; Site-built home; 2 stories
- Construction: Vinyl siding; Wood siding; Crawl space foundation
- Exterior features: Corner lot; Lot dimensions approximately 48 x 124
Interior
- Kitchen: Microwave; Refrigerator; Electric range
- Bedrooms: Total of 6 rooms (bedroom count not specified)
- Bathrooms: 1 full bathroom (main level)
- Heating & cooling: Natural gas forced-air heating; No cooling
- Interior features: Microwave; Refrigerator; Electric range; Electric water heater; Water heater
- Laundry & utility: Washer; Dryer; Laundry on main level
Neighborhood map
What this means for you Summary
Snapshot
- This is a 3-bed/1.0-bath single-family listed at $100k.
Deal economics
- At list price, monthly cash flow is $99 ($1k/yr) — positive.
- The deal already cash-flows at list — no discount required.
- To meet the 1% rule (rent ≥ 1% of price), the offer needs to be $100k (0.0% below list).
- Recommended offer: $97k (3.0% below list) — sets the bar for market timing.
- Cap rate 7.5% vs local median 4.3% in Huntington — top-decile yield for the area; either an underpriced asset or a hidden risk that comps aren't pricing in. Stress-test before assuming the spread holds.
Location & tenants
- Location reads 69/100 on livability (#193 in IN) — a middle-class / working-renter tenant base. Strengths: crime A+, cost of living A+, housing A+; Watch: health & safety C-, employment D, amenities F.
- Huntington County Community School Corporation (rural): math 34% / reading 39% proficiency, ranked #176 of 301 in IN (top 58%) — families likely to look elsewhere, expect single-tenant / working-renter base with shorter leases.
- Zoned schools: Lincoln Elementary School (math 22% / reading 17%, grade F, #814 of 994 statewide, top 83%, 371 students, 81% FRL); Crestview Middle School (math 28% / reading 38%, grade F, #180 of 330 statewide, top 56%, 606 students, 47% FRL); Huntington North High School (math 30% / reading 55%, grade F, #195 of 369 statewide, top 53%, 1,424 students, 42% FRL) — zoned schools average 57% FRL vs 37% district-wide (20 pts higher); higher-poverty schools than district average — tighter screening recommended.
- Market conditions: 5 active listings in the ZIP; 79 units permitted in Huntington County in 2024 (0 in 5+ unit buildings).
Forward outlook
- In year one you build about $6k of equity ($691 loan paydown + $5k appreciation (4.9% local appreciation)).
- Huntington County population projected at -14% by 2050 — secular population decline; favor cash flow + early exit over multi-decade hold.
- At projected returns (4.9% appreciation + 3.0% rent growth), your $28k cash investment doubles in ~4 years — after that, you're playing with house money.
- By year 7, paydown + projected appreciation supports a ~$36k cash-out refi (75% LTV) — recoverable capital for the next deal without selling this one.
Negotiation context
- It's been on market 47 days — a 3% lower offer ($97k) is reasonable based on typical stale-listing flexibility.
Risks & watch-outs
- Watch-outs: built in 1900 — expect roof / HVAC / electrical / plumbing capex.
Questions for the listing agent
- It's been on market 47 days. Have you received any prior offers? Is the seller open to a 3% concession, seller financing, or rate buy-down credit?
- Built in 1900 — when were the roof, HVAC, electrical panel, plumbing, and water heater last replaced?
- Is there a deadline driving the sale (1031 exchange, divorce, estate, relocation)? That informs how much negotiation room exists.
- Schools are D-rated, which usually means shorter tenancies and higher turnover. Who's the typical renter profile here, and what's been the actual vacancy rate?
- What's the average days-on-market for RENTAL listings here right now (not sales)? A rising rental-DOM trend means longer vacancies and softer asking-rent achievability than the comps imply.
- What's the recent tenant-quality profile in this submarket — average credit score on applications, eviction rate, late-payment / NSF rate, and stable-employment percentage? A property-management company in the area should have these aggregated.
- How much new for-sale + rental construction is in the pipeline within 1–3 miles? Heavy new supply typically softens prices + rents 12–24 months out; constrained supply supports both.
Investment metrics
- 1% rule
- 1.00% ✗
- Cap rate
- 7.48%
- Cash-on-cash
- 4.23%
- DSCR
- 1.19
- GRM
- 8.3
CMA / ARV
- ARV (on-the-fly)
- $122,952
- Comps found
- 12
Show comp detail 12 sales within ~0.75 mi
| Address | Dist | Beds/Ba | Sqft | Sold | Price | $/sf | Match |
|---|---|---|---|---|---|---|---|
| 458 Whitelock St | 0.00mi | 3/1.0 | 1,128 (0%) | 1mo | $85,000 | $75 | 99 |
| 637 Mayne St | 0.23mi | 2/1.0 (-1) | 1,168 (+4%) | 4mo | $81,000 | $69 | 75 |
| 419 2nd St | 0.43mi | 3/1.0 | 1,166 (+3%) | 3mo | $106,500 | $91 | 72 |
| 516 Webster St | 0.32mi | 2/1.0 (-1) | 1,180 (+5%) | 1mo | $59,000 | $50 | 71 |
| 534 Mayne St | 0.18mi | 3/2.0 | 1,033 (-8%) | 4mo | $171,000 | $166 | 71 |
| 1140 Superior St | 0.66mi | 3/1.0 | 1,144 (+1%) | 1mo | $125,000 | $109 | 66 |
| 770 Wilkerson St | 0.67mi | 3/1.0 | 1,139 (+1%) | 3mo | $60,000 | $53 | 65 |
| 1071 Henry St | 0.34mi | 2/1.0 (-1) | 1,002 (-11%) | 2mo | $145,000 | $145 | 59 |
| 823 Wright St | 0.40mi | 3/1.0 | 1,266 (+12%) | 7mo | $160,000 | $126 | 55 |
| 821 Frederick St | 0.66mi | 3/1.0 | 1,221 (+8%) | 4mo | $130,000 | $106 | 52 |
| 873 William St | 0.69mi | 3/2.0 | 1,274 (+13%) | 4mo | $174,900 | $137 | 39 |
| 1242 Dearborn St | 0.71mi | 3/1.5 | 1,283 (+14%) | 4mo | $153,000 | $119 | 39 |
Match score weights: distance 35% · size 25% · config 20% · recency 20%. Top-matched comps best support the ARV.
Projected returns pro-forma
4.87% appreciation · 3.0% rent growth · sell at horizon
- IRR
- 16.2%
- Equity multiple
- 2.02×
- Total profit
- $28,576
- Equity at exit
- $55,822
- IRR
- 16.6%
- Equity multiple
- 3.91×
- Total profit
- $81,362
- Equity at exit
- $95,693
Cash invested: $27,972 (down + closing). Projections, not guarantees.
Landlord ↔ Tenant lean methodology
- Overall (STATE)
- 90 Strongly Landlord-Friendly
- State Indiana
- 90 Strongly Landlord-Friendly · R+11
- County
- — inherits STATE
- City
- — inherits STATE
ZIP-level market 46770
- Home prices YoY
- 2.2%
- Active inventory
- 5
- Price-to-rent
- 8.3×
Monthly cashflow live
- Estimated rent
- $999 medium interval (Pro) →
- Mortgage (P&I)
- −$524
- Tax est. 1.5%
- −$125 /mo · $1,498/yr
- Insurance
- −$42
- HOA
- −$0
- Vacancy / Maint / Mgmt
- −$210
- Net cashflow
- $99
Break-even live
UW: 25.0% down · 7.5% · 30yr · 1.5% tax · 5.0% vac · 8.0% maint · 8.0% mgmt
Financing live
Cash to close
- Down payment
- $24,975
- Closing costs
- $2,997
- Reserves months
- —
- Total cash needed
- —
Loan-product check · same deal, 3 products live
Conventional
25% down · 7.5% · 30yr
- Down + closing
- —
- Monthly P&I
- —
- Monthly cashflow
- —
- DSCR
- —
- Eligible?
- —
Personal DTI + credit; lowest rate.
DSCR
20% down · 8.5% · 30yr
- Down + closing
- —
- Monthly P&I
- —
- Monthly cashflow
- —
- DSCR
- —
- Eligible?
- —
No personal income docs; deal must DSCR.
Hard money
10% down · 12.0% · 12mo
- Down + closing
- —
- Monthly P&I
- —
- Monthly cashflow
- —
- DSCR
- —
- Eligible?
- —
Short-term bridge; refi at stabilization.
Listing history 3 events
-
2026-05-06status Pending
-
2026-04-20price $99,900
-
2026-03-20$109,900 Active
ⓘ Source: listings_history table (triggers on properties + properties_extension) + one-shot
backfill from property_details.listing_events for pre-trigger history.
Climate risk First Street
- Flood 1/10 Low FEMA zone X (unshaded) · 0% chance over 30 yrs
- Wildfire 1/10 Low
- Heat 3/10 Moderate 7 d/yr ≥101°F today · 17 d/yr by 30 yrs out
- Wind 2/10 Low
- Air quality 3/10 Moderate 1 unhealthy d/yr today · 3 by 30 yrs out
Nearby sold comps map
Loading sold comps map…
Walkable amenities ~0.75 mi
Loading nearby amenities…
Taxation est. · year 1
- Rental income
- $11,984
- − Mortgage interest
- −$5,596
- − Property taxes
- −$1,498
- − Insurance
- −$500
- − Repairs & maintenance
- −$959
- − Management
- −$959
- − Depreciation
- −$2,906
- Taxable loss
- −$433
- Est. tax savings @ 24.0%
- +$104
- After-tax cash flow
- $1,287/yr
For passive investors: Depreciation is non-cash, so a rental often shows a tax loss while cash-flowing — sheltering income. Rental losses are passive: they offset passive income freely, and up to $25,000/yr can offset ordinary (W-2) income if you actively participate and your MAGI is under $100k (phasing out to $0 by $150k); unused losses carry forward. On sale, claimed depreciation is recaptured at up to 25%, and gains may owe capital-gains tax (a 1031 exchange can defer both). Figures are a year-1 estimate at your 24.0% rate — not tax advice; consult a CPA.
Schools (NCES district)
- District
- Huntington County Community School Corporation
- NCES district ID
- 1804710
- Math proficiency
- 34% ▼ -6.00%
- Reading proficiency
- 39% ▼ -10.00%
- Median HH income
- $47,010
- Composite
- 31.29/100
- National rank
- #6013
- State rank
- #176 of 301 in IN
Livability — Huntington
- Score
- 69/100
- State rank
- #193
- US rank
- #8771
Category grades
Schools grade is shown separately in the Schools card above.
Census & demographics
- Census place
- Huntington, IN
- City population
- 27,341
- Population (ZIP)
- 2,604
Population outlook (Huntington County) Hauer SSP2
- Today (2025)
- 35,613 people
- By 2030
- 34,759 · -2.4%
- By 2040
- 32,682 · -8.2%
- By 2050
- 30,495 · -14.4%
- By 2075
- 26,298 · -26.2%
- By 2100
- 22,653 · -36.4%
Race, ethnicity, and origin ACS 2023
- Neighborhood character
- Predominantly White (96%)
- Race & ethnicity
- White 96% Two or more races 1%
- Common ancestry
- Italian 2% Slovak 2% Scottish 2%
- Foreign-born
- 0%
- Languages at home
- 99% English-only · Spanish 1%
Political lean MEDSL · Huntington
- 2024 margin
- Solid R (+48.4) · D 24.9% · R 73.3% · Other 1.8%
- 2008→2024 swing
- -21.2pp toward R · 2008: -27.2pp · 2024: -48.4pp
- All cycles
- 2024: R+48.4 2020: R+49.9 2016: R+51.0 2012: R+39.8 2008: R+27.2
Not yet ingested
- Civics
- —
Market trends
- HPI YoY
- ▲ 4.87%
- Current HPI
- 230.2682
- Rent YoY
- —
- Metro
- —
- State GDP YoY
- ▲ 2.90%
- F500 in state
- 18
Industry mix (Fortune 500 HQ in IN)
| Industry | F500 HQs | Revenue |
|---|---|---|
| Industrial Machinery | 2 | $37B |
|
||
| Healthcare | 1 | $177B |
|
||
| Pharmaceuticals | 1 | $45B |
|
||
| Metals / Steel | 1 | $18B |
|
||
| Agriculture | 1 | $17B |
|
||
| Packaging | 1 | $12B |
|
||
Price history
-9.1% since first listed3 events — show timeline
- 2026-05-06 Pending — IRMLS
- 2026-04-20 Price Changed $99,900 IRMLS
- 2026-03-20 Listed $109,900 IRMLS
Property tax history
+2.0%/yrLatest (2024): $145 · +2.0% YoY. Source: county tax records.
Cash-flow waterfall
monthlySold comps — $/sqft
last 12 mo · ≤1 miLoading sold comps…