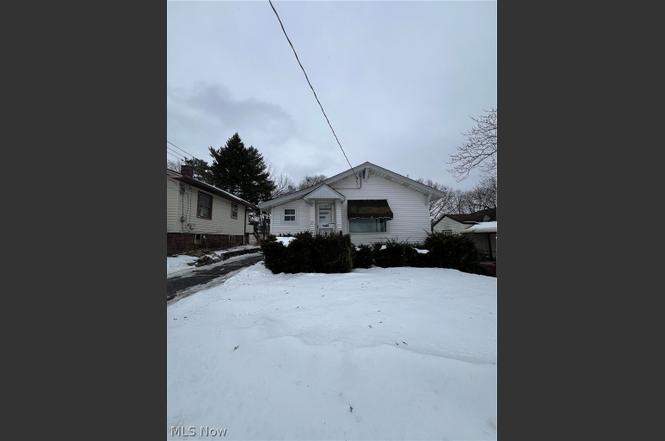
25 S Osborn Ave · Youngstown, OH
Flood risk 1/10 · Minimal
- FEMA flood zone
- X (unshaded)
- Chance of flooding over 30 yrs
- 0.0%
- Est. flood insurance / yr
- $473 – $860
Fire risk 1/10 · Minimal
- Est. fire insurance / yr
- $713 – $1,323
Heat risk 3/10 · Minor
- Hot days now (above 98°F)
- 7 days/yr
- Hot days in 30 yrs
- 17 days/yr
Wind risk 1/10 · Minimal
- Chance of severe wind over 30 yrs
- —
Air-quality risk 2/10 · Minimal
- Unhealthy air days now
- 1 days/yr
- Unhealthy air days in 30 yrs
- 2 days/yr
Risk factors via First Street. Map © Google.
Why this score? — see what drove the C+ grade
The composite is a weighted blend of 9 inputs, each scored 0–100. Each bar is that input's sub-score; the figure is the points it added to the 100-point composite (weight × sub-score).
- Cash flow +30.0/30.0
- 1% rule +10.0/10.0
- DSCR +10.0/10.0
- ARV discount +4.7/15.0
- Livability +4.0/5.0
- Rent growth +2.5/5.0
- Condition / age +2.5/5.0
- Schools +0.9/10.0
- Appreciation +0.0/10.0
$64,900
🖨 Deal sheet 📄 Offer letter ✓ Due diligence
Listing remarks MLS
Cozy 2 bedroom ranch on Westside. Loads of potential and good opportunity. o Freddie Mac will offer homebuyers and select non-profits an exclusive opportunity to purchase HomeSteps homes prior to competition from investors through the Freddie Mac First Look Initiative. This on-going initiative offers owner occupant homebuyers, Neighborhood Stabilization Program (NSP) grantees and non-profits engaged in community stabilization efforts the ability to purchase HomeSteps homes during their initial 15 days of listing, without competition from investors. The purchaser must be buying the home as their primary residence. This property is eligible under the Freddie Mac First Look Initiative through 03/24/2012
Key facts
- 5,183 sq ft lot
- Garage
- Built 1926
Property features AI
Exterior
- Parking: Detached garage (1 car)
- Utilities: Public water; Public sewer
- Home design: Single-story home; Built according to public records
- Construction: Built with vinyl siding; Asphalt/fiberglass roof
- Exterior features: Vinyl siding
Interior
- Bedrooms: 2 main-level bedrooms
- Bathrooms: 1 full bathroom on the main level
- Heating & cooling: Forced-air heating; Gas heating
- Interior features: Full unfinished basement
Neighborhood map
What this means for you Summary
Snapshot
- This is a 2-bed/1.0-bath single-family listed at $65k.
Deal economics
- At list price, monthly cash flow is $353 ($4k/yr) — positive.
- The deal already cash-flows at list — no discount required.
- Meets the 1% rule at list price ($984 rent vs $65k).
- Recommended offer: $59k (9.0% below list) — sets the bar for market timing.
- Cap rate 12.8% vs local median 7.0% in Youngstown — top-decile yield for the area; either an underpriced asset or a hidden risk that comps aren't pricing in. Stress-test before assuming the spread holds.
Location & tenants
- Location reads 81/100 on livability (#99 in OH, #1,506 nationally) — a professional / high-income tenant draw. Strengths: amenities A+, commute A+, cost of living A+; Watch: crime F, employment F.
- Youngstown City (urban): math 8% / reading 17% proficiency, ranked #649 of 656 in OH (top 99%) — low school quality limits family demand, transient renter base, plan for 1-2y turnover; 88% free/reduced lunch — lower-income household profile, screen leases tightly.
- Market conditions: 64 active listings in the ZIP; 3 comparable units currently listed for rent nearby; rentals at typical pace (median 21d on market — plan ~3-4 weeks tenant-placement turnaround); lower-income renter base — watch delinquency; 147 units permitted in Mahoning County in 2024 (0 in 5+ unit buildings).
- This rent runs 32% of the median local income ($36k/yr) — at the standard rent-burdened threshold; future hikes will face affordability resistance.
Forward outlook
- Local home prices are declining (-3.0%/yr); year-one equity from $449 of loan paydown is wiped out by about $2k of value loss. Plan a longer hold.
- Mahoning County population projected at -14% by 2050 — secular population decline; favor cash flow + early exit over multi-decade hold.
- At projected returns (-3.0% appreciation + 3.0% rent growth), your $18k cash investment doubles in ~6 years — after that, you're playing with house money.
Negotiation context
- It's been on market 102 days — a 9% lower offer ($59k) is reasonable based on typical stale-listing flexibility.
- 4 sale attempts since 20y ago; this cycle's ask has dropped $15k (19%) from the opening price — seller is motivated, your offer sets the floor, not the list.
- Current owner paid $12k; list at $65k implies a 441% gain — meaningful room to come down on a strong offer.
Risks & watch-outs
- Watch-outs: built in 1926 — expect roof / HVAC / electrical / plumbing capex.
Questions for the listing agent
- It's been on market 102 days. Have you received any prior offers? Is the seller open to a 9% concession, seller financing, or rate buy-down credit?
- Built in 1926 — when were the roof, HVAC, electrical panel, plumbing, and water heater last replaced?
- Why hasn't it sold? Are there any deal-killer items the seller is aware of (foundation, flood, title, zoning, code violations)?
- Is there a deadline driving the sale (1031 exchange, divorce, estate, relocation)? That informs how much negotiation room exists.
- Crime grade is F in this area — have there been break-ins, vandalism, or insurance claims at this property in the last 3 years? What carrier currently insures it and at what premium?
- What's the average days-on-market for RENTAL listings here right now (not sales)? A rising rental-DOM trend means longer vacancies and softer asking-rent achievability than the comps imply.
- What's the recent tenant-quality profile in this submarket — average credit score on applications, eviction rate, late-payment / NSF rate, and stable-employment percentage? A property-management company in the area should have these aggregated.
- How much new for-sale + rental construction is in the pipeline within 1–3 miles? Heavy new supply typically softens prices + rents 12–24 months out; constrained supply supports both.
Investment metrics
- 1% rule
- 1.52% ✓
- Cap rate
- 12.82%
- Cash-on-cash
- 23.31%
- DSCR
- 2.04
- GRM
- 5.5
CMA / ARV
- ARV (on-the-fly)
- $61,152
- Comps found
- 8
Show comp detail 8 sales within ~0.75 mi
| Address | Dist | Beds/Ba | Sqft | Sold | Price | $/sf | Match |
|---|---|---|---|---|---|---|---|
| 25 S Osborn Ave | 0.00mi | 2/1.0 | 728 (0%) | 0mo | $55,000 | $76 | 100 |
| 118 S Bon Air Ave | 0.15mi | 2/1.0 | 780 (+7%) | 15mo | $99,000 | $127 | 69 |
| 55 S Bon Air | 0.11mi | 2/1.0 | 780 (+7%) | 22mo | $89,000 | $114 | 64 |
| 122 Wesley Ave | 0.25mi | 2/1.0 | 656 (-10%) | 9mo | $55,000 | $84 | 64 |
| 427 Rhoda Ave | 0.45mi | 2/1.5 | 736 (+1%) | 14mo | $85,000 | $115 | 63 |
| 164 Matta Ave | 0.26mi | 2/1.0 | 773 (+6%) | 22mo | $25,000 | $32 | 59 |
| 466 N Bon Air Ave | 0.48mi | 2/1.0 | 672 (-8%) | 15mo | $35,000 | $52 | 52 |
| 41 W Heights Ave | 0.40mi | 2/1.0 | 826 (+14%) | 19mo | $32,500 | $39 | 43 |
Match score weights: distance 35% · size 25% · config 20% · recency 20%. Top-matched comps best support the ARV.
Projected returns pro-forma
-3.0% appreciation · 3.0% rent growth · sell at horizon
- IRR
- 16.4%
- Equity multiple
- 1.66×
- Total profit
- $11,968
- Equity at exit
- $9,677
- IRR
- 24.9%
- Equity multiple
- 3.17×
- Total profit
- $39,374
- Equity at exit
- $5,611
Cash invested: $18,172 (down + closing). Projections, not guarantees.
Landlord ↔ Tenant lean methodology
- Overall (STATE)
- 73 Landlord-Friendly
- State Ohio
- 73 Landlord-Friendly · R+6
- County
- — inherits STATE
- City
- — inherits STATE
ZIP-level market 44509
- Home prices YoY
- -9.3%
- Active inventory
- 64
- Price-to-rent
- 5.5×
Monthly cashflow live
- Estimated rent
- $984 medium interval (Pro) →
- Mortgage (P&I)
- −$340
- Tax from tax record
- −$57 /mo · $679/yr
- Insurance
- −$27
- HOA
- −$0
- Vacancy / Maint / Mgmt
- −$207
- Net cashflow
- $353
Break-even live
UW: 25.0% down · 7.5% · 30yr · 1.5% tax · 5.0% vac · 8.0% maint · 8.0% mgmt
Financing live
Cash to close
- Down payment
- $16,225
- Closing costs
- $1,947
- Reserves months
- —
- Total cash needed
- —
Loan-product check · same deal, 3 products live
Conventional
25% down · 7.5% · 30yr
- Down + closing
- —
- Monthly P&I
- —
- Monthly cashflow
- —
- DSCR
- —
- Eligible?
- —
Personal DTI + credit; lowest rate.
DSCR
20% down · 8.5% · 30yr
- Down + closing
- —
- Monthly P&I
- —
- Monthly cashflow
- —
- DSCR
- —
- Eligible?
- —
No personal income docs; deal must DSCR.
Hard money
10% down · 12.0% · 12mo
- Down + closing
- —
- Monthly P&I
- —
- Monthly cashflow
- —
- DSCR
- —
- Eligible?
- —
Short-term bridge; refi at stabilization.
Rent comps 3 comps
| Address | Beds | Baths | Sqft | Rent | $/sqft | DOM | Units | Dist |
|---|---|---|---|---|---|---|---|---|
| 3143 Mahoning Ave Youngstown, OH | 2.0 | 1.0 | 700 | $1,000 | $1.43 | 21d | 1 | 0.06mi |
| 1612 Mahoning Ave Unit 1612-02 Youngstown, OH | 1.0 | 1.0 | 600 | $750 | $1.25 | 21d | 1 | 1.26mi |
| 70 N Raccoon Rd Youngstown, OH | 1.0–2.0 | 1.0 | 709 | $975 | $1.38 | 13d | 1 | 1.45mi |
Listing history 14 events
-
2026-05-30status $64,900 Pending 102 DOM
-
2026-05-20price $64,900
-
2026-05-08status Active
-
2026-05-02historical Contingent
-
2026-04-06price $69,900
-
2026-03-20price $74,900
-
2026-02-16$79,900 Active
-
2012-05-10soldstatus $12,000 709-char remark
Show marketing remark (709 chars)
Cozy 2 bedroom ranch on Westside. Loads of potential and good opportunity. o Freddie Mac will offer homebuyers and select non-profits an exclusive opportunity to purchase HomeSteps homes prior to competition from investors through the Freddie Mac First Look Initiative. This on-going initiative offers owner occupant homebuyers, Neighborhood Stabilization Program (NSP) grantees and non-profits engaged in community stabilization efforts the ability to purchase HomeSteps homes during their initial 15 days of listing, without competition from investors. The purchaser must be buying the home as their primary residence. This property is eligible under the Freddie Mac First Look Initiative through 03/24/2012
-
2012-03-07$14,000 709-char remark
Show marketing remark (709 chars)
Cozy 2 bedroom ranch on Westside. Loads of potential and good opportunity. o Freddie Mac will offer homebuyers and select non-profits an exclusive opportunity to purchase HomeSteps homes prior to competition from investors through the Freddie Mac First Look Initiative. This on-going initiative offers owner occupant homebuyers, Neighborhood Stabilization Program (NSP) grantees and non-profits engaged in community stabilization efforts the ability to purchase HomeSteps homes during their initial 15 days of listing, without competition from investors. The purchaser must be buying the home as their primary residence. This property is eligible under the Freddie Mac First Look Initiative through 03/24/2012
-
2006-04-11soldstatus $34,000
-
2006-04-10soldstatus $34,000 186-char remark
Show marketing remark (186 chars)
Cozy 2 bedroom ranch on Westside. Updates include new carpeting thru out, furnace 2 years, hot water tank, electric service 100 amp, and rof shingles 1 year. Great starter or investment.
-
2006-02-10$39,900 186-char remark
Show marketing remark (186 chars)
Cozy 2 bedroom ranch on Westside. Updates include new carpeting thru out, furnace 2 years, hot water tank, electric service 100 amp, and rof shingles 1 year. Great starter or investment.
-
1993-06-11soldstatus $14,000
-
1989-08-10soldstatus $19,500
ⓘ Source: listings_history table (triggers on properties + properties_extension) + one-shot
backfill from property_details.listing_events for pre-trigger history.
Tax reassessment forecast OH · Partial reset (capped growth)
- Current annual tax
- $679 · $57/mo
- Projected year-2 tax
- $846 · $70/mo
- Expected delta
- +$167/yr (+$14/mo · 24.6%)
ⓘ Screening estimate from a state-policy table — verify with the county assessor before closing.
Climate risk First Street
- Flood 1/10 Low FEMA zone X (unshaded) · 0% chance over 30 yrs
- Wildfire 1/10 Low
- Heat 3/10 Moderate 7 d/yr ≥98°F today · 17 d/yr by 30 yrs out
- Wind 1/10 Low
- Air quality 2/10 Low 1 unhealthy d/yr today · 2 by 30 yrs out
Nearby sold comps map
Loading sold comps map…
Walkable amenities ~0.75 mi
Loading nearby amenities…
Taxation est. · year 1
- Rental income
- $11,802
- − Mortgage interest
- −$3,635
- − Property taxes
- −$679
- − Insurance
- −$324
- − Repairs & maintenance
- −$944
- − Management
- −$944
- − Depreciation
- −$1,888
- Taxable income
- $3,387
- Est. tax owed @ 24.0%
- −$813
- After-tax cash flow
- $3,424/yr
For passive investors: Depreciation is non-cash, so a rental often shows a tax loss while cash-flowing — sheltering income. Rental losses are passive: they offset passive income freely, and up to $25,000/yr can offset ordinary (W-2) income if you actively participate and your MAGI is under $100k (phasing out to $0 by $150k); unused losses carry forward. On sale, claimed depreciation is recaptured at up to 25%, and gains may owe capital-gains tax (a 1031 exchange can defer both). Figures are a year-1 estimate at your 24.0% rate — not tax advice; consult a CPA.
Schools (NCES district)
- District
- Youngstown City
- NCES district ID
- 3904516
- Math proficiency
- 8% ▼ -15.00%
- Reading proficiency
- 17% ▼ -10.00%
- Median HH income
- $25,257
- Composite
- 9.29/100
- National rank
- #9858
- State rank
- #649 of 656 in OH
Livability — Youngstown
- Score
- 81/100
- State rank
- #99
- US rank
- #1506
Category grades
Schools grade is shown separately in the Schools card above.
Census & demographics
- Census place
- Youngstown, OH
- County
- Mahoning · 224,175 people
- City population
- 28,503
- Metro
- Youngstown-Warren, OH
- Population (ZIP)
- 10,775
- Household income
- $36,472
- Rent vs Own
- Severe rent burden
- 10.4
Population outlook (Mahoning County) Hauer SSP2
- Today (2025)
- 223,932 people
- By 2030
- 218,387 · -2.5%
- By 2040
- 205,367 · -8.3%
- By 2050
- 193,606 · -13.5%
- By 2075
- 173,694 · -22.4%
- By 2100
- 151,147 · -32.5%
Race, ethnicity, and origin ACS 2023
- Neighborhood character
- Diverse neighborhood (Simpson 0.58)
- Race & ethnicity
- White 58% Black 27% Hispanic / Latino 9% Two or more races 8%
- Hispanic origin (detail)
- Puerto Rican 4%
- Common ancestry
- Slovak 2% Subsaharan African 2% Romanian 2%
- Foreign-born
- 3% · Canada
- Languages at home
- 93% English-only · Spanish 5%
Political lean MEDSL · Mahoning
- 2024 margin
- Lean R (+9.4) · D 44.9% · R 54.4%
- 2008→2024 swing
- -36.1pp toward R · 2008: 26.6pp · 2024: -9.4pp
- All cycles
- 2024: R+9.4 2020: R+1.9 2016: D+3.0 2012: D+27.7 2008: D+26.6
Not yet ingested
- Civics
- —
Market trends
- HPI YoY
- ▼ -22.34%
- Current HPI
- 217.0797
- Rent YoY
- —
- Metro
- —
- State GDP YoY
- ▲ 1.98%
- F500 in state
- 48
Industry mix (Fortune 500 HQ in OH)
| Industry | F500 HQs | Revenue |
|---|---|---|
| Insurance | 3 | $145B |
|
||
| Industrial Machinery | 3 | $49B |
|
||
| Financial Services | 3 | $24B |
|
||
| Consumer Goods | 2 | $93B |
|
||
| Aerospace / Defense | 2 | $47B |
|
||
| Utilities | 2 | $33B |
|
||
Price history
+232.8% since first listed13 events — show timeline
- 2026-05-20 Price Changed $64,900 MLSNOW
- 2026-05-08 Relisted — MLSNOW
- 2026-05-02 Contingent — MLSNOW
- 2026-04-06 Price Changed $69,900 MLSNOW
- 2026-03-20 Price Changed $74,900 MLSNOW
- 2026-02-16 Listed $79,900 MLSNOW
- 2012-05-10 Sold (MLS) $12,000 MLSNOW
- 2012-03-07 Listed $14,000 MLSNOW
- 2006-04-11 Sold (Public Records) $34,000 Public Records
- 2006-04-10 Sold (MLS) $34,000 MLSNOW
- 2006-02-10 Listed $39,900 MLSNOW
- 1993-06-11 Sold (Public Records) $14,000 Public Records
- 1989-08-10 Sold (Public Records) $19,500 Public Records
Property tax history
+0.8%/yrLatest (2025): $679 · -11.9% YoY. Source: county tax records.
Cash-flow waterfall
monthlySold comps — $/sqft
last 12 mo · ≤1 miLoading sold comps…