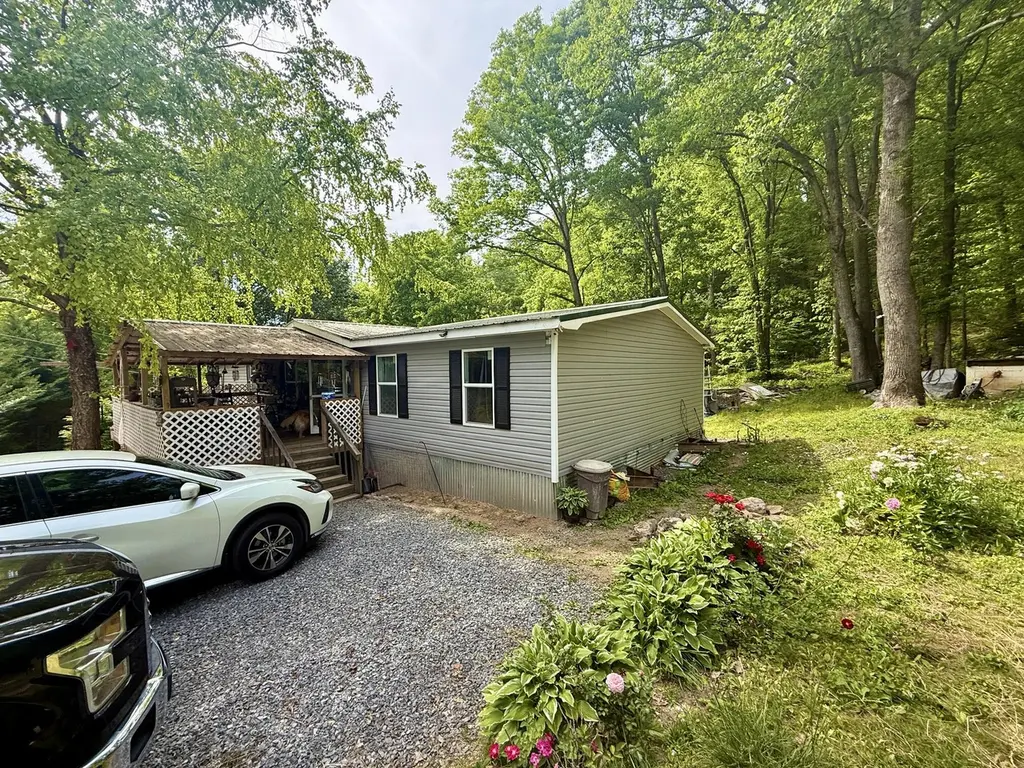
4221 Lindsey Gap Rd · Cosby, TN
Flood risk 10/10 · Severe
- FEMA flood zone
- X (unshaded)
- Chance of flooding over 30 yrs
- 1.0%
- Est. flood insurance / yr
- $507 – $1,088
Fire risk 6/10 · Moderate
- Est. fire insurance / yr
- $949 – $1,763
Heat risk 4/10 · Minor
- Hot days now (above 93°F)
- 7 days/yr
- Hot days in 30 yrs
- 21 days/yr
Wind risk 2/10 · Minimal
- Chance of severe wind over 30 yrs
- —
Air-quality risk 2/10 · Minimal
- Unhealthy air days now
- 1 days/yr
- Unhealthy air days in 30 yrs
- 1 days/yr
Risk factors via First Street. Map © Google.
Why this score? — see what drove the D+ grade
The composite is a weighted blend of 9 inputs, each scored 0–100. Each bar is that input's sub-score; the figure is the points it added to the 100-point composite (weight × sub-score).
- ARV discount +15.0/15.0
- Appreciation +10.0/10.0
- Cash flow +8.2/30.0
- 1% rule +2.5/10.0
- Rent growth +2.5/5.0
- Livability +2.5/5.0
- Condition / age +2.5/5.0
- DSCR +2.2/10.0
- Schools +1.7/10.0
$199,000
🖨 Deal sheet (PDF) 📄 Offer letter ✓ Due diligence
Listing remarks
1638 square feet Doublewide manufactured home recently remodeled. 3 Bedroom, 2 full bathrooms, extra room. Large covered front porch. Home was placed on site within the past year. However, is an older remodeled home. Looks terrific. Well-kept home. Metal roof, vinyl replacement windows, Heat package electric heat and air conditioning. Located in beautiful Cosby Tennessee. Short drive to Interstate I-40 exit. Nice rural setting.
Key facts
- Metal roof
- Recently remodeled
- Nice rural setting
Tags
Property features AI
Exterior
- Utilities: Private well water; Septic tank; Electricity connected (220 volts in laundry)
- Home design: Manufactured house; One story
- Construction: Asphalt roof; 1,638 above-grade finished area
- Exterior features: Porch
Interior
- Kitchen: Dishwasher; Electric oven; Refrigerator
- Flooring: Carpet; Laminate
- Bathrooms: 2 full bathrooms
- Heating & cooling: Heat pump for heating and cooling
- Interior features: Metal fireplace; 8 total rooms
- Laundry & utility: Dedicated laundry room
Neighborhood map
What this means for you Summary
Snapshot
- This is a 4-bed/2.0-bath other listed at $199k.
Deal economics
- At list price, monthly cash flow is $-255 ($-3k/yr) — negative.
- To cash-flow at today's rent, offer at most $162k (18.6% below list).
- To meet the 1% rule (rent ≥ 1% of price), the offer needs to be $150k (24.5% below list).
- Recommended offer: $150k (24.5% below list) — sets the bar for 1% rule.
- Cap rate 5.2% vs local median 2.3% in Cosby — top-decile yield for the area; either an underpriced asset or a hidden risk that comps aren't pricing in. Stress-test before assuming the spread holds.
Location & tenants
- Location reads: area grade D — affects rentability + tenant quality, not the cash-flow math above.
- Cocke County (rural): math 21% / reading 21% proficiency, ranked #112 of 139 in TN (top 81%) — low school quality limits family demand, transient renter base, plan for 1-2y turnover; 71% free/reduced lunch — lower-income household profile, screen leases tightly.
- Zoned schools: Smoky Mountain Elementary (math 37% / reading 27%, grade F, #369 of 952 statewide, top 42%, 178 students, 0% FRL); Cosby High School (math 8% / reading 27%, grade F, #215 of 332 statewide, top 67%, 326 students, 0% FRL) — zoned schools average 0% FRL vs 71% district-wide (71 pts lower); this property's tenant base skews higher-income than the district average.
- Market conditions: 171 active listings in the ZIP; 13 units permitted in Cocke County in 2024 (0 in 5+ unit buildings).
Forward outlook
- In year one you build about $21k of equity ($1k loan paydown + $20k appreciation (10.0% local appreciation)).
- Cocke County population projected at -19% by 2050 — secular population decline; favor cash flow + early exit over multi-decade hold.
- By year 2, paydown + projected appreciation supports a ~$34k cash-out refi (75% LTV) — recoverable capital for the next deal without selling this one.
Negotiation context
- It's been on market 40 days — a 3% lower offer ($193k) is reasonable based on typical stale-listing flexibility.
Risks & watch-outs
- Watch-outs: flood insurance adds $66/mo.
- Climate carrying-cost: severe flood risk; major wildfire risk — expect insurance premiums to compound above CPI over the hold.
Questions for the listing agent
- What do current leases actually rent for vs. the listed asking? Can we see a recent rent roll and the last 12 months of T-12 income?
- It's been on market 40 days. Have you received any prior offers? Is the seller open to a 25% concession, seller financing, or rate buy-down credit?
- What's the actual annual flood-insurance premium (NFIP or private), and is the property in a SFHA with mandatory coverage?
- Is there a deadline driving the sale (1031 exchange, divorce, estate, relocation)? That informs how much negotiation room exists.
- The area grade is low — what's the realistic commute time and amenity access for the typical tenant pool here? Any planned neighborhood developments (good or bad) we should know about?
- What's the average days-on-market for RENTAL listings here right now (not sales)? A rising rental-DOM trend means longer vacancies and softer asking-rent achievability than the comps imply.
- What's the recent tenant-quality profile in this submarket — average credit score on applications, eviction rate, late-payment / NSF rate, and stable-employment percentage? A property-management company in the area should have these aggregated.
- How much new for-sale + rental construction is in the pipeline within 1–3 miles? Heavy new supply typically softens prices + rents 12–24 months out; constrained supply supports both.
Investment metrics
- 1% rule
- 0.75% ✗
- Cap rate
- 5.15%
- Cash-on-cash
- -4.07%
- DSCR
- 0.82
- GRM
- 11.0
CMA / ARV
- ARV (median comp)
- $352,958
- List price
- $199,000
- Delta
- -43.62%
- Verdict
- UNDERPRICED
- Comps
- 4 within 2.0 mi
Projected returns pro-forma
10.0% appreciation · 3.0% rent growth · sell at horizon
- IRR
- 20.4%
- Equity multiple
- 2.65×
- Total profit
- $92,176
- Equity at exit
- $179,275
- IRR
- 18.6%
- Equity multiple
- 6.10×
- Total profit
- $284,363
- Equity at exit
- $386,613
Cash invested: $55,720 (down + closing). Projections, not guarantees.
Landlord ↔ Tenant lean methodology
- Overall (STATE)
- 87 Strongly Landlord-Friendly
- State Tennessee
- 87 Strongly Landlord-Friendly · R+13
- County
- — inherits STATE
- City
- — inherits STATE
ZIP-level market 37722
- Home prices YoY
- 27.9%
- Active inventory
- 171
- Price-to-rent
- 11.0×
Monthly cashflow live
- Estimated rent
- $1,502 medium interval (Pro) →
- Mortgage (P&I)
- −$1,044
- Tax est. 1.5%
- −$249 /mo · $2,985/yr
- Insurance
- −$83
- Flood insurance flood zone
- −$66 /mo · $798/yr
- HOA
- −$0
- Vacancy / Maint / Mgmt
- −$315
- Net cashflow
- $-255
Break-even live
Sensitivity live
| Price | -10% $-118 | -5% $-187 | +0% $-255 | +5% $-324 | +10% $-393 |
|---|---|---|---|---|---|
| Rent | -10% $-374 | -5% $-315 | +0% $-255 | +5% $-196 | +10% $-137 |
| Rate | -1.0pp $-155 | -0.5pp $-205 | base $-255 | +0.5pp $-307 | +1.0pp $-359 |
UW: 25.0% down · 7.5% · 30yr · 1.5% tax · 5.0% vac · 8.0% maint · 8.0% mgmt
Financing live
Cash to close
- Down payment
- $49,750
- Closing costs
- $5,970
- Reserves months
- —
- Total cash needed
- —
Loan-product check · same deal, 3 products live
Conventional
25% down · 7.5% · 30yr
- Down + closing
- —
- Monthly P&I
- —
- Monthly cashflow
- —
- DSCR
- —
- Eligible?
- —
Personal DTI + credit; lowest rate.
DSCR
20% down · 8.5% · 30yr
- Down + closing
- —
- Monthly P&I
- —
- Monthly cashflow
- —
- DSCR
- —
- Eligible?
- —
No personal income docs; deal must DSCR.
Hard money
10% down · 12.0% · 12mo
- Down + closing
- —
- Monthly P&I
- —
- Monthly cashflow
- —
- DSCR
- —
- Eligible?
- —
Short-term bridge; refi at stabilization.
Listing history 18 events
-
2026-06-21days on market $199,000 Active 40 DOM
-
2026-06-19days on market $199,000 Active 38 DOM
-
2026-06-18days on market $199,000 Active 37 DOM
-
2026-06-17days on market $199,000 Active 36 DOM
-
2026-06-16days on market $199,000 Active 35 DOM
-
2026-06-15days on market $199,000 Active 34 DOM
-
2026-06-14days on market $199,000 Active 32 DOM
-
2026-06-13days on market $199,000 Active 31 DOM
-
2026-06-10days on market $199,000 Active 29 DOM
-
2026-06-09days on market $199,000 Active 28 DOM
-
2026-06-08days on market $199,000 Active 27 DOM
-
2026-06-07days on market $199,000 Active 26 DOM
-
2026-06-05days on market $199,000 Active 23 DOM
-
2026-06-02days on market $199,000 Active 21 DOM
-
2026-06-01days on market $199,000 Active 20 DOM
-
2026-05-31days on market $199,000 Active 19 DOM
-
2026-05-30days on market $199,000 Active 18 DOM
-
2026-05-12$199,000 Active 431-char remark
ⓘ Source: listings_history table (triggers on properties + properties_extension) + one-shot
backfill from property_details.listing_events for pre-trigger history.
Climate risk First Street
- Flood 10/10 Extreme FEMA zone X (unshaded) · 100% chance over 30 yrs
- Wildfire 6/10 Major
- Heat 4/10 Moderate 7 d/yr ≥93°F today · 21 d/yr by 30 yrs out
- Wind 2/10 Low
- Air quality 2/10 Low 1 unhealthy d/yr today · 1 by 30 yrs out
Nearby sold comps map
Loading sold comps map…
Walkable amenities ~0.75 mi
Loading nearby amenities…
Taxation est. · year 1
- Rental income
- $18,019
- − Mortgage interest
- −$11,147
- − Property taxes
- −$2,985
- − Insurance
- −$1,792
- − Repairs & maintenance
- −$1,442
- − Management
- −$1,442
- − Depreciation
- −$5,789
- Taxable loss
- −$6,577
- Est. tax savings @ 24.0%
- +$1,579
- After-tax cash flow
- $-1,487/yr
For passive investors: Depreciation is non-cash, so a rental often shows a tax loss while cash-flowing — sheltering income. Rental losses are passive: they offset passive income freely, and up to $25,000/yr can offset ordinary (W-2) income if you actively participate and your MAGI is under $100k (phasing out to $0 by $150k); unused losses carry forward. On sale, claimed depreciation is recaptured at up to 25%, and gains may owe capital-gains tax (a 1031 exchange can defer both). Figures are a year-1 estimate at your 24.0% rate — not tax advice; consult a CPA.
Schools (NCES district)
- District
- Cocke County
- NCES district ID
- 4700750
- Math proficiency
- 21% ▼ -10.00%
- Reading proficiency
- 21% ▼ -10.00%
- Median HH income
- $33,486
- Composite
- 17.17/100
- National rank
- #9109
- State rank
- #112 of 139 in TN
Livability — Cosby
No livability data for this city. (Only ~50 U.S. cities are tracked.)
Census & demographics
- Population (ZIP)
- 7,430
Population outlook (Cocke County) Hauer SSP2
- Today (2025)
- 33,586 people
- By 2030
- 32,394 · -3.5%
- By 2040
- 29,727 · -11.5%
- By 2050
- 27,075 · -19.4%
- By 2075
- 22,590 · -32.7%
- By 2100
- 19,643 · -41.5%
Race, ethnicity, and origin ACS 2023
- Neighborhood character
- Predominantly White (91%)
- Race & ethnicity
- White 91% Hispanic / Latino 6% Two or more races 4% Native American 2%
- Hispanic origin (detail)
- Puerto Rican 1% Cuban 1%
- Common ancestry
- Slovak 5% Romanian 1% Iranian 1%
- Foreign-born
- 4% · Canada, Guatemala, China
- Languages at home
- 95% English-only · Spanish 4%
Political lean MEDSL · Cocke
- 2024 margin
- Solid R (+68.2) · D 15.4% · R 83.7%
- 2008→2024 swing
- -23.3pp toward R · 2008: -44.9pp · 2024: -68.2pp
- All cycles
- 2024: R+68.2 2020: R+64.8 2016: R+64.5 2012: R+49.4 2008: R+44.9
Not yet ingested
- Civics
- —
Market trends
- HPI YoY
- ▲ 85.12%
- Current HPI
- 390.2959
- Rent YoY
- —
- Metro
- —
- State GDP YoY
- ▲ 2.78%
- F500 in state
- 22
Industry mix (Fortune 500 HQ in TN)
| Industry | F500 HQs | Revenue |
|---|---|---|
| Healthcare | 3 | $91B |
|
||
| Retail | 3 | $72B |
|
||
| Transportation / Logistics | 1 | $88B |
|
||
| Paper / Packaging | 1 | $19B |
|
||
| Insurance | 1 | $13B |
|
||
| Energy | 1 | $12B |
|
||
Price history
1 event — show timeline
- 2026-05-12 Listed $199,000 LAAR
Property tax history
-1.2%/yrLatest (2025): $108 · +18.7% YoY. Source: county tax records.
Cash-flow waterfall
monthlySold comps — $/sqft
last 12 mo · ≤1 miLoading sold comps…