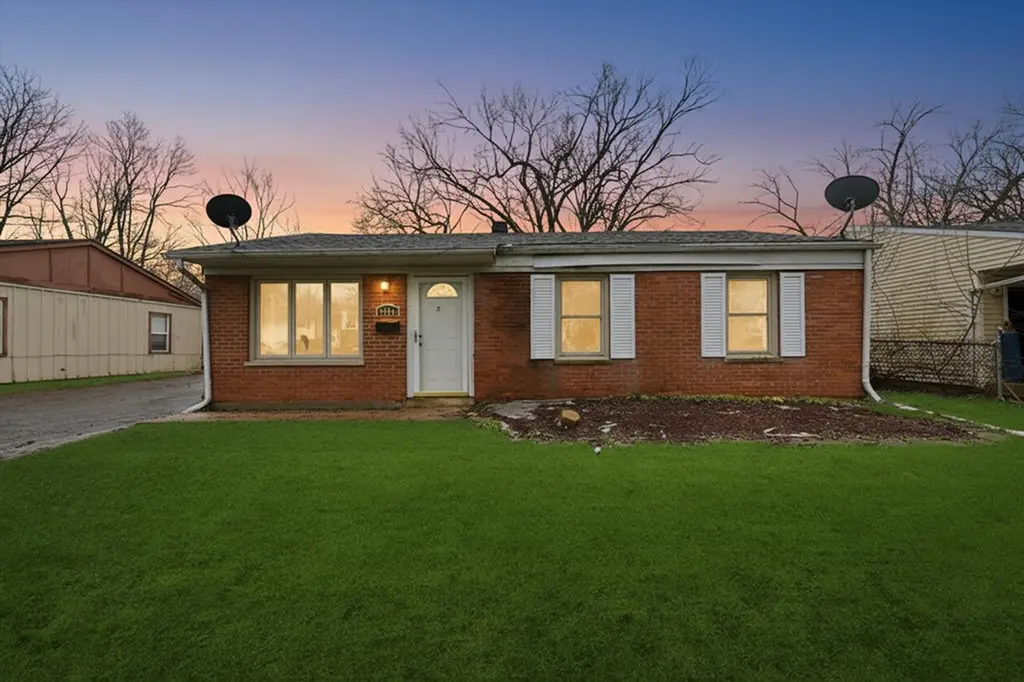
2016 215th Pl · Sauk Village, IL
Flood risk 1/10 · Minimal
- FEMA flood zone
- X (unshaded)
- Chance of flooding over 30 yrs
- 0.0%
- Est. flood insurance / yr
- $473 – $860
Fire risk 1/10 · Minimal
- Est. fire insurance / yr
- $804 – $1,492
Heat risk 3/10 · Minor
- Hot days now (above 101°F)
- 7 days/yr
- Hot days in 30 yrs
- 15 days/yr
Wind risk 2/10 · Minimal
- Chance of severe wind over 30 yrs
- 1.0%
Air-quality risk 2/10 · Minimal
- Unhealthy air days now
- 2 days/yr
- Unhealthy air days in 30 yrs
- 2 days/yr
Risk factors via First Street. Map © Google.
Why this score? — see what drove the B+ grade
The composite is a weighted blend of 9 inputs, each scored 0–100. Each bar is that input's sub-score; the figure is the points it added to the 100-point composite (weight × sub-score).
- Cash flow +30.0/30.0
- ARV discount +15.0/15.0
- 1% rule +10.0/10.0
- DSCR +10.0/10.0
- Rent growth +4.1/5.0
- Livability +3.3/5.0
- Condition / age +2.5/5.0
- Schools +0.7/10.0
- Appreciation +0.0/10.0
$108,000
🖨 Deal sheet 📄 Offer letter ✓ Due diligence
Listing remarks MLS
Cozy and updated Brick 3 bedroom 1 bath home perfect for the 1st time buyer with lots of potential. Nice Size Living Room and Family room on main level. Eat in kitchen features oak cabinetry , 2 appliances Stove & Fridge to be installed before closing and plenty of counter space and area to fit table & chairs. . Partial basement, nice size backyard, side drive leads to garage. Bring your buyers and see all this GEM has to offer.
Key facts
- Oak cabinetry
- Partial basement
- Eat-in kitchen
Tags
Property features AI
Finance
- Other: Lot dimensions approx. 61 x 110; Lot size about 0.25–0.49 acre; Directions: Sauk Trail to Merrill North to 215th Pl east to home
- HOA & community: No master association fee required
Exterior
- Parking: Detached, owned garage (1 garage space; 1 total parking)
- Utilities: Public water; Public sewer
- Home design: Detached single-family home; Split-level with sub-basement; Fee simple ownership; Rehab completed in 2018; Built prior to 1978
- Construction: Brick construction; Asphalt roof; Property age roughly 61–70 years
- Exterior features: Commuter bus access and nearby interstate access
Interior
- Kitchen: Eating-area kitchen (approx. 15 x 13); Range; Refrigerator
- Bedrooms: Three bedrooms (all on main level); Master bedroom on main level (approx. 12 x 10); Second bedroom on main level (approx. 10 x 9); Third bedroom on main level (approx. 9 x 9)
- Flooring: Carpet in living room, family room, master and other bedrooms; Ceramic tile in kitchen
- Bathrooms: One full bathroom
- Heating & cooling: Natural gas forced-air heating; Central air conditioning
- Interior features: Six total rooms; Basement is unfinished/partial
- Laundry & utility: Laundry in basement (approx. 14 x 14); Gas and electric dryer hookups
Neighborhood map
What this means for you Summary
Snapshot
- This is a 3-bed/1.0-bath single-family listed at $108k.
Deal economics
- At list price, monthly cash flow is $491 ($6k/yr) — positive.
- The deal already cash-flows at list — no discount required.
- Meets the 1% rule at list price ($2k rent vs $108k).
- Recommended offer: $106k (1.5% below list) — sets the bar for market timing.
- Cap rate 11.8% vs local median 8.2% in Sauk Village — top-decile yield for the area; either an underpriced asset or a hidden risk that comps aren't pricing in. Stress-test before assuming the spread holds.
Location & tenants
- Location reads 66/100 on livability (#546 in IL) — a middle-class / working-renter tenant base. Strengths: cost of living A+, housing A+; Watch: crime C-, health & safety D+, commute D.
- Bloom Twp Hsd 206 (suburban): math 8% / reading 9% proficiency, ranked #591 of 620 in IL (top 95%) — low school quality limits family demand, transient renter base, plan for 1-2y turnover.
- Market conditions: Rents rising fast (+6.5%/yr); 222 active listings in the ZIP; 6 comparable units currently listed for rent nearby; rentals at typical pace (median 19d on market — plan ~3-4 weeks tenant-placement turnaround); 6,272 units permitted in Cook County in 2024 (4,658 in 5+ unit buildings).
- This rent runs 34% of the median local income ($62k/yr) — at the standard rent-burdened threshold; future hikes will face affordability resistance.
Forward outlook
- Local home prices are declining (-3.0%/yr); year-one equity from $747 of loan paydown is wiped out by about $3k of value loss. Plan a longer hold.
- At projected returns (-3.0% appreciation + 6.5% rent growth), your $30k cash investment doubles in ~6 years — after that, you're playing with house money.
Negotiation context
- It's been on market 15 days — a 2% lower offer ($106k) is reasonable based on typical stale-listing flexibility.
- 7 sale attempts since 20y ago with the ask held roughly flat each time — persistent listings suggest the price (not the market) is what's stuck; bring a comps-based counter.
- Current owner paid $50k; list at $108k implies a 116% gain — meaningful room to come down on a strong offer.
Risks & watch-outs
- Watch-outs: property tax is 3.3% of price.
Questions for the listing agent
- Built in 1961 — when were the roof, HVAC, electrical panel, plumbing, and water heater last replaced?
- Property tax is high relative to price — has the assessment been appealed recently, and will the sale trigger a re-assessment?
- Is there a deadline driving the sale (1031 exchange, divorce, estate, relocation)? That informs how much negotiation room exists.
- Schools are F-rated, which usually means shorter tenancies and higher turnover. Who's the typical renter profile here, and what's been the actual vacancy rate?
- What's the average days-on-market for RENTAL listings here right now (not sales)? A rising rental-DOM trend means longer vacancies and softer asking-rent achievability than the comps imply.
- What's the recent tenant-quality profile in this submarket — average credit score on applications, eviction rate, late-payment / NSF rate, and stable-employment percentage? A property-management company in the area should have these aggregated.
- How much new for-sale + rental construction is in the pipeline within 1–3 miles? Heavy new supply typically softens prices + rents 12–24 months out; constrained supply supports both.
Investment metrics
- 1% rule
- 1.64% ✓
- Cap rate
- 11.75%
- Cash-on-cash
- 19.49%
- DSCR
- 1.87
- GRM
- 5.1
CMA / ARV
- ARV (on-the-fly)
- $169,832
- Comps found
- 12
Show comp detail 12 sales within ~0.75 mi
| Address | Dist | Beds/Ba | Sqft | Sold | Price | $/sf | Match |
|---|---|---|---|---|---|---|---|
| 21607 Gailine Ave | 0.13mi | 3/1.0 | 1,200 (+0%) | 6mo | $189,000 | $158 | 88 |
| 1908 215th Pl | 0.12mi | 3/1.0 | 1,250 (+4%) | 2mo | $120,000 | $96 | 85 |
| 2129 219th St | 0.33mi | 3/1.0 | 1,200 (+0%) | 1mo | $170,000 | $142 | 83 |
| 2117 217th St | 0.14mi | 4/1.0 (+1) | 1,134 (-5%) | 1mo | $90,000 | $79 | 79 |
| 21618 Gailine Ave | 0.16mi | 4/2.0 (+1) | 1,271 (+6%) | 0mo | $192,000 | $151 | 73 |
| 2106 216th St | 0.11mi | 3/2.0 | 1,337 (+12%) | 2mo | $75,000 | $56 | 69 |
| 22150 Chappel Ave | 0.63mi | 3/1.0 | 1,200 (+0%) | 1mo | $156,000 | $130 | 69 |
| 21946 Merrill Ave | 0.46mi | 3/1.0 | 1,130 (-6%) | 2mo | $175,000 | $155 | 68 |
| 21604 Clyde Ave | 0.10mi | 3/1.0 | 1,020 (-15%) | 5mo | $67,500 | $66 | 67 |
| 1618 Constance Ave | 0.39mi | 3/1.0 | 1,326 (+11%) | 0mo | $213,000 | $161 | 63 |
| 2210 220th St | 0.55mi | 3/1.0 | 1,088 (-9%) | 2mo | $173,500 | $159 | 58 |
| 2258 Rush St | 0.72mi | 3/2.0 | 1,140 (-5%) | 1mo | $159,873 | $140 | 54 |
Match score weights: distance 35% · size 25% · config 20% · recency 20%. Top-matched comps best support the ARV.
Projected returns pro-forma
-3.0% appreciation · 6.48% rent growth · sell at horizon
- IRR
- 15.9%
- Equity multiple
- 1.67×
- Total profit
- $20,316
- Equity at exit
- $16,103
- IRR
- 27.3%
- Equity multiple
- 3.87×
- Total profit
- $86,727
- Equity at exit
- $9,338
Cash invested: $30,240 (down + closing). Projections, not guarantees.
Landlord ↔ Tenant lean methodology
- Overall (STATE)
- 43 Moderately Tenant-Leaning
- State Illinois
- 43 Moderately Tenant-Leaning · D+7
- County
- — inherits STATE
- City
- — inherits STATE
ZIP-level market 60411
- Home prices YoY
- -33.9%
- Rents YoY
- 6.5%
- Active inventory
- 222
- Price-to-rent
- 5.1×
Monthly cashflow live
- Estimated rent
- $1,768 high interval (Pro) →
- Mortgage (P&I)
- −$566
- Tax from tax record
- −$294 /mo · $3,531/yr
- Insurance
- −$45
- HOA
- −$0
- Vacancy / Maint / Mgmt
- −$371
- Net cashflow
- $491
Break-even live
UW: 25.0% down · 7.5% · 30yr · 1.5% tax · 5.0% vac · 8.0% maint · 8.0% mgmt
Financing live
Cash to close
- Down payment
- $27,000
- Closing costs
- $3,240
- Reserves months
- —
- Total cash needed
- —
Loan-product check · same deal, 3 products live
Conventional
25% down · 7.5% · 30yr
- Down + closing
- —
- Monthly P&I
- —
- Monthly cashflow
- —
- DSCR
- —
- Eligible?
- —
Personal DTI + credit; lowest rate.
DSCR
20% down · 8.5% · 30yr
- Down + closing
- —
- Monthly P&I
- —
- Monthly cashflow
- —
- DSCR
- —
- Eligible?
- —
No personal income docs; deal must DSCR.
Hard money
10% down · 12.0% · 12mo
- Down + closing
- —
- Monthly P&I
- —
- Monthly cashflow
- —
- DSCR
- —
- Eligible?
- —
Short-term bridge; refi at stabilization.
Rent comps 6 comps
| Address | Beds | Baths | Sqft | Rent | $/sqft | DOM | Units | Dist |
|---|---|---|---|---|---|---|---|---|
| 21538 Gailine Ave Chicago Heights, IL | 3.0 | 1.0 | 1031 | $1,600 | $1.55 | 3d | 1 | 0.16mi |
| 2236 220th St Sauk Village, IL | 3.0 | 1.0 | 1008 | $1,800 | $1.79 | 24d | 1 | 0.55mi |
| 2241 Astor St Unit Labs Sauk Village, IL | 2.0 | 2.0 | 1000 | $1,650 | $1.65 | 1d | 1 | 0.68mi |
| 1154 Barry Ln Sauk Village, IL | 2.0 | 2.0 | 960 | $1,550 | $1.61 | 1d | 1 | 0.70mi |
| 22332 Clyde Ave Sauk Village, IL | 3.0 | 1.0 | 925 | $1,800 | $1.95 | 24d | 1 | 0.88mi |
| 22340 Chappel Ave Sauk Village, IL | 3.0 | 1.0 | 1100 | $1,800 | $1.64 | 18d | 1 | 0.91mi |
Listing history 11 events
-
2026-06-18days on market $108,000 Active 15 DOM
-
2026-06-17days on market $108,000 Active 14 DOM
-
2026-06-16days on market $108,000 Active 13 DOM
-
2026-06-15days on market $108,000 Active 12 DOM
-
2026-06-13days on market $108,000 Active 10 DOM
-
2026-06-13days on market $108,000 Active 9 DOM
-
2026-06-09days on market $108,000 Active 6 DOM
-
2026-06-08days on market $108,000 Active 5 DOM
-
2026-06-07days on market $108,000 Active 4 DOM
-
2026-06-03remarks 699-char remark
-
2026-06-03$108,000 Active 1 DOM
ⓘ Source: listings_history table (triggers on properties + properties_extension) + one-shot
backfill from property_details.listing_events for pre-trigger history.
Tax reassessment forecast IL · Partial reset (capped growth)
- Current annual tax
- $3,531 · $294/mo
- Projected year-2 tax
- $3,531 · $294/mo
- Expected delta
- $0/yr ($0/mo · 0.0%)
ⓘ Screening estimate from a state-policy table — verify with the county assessor before closing.
Climate risk First Street
- Flood 1/10 Low FEMA zone X (unshaded) · 0% chance over 30 yrs
- Wildfire 1/10 Low
- Heat 3/10 Moderate 7 d/yr ≥101°F today · 15 d/yr by 30 yrs out
- Wind 2/10 Low 100% chance of damaging wind over 30 yrs
- Air quality 2/10 Low 2 unhealthy d/yr today · 2 by 30 yrs out
Nearby sold comps map
Loading sold comps map…
Walkable amenities ~0.75 mi
Loading nearby amenities…
Taxation est. · year 1
- Rental income
- $21,218
- − Mortgage interest
- −$6,050
- − Property taxes
- −$3,531
- − Insurance
- −$540
- − Repairs & maintenance
- −$1,697
- − Management
- −$1,697
- − Depreciation
- −$3,142
- Taxable income
- $4,560
- Est. tax owed @ 24.0%
- −$1,094
- After-tax cash flow
- $4,800/yr
For passive investors: Depreciation is non-cash, so a rental often shows a tax loss while cash-flowing — sheltering income. Rental losses are passive: they offset passive income freely, and up to $25,000/yr can offset ordinary (W-2) income if you actively participate and your MAGI is under $100k (phasing out to $0 by $150k); unused losses carry forward. On sale, claimed depreciation is recaptured at up to 25%, and gains may owe capital-gains tax (a 1031 exchange can defer both). Figures are a year-1 estimate at your 24.0% rate — not tax advice; consult a CPA.
Schools (NCES district)
- District
- Bloom Twp Hsd 206
- NCES district ID
- 1706420
- Math proficiency
- 8% ▼ -3.00%
- Reading proficiency
- 9% ▼ -8.00%
- Median HH income
- $39,795
- Composite
- 7.4/100
- National rank
- #9952
- State rank
- #591 of 620 in IL
Livability — Sauk Village
- Score
- 66/100
- State rank
- #546
- US rank
- #11370
Category grades
Schools grade is shown separately in the Schools card above.
Census & demographics
- Census place
- Sauk Village, IL
- County
- Cook County · 4,486,803 people
- Metro
- Chicago-Naperville-Elgin, IL-IN-WI
- Population (ZIP)
- 52,175
- Household income
- $62,073
- Rent vs Own
- Severe rent burden
- 1714.0
Population outlook (Cook County) Hauer SSP2
- Today (2025)
- 5,347,519 people
- By 2030
- 5,357,703 · +0.2%
- By 2040
- 5,324,924 · -0.4%
- By 2050
- 5,230,762 · -2.2%
- By 2075
- 4,785,735 · -10.5%
- By 2100
- 4,188,836 · -21.7%
Race, ethnicity, and origin ACS 2023
- Neighborhood character
- Diverse neighborhood (Simpson 0.66)
- Race & ethnicity
- Black 49% Hispanic / Latino 26% White 19% Two or more races 11%
- Hispanic origin (detail)
- Mexican 22% Puerto Rican 2%
- Common ancestry
- Romanian 4% Portuguese 1% Lithuanian 1%
- Foreign-born
- 12% · Canada
- Languages at home
- 76% English-only · Spanish 21% Russian/Polish/Slavic 1% Other Indo-European 1%
Political lean MEDSL · Cook
- 2024 margin
- Solid D (+42.0) · D 70.4% · R 28.4% · Other 1.2%
- 2008→2024 swing
- -11.4pp toward R · 2008: 53.4pp · 2024: 42.0pp
- All cycles
- 2024: D+42.0 2020: D+50.3 2016: D+53.0 2012: D+49.4 2008: D+53.4
Not yet ingested
- Civics
- —
Market trends
- HPI YoY
- ▼ -108.75%
- Current HPI
- 212.4058
- Rent YoY
- ▲ 6.48%
- Metro
- Chicago-Naperville-Elgin, IL-IN-WI
- State GDP YoY
- ▲ 1.59%
- F500 in state
- 60
Industry mix (Fortune 500 HQ in IL)
| Industry | F500 HQs | Revenue |
|---|---|---|
| Insurance | 4 | $201B |
|
||
| Consumer Goods | 4 | $87B |
|
||
| Industrial Machinery | 3 | $64B |
|
||
| Healthcare | 2 | $55B |
|
||
| Retail / Pharmacy | 1 | $148B |
|
||
| Agriculture / Food | 1 | $86B |
|
||
Price history
+80.0% since first listed21 events — show timeline
- 2026-06-03 Listed $108,000 MRED as Distributed by MLS Grid
- 2019-06-25 Sold (Public Records) $50,000 Public Records
- 2019-06-24 Sold (MLS) $50,000 MRED as Distributed by MLS Grid
- 2019-03-11 Contingent — MRED as Distributed by MLS Grid
- 2019-02-27 Listing Removed — MRED as Distributed by MLS Grid
- 2019-02-27 Listed $52,500 MRED as Distributed by MLS Grid
- 2018-11-28 Price Changed — MRED as Distributed by MLS Grid
- 2018-11-07 Listed — MRED as Distributed by MLS Grid
- 2013-09-18 Sold (MLS) $20,501 MRED as Distributed by MLS Grid
- 2013-07-18 Pending — MRED as Distributed by MLS Grid
- 2013-07-11 Price Changed $22,500 MRED as Distributed by MLS Grid
- 2013-05-28 Relisted — MRED as Distributed by MLS Grid
- 2013-05-17 Listing Removed — MRED as Distributed by MLS Grid
- 2013-05-17 Listed $25,000 MRED as Distributed by MLS Grid
- 2009-01-19 Listing Removed — MRED as Distributed by MLS Grid
- 2008-10-20 Listed — MRED as Distributed by MLS Grid
- 2008-03-06 Listing Removed — MRED as Distributed by MLS Grid
- 2006-09-06 Listed — MRED as Distributed by MLS Grid
- 2002-09-12 Sold (Public Records) $82,000 Public Records
- 1999-04-21 Sold (Public Records) $56,000 Public Records
- 1992-04-24 Sold (Public Records) $60,000 Public Records
Property tax history
+3.4%/yrLatest (2023): $3,531 · +56.2% YoY. Source: county tax records.
Cash-flow waterfall
monthlySold comps — $/sqft
last 12 mo · ≤1 miLoading sold comps…