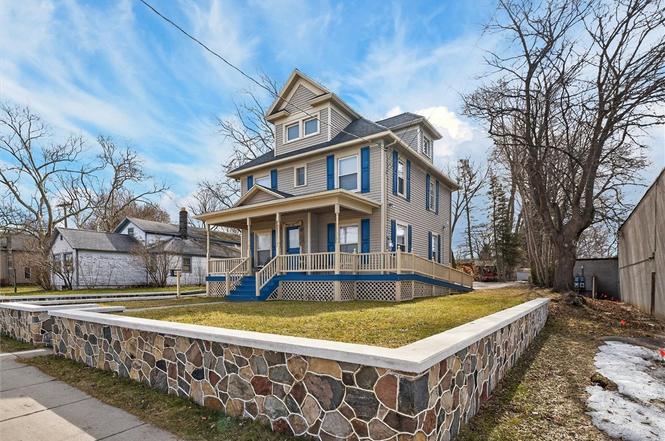
506 W Union St · Newark, NY
Flood risk No data
- FEMA flood zone
- —
- Chance of flooding over 30 yrs
- —
- Est. flood insurance / yr
- —
Fire risk No data
- Est. fire insurance / yr
- —
Heat risk No data
- Hot days now (above threshold)
- —
- Hot days in 30 yrs
- —
Wind risk No data
- Chance of severe wind over 30 yrs
- —
Air-quality risk No data
- Unhealthy air days now
- —
- Unhealthy air days in 30 yrs
- —
Risk factors via First Street. Map © Google.
Why this score? — see what drove the C+ grade
The composite is a weighted blend of 9 inputs, each scored 0–100. Each bar is that input's sub-score; the figure is the points it added to the 100-point composite (weight × sub-score).
- Cash flow +23.3/30.0
- ARV discount +15.0/15.0
- DSCR +7.5/10.0
- 1% rule +6.1/10.0
- Livability +3.6/5.0
- Schools +3.4/10.0
- Rent growth +2.5/5.0
- Condition / age +2.5/5.0
- Appreciation +0.0/10.0
$149,900
🖨 Deal sheet 📄 Offer letter ✓ Due diligence
Listing remarks
BACK ON MARKET NO FAULT OF THE HOUSE OR SELLERS (BUYERS FINANCING ISSUE) This beautifully remodeled 2-story Craftsman-style home built in 1900 blends timeless character with modern updates throughout. You’ll fall in love with the stunning original woodwork that showcase the craftsmanship of a bygone era. The spacious layout offers 4 large bedrooms and 1.5 baths, including a convenient first-floor bedroom or den and second-floor laundry. The home has been freshly remodeled from top to bottom, featuring all-new flooring, fresh paint in every room, and a completely brand-new kitchen with new cabinetry, two pantries, farmhouse sink, countertops, new appliances, and garbage disposal. The
Key facts
- First-floor bedroom
- New kitchen
- Second-floor laundry
Tags
Neighborhood map
What this means for you Summary
Snapshot
- This is a 4-bed/1.5-bath single-family listed at $150k.
Deal economics
- At list price, monthly cash flow is $275 ($3k/yr) — positive.
- The deal already cash-flows at list — no discount required.
- Meets the 1% rule at list price ($2k rent vs $150k).
- Cap rate 8.5% vs local median 5.0% in Newark — top-decile yield for the area; either an underpriced asset or a hidden risk that comps aren't pricing in. Stress-test before assuming the spread holds.
Location & tenants
- Location reads 71/100 on livability (#405 in NY) — a middle-class / working-renter tenant base. Strengths: cost of living A+, housing A+, commute B; Watch: schools D+, employment D+, crime F.
- Newark Central School District (town): math 33% / reading 46% proficiency, ranked #527 of 590 in NY (top 89%) — families likely to look elsewhere, expect single-tenant / working-renter base with shorter leases.
- Market conditions: 44 active listings in the ZIP; 259 units permitted in Wayne County in 2024 (90 in 5+ unit buildings).
Forward outlook
- Local home prices are declining (-3.0%/yr); year-one equity from $1k of loan paydown is wiped out by about $4k of value loss. Plan a longer hold.
- Wayne County population projected at -24% by 2050 — secular population decline; favor cash flow + early exit over multi-decade hold.
Negotiation context
- Only 13 days on market — expect competitive offers; lowballing is unlikely to land.
Risks & watch-outs
- Watch-outs: built in 1900 — expect roof / HVAC / electrical / plumbing capex.
Questions for the listing agent
- Built in 1900 — when were the roof, HVAC, electrical panel, plumbing, and water heater last replaced?
- Is there a deadline driving the sale (1031 exchange, divorce, estate, relocation)? That informs how much negotiation room exists.
- Schools are D-rated, which usually means shorter tenancies and higher turnover. Who's the typical renter profile here, and what's been the actual vacancy rate?
- Crime grade is F in this area — have there been break-ins, vandalism, or insurance claims at this property in the last 3 years? What carrier currently insures it and at what premium?
- What's the average days-on-market for RENTAL listings here right now (not sales)? A rising rental-DOM trend means longer vacancies and softer asking-rent achievability than the comps imply.
- What's the recent tenant-quality profile in this submarket — average credit score on applications, eviction rate, late-payment / NSF rate, and stable-employment percentage? A property-management company in the area should have these aggregated.
- How much new for-sale + rental construction is in the pipeline within 1–3 miles? Heavy new supply typically softens prices + rents 12–24 months out; constrained supply supports both.
Investment metrics
- 1% rule
- 1.11% ✓
- Cap rate
- 8.49%
- Cash-on-cash
- 7.86%
- DSCR
- 1.35
- GRM
- 7.5
CMA / ARV
- ARV (on-the-fly)
- $192,948
- Comps found
- 8
Show comp detail 8 sales within ~0.75 mi
| Address | Dist | Beds/Ba | Sqft | Sold | Price | $/sf | Match |
|---|---|---|---|---|---|---|---|
| 426 W Miller St | 0.28mi | 3/1.0 (-1) | 2,208 (-4%) | 7mo | $184,900 | $84 | 68 |
| 315 W Miller St | 0.43mi | 3/1.5 (-1) | 2,200 (-4%) | 9mo | $152,000 | $69 | 60 |
| 439 West Ave | 0.63mi | 3/1.5 (-1) | 2,318 (+1%) | 12mo | $205,000 | $88 | 54 |
| 447 West Ave | 0.65mi | 3/2.0 (-1) | 2,184 (-5%) | 7mo | $197,000 | $90 | 49 |
| 205 Madison St | 0.57mi | 4/1.5 | 2,032 (-12%) | 8mo | $117,500 | $58 | 47 |
| 210 Elmwood Ave | 0.43mi | 5/2.5 (+1) | 2,583 (+12%) | 6mo | $285,000 | $110 | 46 |
| 148 Willow Ave | 0.62mi | 3/2.0 (-1) | 2,176 (-5%) | 14mo | $83,000 | $38 | 44 |
| 107 Bartle Ave | 0.74mi | 3/1.5 (-1) | 2,012 (-12%) | 11mo | $159,000 | $79 | 30 |
Match score weights: distance 35% · size 25% · config 20% · recency 20%. Top-matched comps best support the ARV.
Projected returns pro-forma
-3.0% appreciation · 3.0% rent growth · sell at horizon
- IRR
- -4.3%
- Equity multiple
- 0.84×
- Total profit
- $-6,749
- Equity at exit
- $22,351
- IRR
- 5.4%
- Equity multiple
- 1.40×
- Total profit
- $16,780
- Equity at exit
- $12,961
Cash invested: $41,972 (down + closing). Projections, not guarantees.
Landlord ↔ Tenant lean methodology
- Overall (STATE)
- 15 Strongly Tenant-Friendly
- State New York
- 15 Strongly Tenant-Friendly · D+10
- County
- — inherits STATE
- City
- — inherits STATE
ZIP-level market 14513
- Home prices YoY
- -16.7%
- Active inventory
- 44
- Price-to-rent
- 7.5×
Monthly cashflow live
- Estimated rent
- $1,659 medium interval (Pro) →
- Mortgage (P&I)
- −$786
- Tax est. 1.5%
- −$187 /mo · $2,248/yr
- Insurance
- −$62
- HOA
- −$0
- Vacancy / Maint / Mgmt
- −$348
- Net cashflow
- $275
Break-even live
UW: 25.0% down · 7.5% · 30yr · 1.5% tax · 5.0% vac · 8.0% maint · 8.0% mgmt
Financing live
Cash to close
- Down payment
- $37,475
- Closing costs
- $4,497
- Reserves months
- —
- Total cash needed
- —
Loan-product check · same deal, 3 products live
Conventional
25% down · 7.5% · 30yr
- Down + closing
- —
- Monthly P&I
- —
- Monthly cashflow
- —
- DSCR
- —
- Eligible?
- —
Personal DTI + credit; lowest rate.
DSCR
20% down · 8.5% · 30yr
- Down + closing
- —
- Monthly P&I
- —
- Monthly cashflow
- —
- DSCR
- —
- Eligible?
- —
No personal income docs; deal must DSCR.
Hard money
10% down · 12.0% · 12mo
- Down + closing
- —
- Monthly P&I
- —
- Monthly cashflow
- —
- DSCR
- —
- Eligible?
- —
Short-term bridge; refi at stabilization.
Listing history 5 events
-
2026-06-18days on market $149,900 Active 13 DOM
-
2026-06-17status $149,900 Active 12 DOM
-
2026-03-23status Pending
-
2026-03-18historical Active Under Contract
-
2026-03-10$149,900 Active
ⓘ Source: listings_history table (triggers on properties + properties_extension) + one-shot
backfill from property_details.listing_events for pre-trigger history.
Nearby sold comps map
Loading sold comps map…
Walkable amenities ~0.75 mi
Loading nearby amenities…
Taxation est. · year 1
- Rental income
- $19,913
- − Mortgage interest
- −$8,397
- − Property taxes
- −$2,248
- − Insurance
- −$750
- − Repairs & maintenance
- −$1,593
- − Management
- −$1,593
- − Depreciation
- −$4,361
- Taxable income
- $972
- Est. tax owed @ 24.0%
- −$233
- After-tax cash flow
- $3,067/yr
For passive investors: Depreciation is non-cash, so a rental often shows a tax loss while cash-flowing — sheltering income. Rental losses are passive: they offset passive income freely, and up to $25,000/yr can offset ordinary (W-2) income if you actively participate and your MAGI is under $100k (phasing out to $0 by $150k); unused losses carry forward. On sale, claimed depreciation is recaptured at up to 25%, and gains may owe capital-gains tax (a 1031 exchange can defer both). Figures are a year-1 estimate at your 24.0% rate — not tax advice; consult a CPA.
Schools (NCES district)
- District
- Newark Central School District
- NCES district ID
- 3620640
- Math proficiency
- 33% ▲ 2.00%
- Reading proficiency
- 46% ▲ 15.00%
- Median HH income
- $44,966
- Composite
- 33.55/100
- National rank
- #5428
- State rank
- #527 of 590 in NY
Livability — Newark
- Score
- 71/100
- State rank
- #405
- US rank
- #6978
Category grades
Schools grade is shown separately in the Schools card above.
Census & demographics
- Census place
- Newark, NY
- Population (ZIP)
- 13,501
Population outlook (Wayne County) Hauer SSP2
- Today (2025)
- 85,662 people
- By 2030
- 81,945 · -4.3%
- By 2040
- 73,735 · -13.9%
- By 2050
- 65,029 · -24.1%
- By 2075
- 47,451 · -44.6%
- By 2100
- 31,574 · -63.1%
Race, ethnicity, and origin ACS 2023
- Neighborhood character
- Predominantly White (80%)
- Race & ethnicity
- White 80% Hispanic / Latino 12% Two or more races 10% Black 3% Native American 1%
- Hispanic origin (detail)
- Puerto Rican 5%
- Common ancestry
- Iranian 13% Lithuanian 2% Romanian 2%
- Foreign-born
- 4% · Canada, Vietnam
- Languages at home
- 92% English-only · Spanish 7%
Political lean MEDSL · Wayne
- 2024 margin
- Strong R (+23.1) · D 38.5% · R 61.5%
- 2008→2024 swing
- -13.2pp toward R · 2008: -9.9pp · 2024: -23.1pp
- All cycles
- 2024: R+23.1 2020: R+19.6 2016: R+26.1 2012: R+9.3 2008: R+9.9
Not yet ingested
- Civics
- —
Market trends
- HPI YoY
- ▼ -50.98%
- Current HPI
- 253.627
- Rent YoY
- —
- Metro
- —
- State GDP YoY
- ▲ 2.60%
- F500 in state
- 92
Industry mix (Fortune 500 HQ in NY)
| Industry | F500 HQs | Revenue |
|---|---|---|
| Financial Services | 10 | $950B |
|
||
| Consumer Goods | 9 | $162B |
|
||
| Insurance | 4 | $225B |
|
||
| Telecommunications | 2 | $144B |
|
||
| Pharmaceuticals | 2 | $112B |
|
||
| Media / Entertainment | 2 | $69B |
|
||
Price history
3 events — show timeline
- 2026-03-23 Pending — UNYREIS
- 2026-03-18 Contingent — UNYREIS
- 2026-03-10 Listed $149,900 UNYREIS
Cash-flow waterfall
monthlySold comps — $/sqft
last 12 mo · ≤1 miLoading sold comps…