7 West Ave · Moravia, NY
Flood risk 1/10 · Minimal
- FEMA flood zone
- A
- Chance of flooding over 30 yrs
- 0.0%
- Est. flood insurance / yr
- $946 – $6,584
Fire risk 1/10 · Minimal
- Est. fire insurance / yr
- $691 – $1,283
Heat risk 3/10 · Minor
- Hot days now (above 92°F)
- 8 days/yr
- Hot days in 30 yrs
- 18 days/yr
Wind risk 1/10 · Minimal
- Chance of severe wind over 30 yrs
- 0.0%
Air-quality risk 2/10 · Minimal
- Unhealthy air days now
- 0 days/yr
- Unhealthy air days in 30 yrs
- 1 days/yr
Risk factors via First Street. Map © Google.
Why this score? — see what drove the A grade
The composite is a weighted blend of 9 inputs, each scored 0–100. Each bar is that input's sub-score; the figure is the points it added to the 100-point composite (weight × sub-score).
- Cash flow +30.0/30.0
- ARV discount +15.0/15.0
- 1% rule +10.0/10.0
- DSCR +10.0/10.0
- Appreciation +10.0/10.0
- Schools +4.2/10.0
- Livability +3.6/5.0
- Rent growth +2.5/5.0
- Condition / age +2.5/5.0
$140,000
🖨 Deal sheet 📄 Offer letter ✓ Due diligence
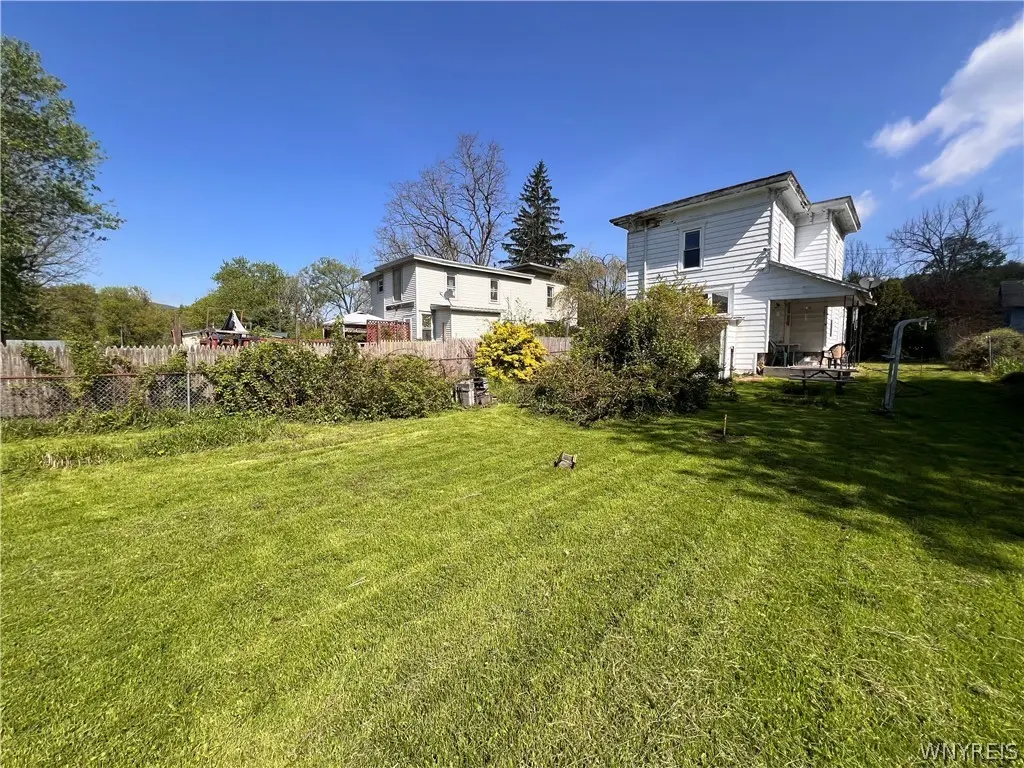
Listing remarks
Charming 3-bedroom, 2-bath home offering 1,792 sq ft on a quiet dead-end street in Moravia. Features include a garage, long driveway, quarter-acre lot, established berry bushes, grape vines, and a fenced in yard full of character and potential. Major mechanical update includes a new furnace installed in 2025. Home offers generous living space and opportunity for cosmetic updates and personalization while maintaining its warmth and charm. #BA is owner verified Property being sold as-is.
Key facts
- Grape vines
- New furnace
- Quarter-acre lot
Tags
Property features AI
Exterior
- Parking: Detached garage with electricity; Garage provides 1 parking space
- Utilities: Public water connected; Sewer connected; Cable available; Circuit breaker electrical system
- Home design: Two-story house; Existing (previously built) structure
- Construction: Aluminum siding and wood siding; Asphalt roof; Foundation of block and stone
- Exterior features: Fully fenced yard; Gravel driveway; Road frontage on a city street; Rectangular residential lot (approx. 57 x 157)
Interior
- Kitchen: Gas range; Gas oven; Refrigerator
- Bedrooms: Total of 8 rooms including bedroom spaces (see rooms list for specific room types)
- Flooring: Hardwood; Laminate; Varies
- Bathrooms: Two full bathrooms; One main-level bathroom
- Heating & cooling: Gas heating; Forced air; Hot water heating; Stove heating; HVAC energy-efficient features
- Interior features: Ceiling fan(s); Separate/formal dining room; Eat-in kitchen
- Laundry & utility: Washer and dryer; Laundry located in the basement; Gas water heater
Neighborhood map
What this means for you Summary
Snapshot
- This is a 3-bed/2.0-bath single-family listed at $140k.
Deal economics
- At list price, monthly cash flow is $670 ($8k/yr) — positive.
- The deal already cash-flows at list — no discount required.
- Meets the 1% rule at list price ($2k rent vs $140k).
- Recommended offer: $136k (3.0% below list) — sets the bar for market timing.
- Cap rate 14.7% vs local median 5.7% in Moravia — top-decile yield for the area; either an underpriced asset or a hidden risk that comps aren't pricing in. Stress-test before assuming the spread holds.
Location & tenants
- Location reads 72/100 on livability (#357 in NY) — a middle-class / working-renter tenant base. Strengths: cost of living A+, housing A+, health & safety A+; Watch: schools D+, amenities F, commute F.
- Moravia Central School District (rural): math 42% / reading 56% proficiency, ranked #391 of 590 in NY (top 66%) — families likely to look elsewhere, expect single-tenant / working-renter base with shorter leases.
- Market conditions: 28 active listings in the ZIP; 161 units permitted in Cayuga County in 2024 (65 in 5+ unit buildings).
Forward outlook
- In year one you build about $15k of equity ($968 loan paydown + $14k appreciation (10.0% local appreciation)).
- Cayuga County population projected at -18% by 2050 — secular population decline; favor cash flow + early exit over multi-decade hold.
- At projected returns (10.0% appreciation + 3.0% rent growth), your $39k cash investment doubles in ~2 years — after that, you're playing with house money.
- By year 3, paydown + projected appreciation supports a ~$38k cash-out refi (75% LTV) — recoverable capital for the next deal without selling this one.
Negotiation context
- It's been on market 31 days — a 3% lower offer ($136k) is reasonable based on typical stale-listing flexibility.
- Current owner paid $55k; list at $140k implies a 155% gain — meaningful room to come down on a strong offer.
Risks & watch-outs
- Watch-outs: flood insurance adds $314/mo; built in 1880 — expect roof / HVAC / electrical / plumbing capex.
- Climate carrying-cost: in FEMA flood zone A (mandatory federal flood insurance) — expect insurance premiums to compound above CPI over the hold.
Questions for the listing agent
- It's been on market 31 days. Have you received any prior offers? Is the seller open to a 3% concession, seller financing, or rate buy-down credit?
- Built in 1880 — when were the roof, HVAC, electrical panel, plumbing, and water heater last replaced?
- What's the actual annual flood-insurance premium (NFIP or private), and is the property in a SFHA with mandatory coverage?
- Is there a deadline driving the sale (1031 exchange, divorce, estate, relocation)? That informs how much negotiation room exists.
- Schools are D-rated, which usually means shorter tenancies and higher turnover. Who's the typical renter profile here, and what's been the actual vacancy rate?
- What's the average days-on-market for RENTAL listings here right now (not sales)? A rising rental-DOM trend means longer vacancies and softer asking-rent achievability than the comps imply.
- What's the recent tenant-quality profile in this submarket — average credit score on applications, eviction rate, late-payment / NSF rate, and stable-employment percentage? A property-management company in the area should have these aggregated.
- How much new for-sale + rental construction is in the pipeline within 1–3 miles? Heavy new supply typically softens prices + rents 12–24 months out; constrained supply supports both.
Investment metrics
- 1% rule
- 1.73% ✓
- Cap rate
- 14.73%
- Cash-on-cash
- 30.13%
- DSCR
- 2.34
- GRM
- 4.8
CMA / ARV
- ARV (on-the-fly)
- $173,824
- Comps found
- 11
Show comp detail 11 sales within ~0.75 mi
| Address | Dist | Beds/Ba | Sqft | Sold | Price | $/sf | Match |
|---|---|---|---|---|---|---|---|
| 23 W Cayuga St | 0.17mi | 3/2.0 | 1,860 (+4%) | 4mo | $177,319 | $95 | 82 |
| 52 Central St | 0.26mi | 3/2.0 | 1,832 (+2%) | 3mo | $85,000 | $46 | 82 |
| 50 Grove St | 0.45mi | 3/2.0 | 1,824 (+2%) | 0mo | $183,000 | $100 | 76 |
| 32 Grove St | 0.34mi | 3/2.0 | 1,766 (-2%) | 16mo | $198,650 | $112 | 68 |
| 1888 State Route 38a | 0.50mi | 3/2.0 | 1,863 (+4%) | 5mo | $255,000 | $137 | 66 |
| 16 School St | 0.51mi | 3/1.5 | 1,716 (-4%) | 10mo | $95,000 | $55 | 59 |
| 4 Congress St | 0.47mi | 3/1.5 | 1,764 (-2%) | 19mo | $130,000 | $74 | 58 |
| 48 Central St | 0.24mi | 2/1.5 (-1) | 1,546 (-14%) | 4mo | $150,000 | $97 | 56 |
| 11 Park St | 0.55mi | 3/1.0 | 1,638 (-9%) | 17mo | $68,203 | $42 | 42 |
| 224 N Main St | 0.23mi | 4/2.0 (+1) | 1,530 (-15%) | 23mo | $158,500 | $104 | 40 |
| 44 Church St | 0.50mi | 3/1.5 | 1,566 (-13%) | 21mo | $217,300 | $139 | 36 |
Match score weights: distance 35% · size 25% · config 20% · recency 20%. Top-matched comps best support the ARV.
Projected returns pro-forma
10.0% appreciation · 3.0% rent growth · sell at horizon
- IRR
- 39.7%
- Equity multiple
- 4.04×
- Total profit
- $119,147
- Equity at exit
- $126,123
- IRR
- 34.2%
- Equity multiple
- 9.10×
- Total profit
- $317,698
- Equity at exit
- $271,989
Cash invested: $39,200 (down + closing). Projections, not guarantees.
Landlord ↔ Tenant lean methodology
- Overall (STATE)
- 15 Strongly Tenant-Friendly
- State New York
- 15 Strongly Tenant-Friendly · D+10
- County
- — inherits STATE
- City
- — inherits STATE
ZIP-level market 13118
- Home prices YoY
- 29.3%
- Active inventory
- 28
- Price-to-rent
- 4.8×
Monthly cashflow live
- Estimated rent
- $2,418 medium interval (Pro) →
- Mortgage (P&I)
- −$734
- Tax from tax record
- −$134 /mo · $1,602/yr
- Insurance
- −$58
- Flood insurance flood zone
- −$314 /mo · $3,765/yr
- HOA
- −$0
- Vacancy / Maint / Mgmt
- −$508
- Net cashflow
- $670
Break-even live
UW: 25.0% down · 7.5% · 30yr · 1.5% tax · 5.0% vac · 8.0% maint · 8.0% mgmt
Financing live
Cash to close
- Down payment
- $35,000
- Closing costs
- $4,200
- Reserves months
- —
- Total cash needed
- —
Loan-product check · same deal, 3 products live
Conventional
25% down · 7.5% · 30yr
- Down + closing
- —
- Monthly P&I
- —
- Monthly cashflow
- —
- DSCR
- —
- Eligible?
- —
Personal DTI + credit; lowest rate.
DSCR
20% down · 8.5% · 30yr
- Down + closing
- —
- Monthly P&I
- —
- Monthly cashflow
- —
- DSCR
- —
- Eligible?
- —
No personal income docs; deal must DSCR.
Hard money
10% down · 12.0% · 12mo
- Down + closing
- —
- Monthly P&I
- —
- Monthly cashflow
- —
- DSCR
- —
- Eligible?
- —
Short-term bridge; refi at stabilization.
Listing history 18 events
-
2026-06-19days on market $140,000 Active 31 DOM
-
2026-06-18days on market $140,000 Active 30 DOM
-
2026-06-17days on market $140,000 Active 29 DOM
-
2026-06-16days on market $140,000 Active 28 DOM
-
2026-06-15days on market $140,000 Active 27 DOM
-
2026-06-14days on market $140,000 Active 25 DOM
-
2026-06-12days on market $140,000 Active 24 DOM
-
2026-06-09days on market $140,000 Active 21 DOM
-
2026-06-08days on market $140,000 Active 20 DOM
-
2026-06-07days on market $140,000 Active 19 DOM
-
2026-06-05days on market $140,000 Active 16 DOM
-
2026-06-02days on market $140,000 Active 14 DOM
-
2026-06-01days on market $140,000 Active 13 DOM
-
2026-05-31days on market $140,000 Active 12 DOM
-
2026-05-30days on market $140,000 Active 11 DOM
-
2026-05-19$140,000 Active
-
1991-10-31soldstatus $54,900
-
1990-10-11soldstatus $47,000
ⓘ Source: listings_history table (triggers on properties + properties_extension) + one-shot
backfill from property_details.listing_events for pre-trigger history.
Tax reassessment forecast NY · Partial reset (capped growth)
- Current annual tax
- $1,602 · $134/mo
- Projected year-2 tax
- $1,984 · $165/mo
- Expected delta
- +$382/yr (+$32/mo · 23.8%)
ⓘ Screening estimate from a state-policy table — verify with the county assessor before closing.
Climate risk First Street
- Flood 1/10 Low FEMA zone A · 0% chance over 30 yrs
- Wildfire 1/10 Low
- Heat 3/10 Moderate 8 d/yr ≥92°F today · 18 d/yr by 30 yrs out
- Wind 1/10 Low 0% chance of damaging wind over 30 yrs
- Air quality 2/10 Low 0 unhealthy d/yr today · 1 by 30 yrs out
Nearby sold comps map
Loading sold comps map…
Walkable amenities ~0.75 mi
Loading nearby amenities…
Taxation est. · year 1
- Rental income
- $29,015
- − Mortgage interest
- −$7,842
- − Property taxes
- −$1,602
- − Insurance
- −$4,465
- − Repairs & maintenance
- −$2,321
- − Management
- −$2,321
- − Depreciation
- −$4,073
- Taxable income
- $6,390
- Est. tax owed @ 24.0%
- −$1,534
- After-tax cash flow
- $6,511/yr
For passive investors: Depreciation is non-cash, so a rental often shows a tax loss while cash-flowing — sheltering income. Rental losses are passive: they offset passive income freely, and up to $25,000/yr can offset ordinary (W-2) income if you actively participate and your MAGI is under $100k (phasing out to $0 by $150k); unused losses carry forward. On sale, claimed depreciation is recaptured at up to 25%, and gains may owe capital-gains tax (a 1031 exchange can defer both). Figures are a year-1 estimate at your 24.0% rate — not tax advice; consult a CPA.
Schools (NCES district)
- District
- Moravia Central School District
- NCES district ID
- 3619800
- Math proficiency
- 42% ▼ -2.00%
- Reading proficiency
- 56% ▲ 9.00%
- Median HH income
- $55,991
- Composite
- 42.47/100
- National rank
- #3215
- State rank
- #391 of 590 in NY
Livability — Moravia
- Score
- 72/100
- State rank
- #357
- US rank
- #6025
Category grades
Schools grade is shown separately in the Schools card above.
Census & demographics
- Census place
- Moravia, NY
- Population (ZIP)
- 5,514
Population outlook (Cayuga County) Hauer SSP2
- Today (2025)
- 74,820 people
- By 2030
- 72,402 · -3.2%
- By 2040
- 66,917 · -10.6%
- By 2050
- 61,007 · -18.5%
- By 2075
- 48,047 · -35.8%
- By 2100
- 34,512 · -53.9%
Race, ethnicity, and origin ACS 2023
- Neighborhood character
- Predominantly White (87%)
- Race & ethnicity
- White 87% Black 6% Two or more races 4% Hispanic / Latino 3%
- Common ancestry
- Romanian 3% Iranian 3% Lithuanian 2%
- Foreign-born
- 1%
- Languages at home
- 98% English-only · Spanish 1%
Political lean MEDSL · Cayuga
- 2024 margin
- R (+13.0) · D 43.5% · R 56.5%
- 2008→2024 swing
- -21.5pp toward R · 2008: 8.5pp · 2024: -13.0pp
- All cycles
- 2024: R+13.0 2020: R+9.2 2016: R+13.2 2012: D+10.8 2008: D+8.5
Not yet ingested
- Civics
- —
Market trends
- HPI YoY
- ▲ 82.97%
- Current HPI
- 366.5746
- Rent YoY
- —
- Metro
- —
- State GDP YoY
- ▲ 2.60%
- F500 in state
- 92
Industry mix (Fortune 500 HQ in NY)
| Industry | F500 HQs | Revenue |
|---|---|---|
| Financial Services | 10 | $950B |
|
||
| Consumer Goods | 9 | $162B |
|
||
| Insurance | 4 | $225B |
|
||
| Telecommunications | 2 | $144B |
|
||
| Pharmaceuticals | 2 | $112B |
|
||
| Media / Entertainment | 2 | $69B |
|
||
Price history
+197.9% since first listed3 events — show timeline
- 2026-05-19 Listed $140,000 WNYREIS
- 1991-10-31 Sold (Public Records) $54,900 Public Records
- 1990-10-11 Sold (Public Records) $47,000 Public Records
Property tax history
+5.2%/yrLatest (2025): $1,602 · +5.7% YoY. Source: county tax records.
Cash-flow waterfall
monthlySold comps — $/sqft
last 12 mo · ≤1 miLoading sold comps…