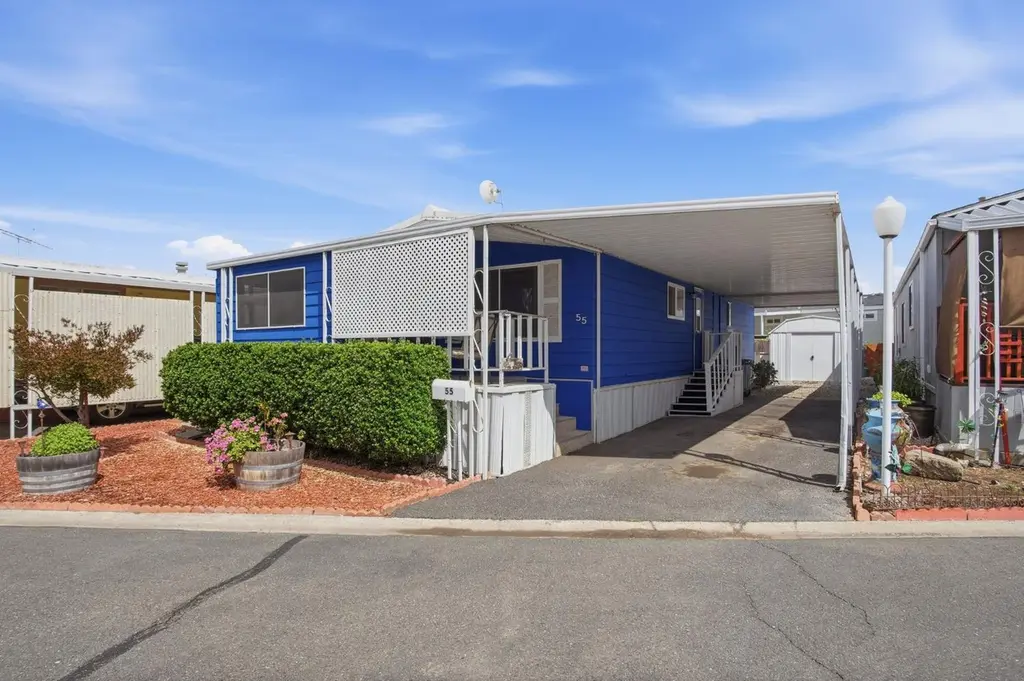
1400 Meredith Ave #55 · Gustine, CA
Flood risk 1/10 · Minimal
- FEMA flood zone
- X (unshaded)
- Chance of flooding over 30 yrs
- 0.0%
- Est. flood insurance / yr
- $507 – $1,088
Fire risk 6/10 · Moderate
- Est. fire insurance / yr
- $659 – $1,223
Heat risk 6/10 · Moderate
- Hot days now (above 105°F)
- 7 days/yr
- Hot days in 30 yrs
- 16 days/yr
Wind risk 1/10 · Minimal
- Chance of severe wind over 30 yrs
- —
Air-quality risk 9/10 · Severe
- Unhealthy air days now
- 20 days/yr
- Unhealthy air days in 30 yrs
- 21 days/yr
Risk factors via First Street. Map © Google.
Why this score? — see what drove the B grade
The composite is a weighted blend of 9 inputs, each scored 0–100. Each bar is that input's sub-score; the figure is the points it added to the 100-point composite (weight × sub-score).
- Cash flow +30.0/30.0
- ARV discount +10.8/15.0
- 1% rule +10.0/10.0
- DSCR +10.0/10.0
- Livability +3.4/5.0
- Rent growth +2.5/5.0
- Condition / age +2.5/5.0
- Schools +2.4/10.0
- Appreciation +0.0/10.0
$55,000
🖨 Deal sheet 📄 Offer letter ✓ Due diligence
Listing remarks
Located in Gustine's Green Acres Senior Community, this charming 2 bedroom, 2 bath home offers comfort and thoughtful updates throughout. Built in 1980 with 880 sqft, it features nice size bedrooms including a main suite with a walk in closet. Recent upgrades include interior paint, exterior paint, water heater replaced in 2024, and a roof resealed in 2024 with a protective coating. Updated dual pane windows add efficiency, while the spacious backyard provides room to relax or garden. A well cared for home in a welcoming community ready for its next owner.
Key facts
- Exterior paint
- Recent upgrades
- Main suite
Tags
Property features AI
Finance
- Other: Located at 1400 Meredith Ave #55, Gustine, CA 95322
- Financial info: Land lease: No (listed land lease amount present)
- HOA & community: No homeowners association; Senior community
Exterior
- Parking: Covered parking
- Utilities: Cable available; Individual electric meter; Individual gas meter; Natural gas connected; Public water; Public sewer
- Home design: Manufactured home (double wide) in a park; Built in 1980; Skyl ine make
- Construction: Aluminum skirting
- Exterior features: Backyard; Front yard; Tar/gravel roof
Interior
- Kitchen: Laminate counters
- Bedrooms: 2 bedrooms
- Flooring: Carpet; Linoleum
- Bathrooms: 2 full bathrooms; Tub and separate shower stall(s)
- Heating & cooling: Central heating; Ceiling fans; Wall units; Window units
- Interior features: Cathedral/vaulted living room; Pets allowed
- Laundry & utility: Laundry inside; 220V outlet in laundry area
Neighborhood map
What this means for you Summary
Snapshot
- This is a 2-bed/2.0-bath manufactured listed at $55k.
Deal economics
- At list price, monthly cash flow is $824 ($10k/yr) — positive.
- The deal already cash-flows at list — no discount required.
- Meets the 1% rule at list price ($2k rent vs $55k).
Location & tenants
- Location reads 67/100 on livability (#321 in CA) — a middle-class / working-renter tenant base. Strengths: health & safety A+, housing A, crime B+; Watch: employment D, schools D-, amenities F.
- Gustine Unified (rural): math 17% / reading 32% proficiency, ranked #1,180 of 1,400 in CA (top 84%) — low school quality limits family demand, transient renter base, plan for 1-2y turnover; 72% free/reduced lunch — lower-income household profile, screen leases tightly.
- Market conditions: 30 active listings in the ZIP; 7 comparable units currently listed for rent nearby; rentals leasing fast (median 12d on market — plan ~1-2 weeks tenant-placement turnaround); 459 units permitted in Merced County in 2024 (0 in 5+ unit buildings).
Forward outlook
- Local home prices are declining (-3.0%/yr); year-one equity from $380 of loan paydown is wiped out by about $2k of value loss. Plan a longer hold.
- Merced County population projected at +12% by 2050 — modest demand growth; plan on rents tracking national, not racing it.
- At projected returns (-3.0% appreciation + 3.0% rent growth), your $15k cash investment doubles in ~2 years — after that, you're playing with house money.
Negotiation context
- Only 10 days on market — expect competitive offers; lowballing is unlikely to land.
Risks & watch-outs
- Climate carrying-cost: major wildfire risk; extreme-heat days projected 7→16/yr by 2055 (HVAC capex compounding) — expect insurance premiums to compound above CPI over the hold.
Questions for the listing agent
- Is there a deadline driving the sale (1031 exchange, divorce, estate, relocation)? That informs how much negotiation room exists.
- Schools are D-rated, which usually means shorter tenancies and higher turnover. Who's the typical renter profile here, and what's been the actual vacancy rate?
- What's the average days-on-market for RENTAL listings here right now (not sales)? A rising rental-DOM trend means longer vacancies and softer asking-rent achievability than the comps imply.
- What's the recent tenant-quality profile in this submarket — average credit score on applications, eviction rate, late-payment / NSF rate, and stable-employment percentage? A property-management company in the area should have these aggregated.
- How much new for-sale + rental construction is in the pipeline within 1–3 miles? Heavy new supply typically softens prices + rents 12–24 months out; constrained supply supports both.
Investment metrics
- 1% rule
- 2.77% ✓
- Cap rate
- 24.27%
- Cash-on-cash
- 64.21%
- DSCR
- 3.86
- GRM
- 3.0
CMA / ARV
- ARV (median comp)
- $59,333
- List price
- $55,000
- Delta
- -7.30%
- Verdict
- FAIR
- Comps
- 19 within 1.0 mi
Show comp detail 5 sales within ~0.75 mi
| Address | Dist | Beds/Ba | Sqft | Sold | Price | $/sf | Match |
|---|---|---|---|---|---|---|---|
| 1400 Meredith Ave #95 | 0.05mi | 2/2.0 | 960 (+9%) | 1mo | $47,000 | $49 | 81 |
| 1400 Meredith Ave #3 | 0.05mi | 2/1.0 | 945 (+7%) | 6mo | $55,000 | $58 | 76 |
| 1400 Meredith Ave #50 | 0.05mi | 2/2.0 | 960 (+9%) | 9mo | $60,000 | $63 | 75 |
| 1400 Meredith Ave #58 | 0.05mi | 2/2.0 | 1,000 (+14%) | 3mo | $38,000 | $38 | 73 |
| 1400 Meredith Ave #98 | 0.05mi | 1/1.0 (-1) | 791 (-10%) | 9mo | $46,000 | $58 | 65 |
Match score weights: distance 35% · size 25% · config 20% · recency 20%. Top-matched comps best support the ARV.
Projected returns pro-forma
-3.0% appreciation · 3.0% rent growth · sell at horizon
- IRR
- 63.3%
- Equity multiple
- 3.83×
- Total profit
- $43,594
- Equity at exit
- $8,201
- IRR
- 67.8%
- Equity multiple
- 7.86×
- Total profit
- $105,635
- Equity at exit
- $4,755
Cash invested: $15,400 (down + closing). Projections, not guarantees.
Landlord ↔ Tenant lean methodology
- Overall (STATE)
- 18 Strongly Tenant-Friendly
- State California
- 18 Strongly Tenant-Friendly · D+13
- County
- — inherits STATE
- City
- — inherits STATE
ZIP-level market 95322
- Home prices YoY
- -31.1%
- Active inventory
- 30
- Price-to-rent
- 3.0×
Monthly cashflow live
- Estimated rent
- $1,524 high interval (Pro) →
- Mortgage (P&I)
- −$288
- Tax est. 1.5%
- −$69 /mo · $825/yr
- Insurance
- −$23
- HOA
- −$0
- Vacancy / Maint / Mgmt
- −$320
- Net cashflow
- $824
Break-even live
UW: 25.0% down · 7.5% · 30yr · 1.5% tax · 5.0% vac · 8.0% maint · 8.0% mgmt
Financing live
Cash to close
- Down payment
- $13,750
- Closing costs
- $1,650
- Reserves months
- —
- Total cash needed
- —
Loan-product check · same deal, 3 products live
Conventional
25% down · 7.5% · 30yr
- Down + closing
- —
- Monthly P&I
- —
- Monthly cashflow
- —
- DSCR
- —
- Eligible?
- —
Personal DTI + credit; lowest rate.
DSCR
20% down · 8.5% · 30yr
- Down + closing
- —
- Monthly P&I
- —
- Monthly cashflow
- —
- DSCR
- —
- Eligible?
- —
No personal income docs; deal must DSCR.
Hard money
10% down · 12.0% · 12mo
- Down + closing
- —
- Monthly P&I
- —
- Monthly cashflow
- —
- DSCR
- —
- Eligible?
- —
Short-term bridge; refi at stabilization.
Rent comps 7 comps
| Address | Beds | Baths | Sqft | Rent | $/sqft | DOM | Units | Dist |
|---|---|---|---|---|---|---|---|---|
| 790 Sycamore Ave Gustine, CA | 2.0 | 1.0 | 1089 | $1,750 | $1.61 | 7d | 1 | 0.35mi |
| 1310 Olson Dr Apt E Gustine, CA | 2.0 | 1.0 | 800 | $1,300 | $1.62 | 12d | 1 | 0.36mi |
| 1407 South Ave Unit 1407 Gustine, CA | 2.0 | 1.0 | 800 | $1,300 | $1.62 | 12d | 1 | 0.36mi |
| 1535 South Ave Apt B Gustine, CA | 2.0 | 1.5 | 900 | $1,200 | $1.33 | 12d | 1 | 0.40mi |
| 775 Odilia Ct Gustine, CA | 2.0 | 2.0 | 970 | $1,850 | $1.91 | 12d | 1 | 0.43mi |
| 407 6th St Gustine, CA | 2.0 | 2.0 | 950 | $1,900 | $2.00 | 14d | 1 | 0.67mi |
| 212 2nd St Gustine, CA | 3.0 | 2.0 | 1109 | $1,800 | $1.62 | 2d | 1 | 1.04mi |
Listing history 10 events
-
2026-06-18days on market $55,000 Active 10 DOM
-
2026-06-17days on market $55,000 Active 9 DOM
-
2026-06-16days on market $55,000 Active 8 DOM
-
2026-06-15days on market $55,000 Active 7 DOM
-
2026-06-13days on market $55,000 Active 5 DOM
-
2026-06-13days on market $55,000 Active 4 DOM
-
2026-06-08days on market $55,000 Active 1 DOM
-
2026-06-02days on market $55,000 Active 39 DOM
-
2026-06-01days on market $55,000 Active 38 DOM
-
2026-05-31days on market $55,000 Active 37 DOM
ⓘ Source: listings_history table (triggers on properties + properties_extension) + one-shot
backfill from property_details.listing_events for pre-trigger history.
Climate risk First Street
- Flood 1/10 Low FEMA zone X (unshaded) · 0% chance over 30 yrs
- Wildfire 6/10 Major
- Heat 6/10 Major 7 d/yr ≥105°F today · 16 d/yr by 30 yrs out
- Wind 1/10 Low
- Air quality 9/10 Extreme 20 unhealthy d/yr today · 21 by 30 yrs out
Nearby sold comps map
Loading sold comps map…
Walkable amenities ~0.75 mi
Loading nearby amenities…
Taxation est. · year 1
- Rental income
- $18,291
- − Mortgage interest
- −$3,081
- − Property taxes
- −$825
- − Insurance
- −$275
- − Repairs & maintenance
- −$1,463
- − Management
- −$1,463
- − Depreciation
- −$1,600
- Taxable income
- $9,583
- Est. tax owed @ 24.0%
- −$2,300
- After-tax cash flow
- $7,588/yr
For passive investors: Depreciation is non-cash, so a rental often shows a tax loss while cash-flowing — sheltering income. Rental losses are passive: they offset passive income freely, and up to $25,000/yr can offset ordinary (W-2) income if you actively participate and your MAGI is under $100k (phasing out to $0 by $150k); unused losses carry forward. On sale, claimed depreciation is recaptured at up to 25%, and gains may owe capital-gains tax (a 1031 exchange can defer both). Figures are a year-1 estimate at your 24.0% rate — not tax advice; consult a CPA.
Schools (NCES district)
- District
- Gustine Unified
- NCES district ID
- 0616323
- Math proficiency
- 17% ▬ 0.00%
- Reading proficiency
- 32% ▲ 3.00%
- Median HH income
- $42,825
- Composite
- 23.99/100
- National rank
- #13180
- State rank
- #1180 of 1400 in CA
Livability — Gustine
- Score
- 67/100
- State rank
- #321
- US rank
- #10803
Category grades
Schools grade is shown separately in the Schools card above.
Census & demographics
- Census place
- Gustine, CA
- Population (ZIP)
- 9,013
Population outlook (Merced County) Hauer SSP2
- Today (2025)
- 285,501 people
- By 2030
- 293,437 · +2.8%
- By 2040
- 308,808 · +8.2%
- By 2050
- 321,011 · +12.4%
- By 2075
- 338,497 · +18.6%
- By 2100
- 330,493 · +15.8%
Race, ethnicity, and origin ACS 2023
- Neighborhood character
- Predominantly Hispanic (67%)
- Race & ethnicity
- Hispanic / Latino 67% White 30% Two or more races 10% Native American 3% Asian 2%
- Hispanic origin (detail)
- Mexican 65%
- Common ancestry
- Russian 14% Lithuanian 4% Italian 3%
- Foreign-born
- 34% · Canada
- Languages at home
- 41% English-only · Spanish 51% Other Indo-European 6% Tagalog/Filipino 1%
Political lean MEDSL · Merced
- 2024 margin
- Toss-up / Even · D 46.5% · R 50.9% · Other 2.6%
- 2008→2024 swing
- -12.7pp toward R · 2008: 8.3pp · 2024: -4.4pp
- All cycles
- 2024: R+4.4 2020: D+10.6 2016: D+7.9 2012: D+5.4 2008: D+8.3
Not yet ingested
- Civics
- —
Market trends
- HPI YoY
- ▼ -119.43%
- Current HPI
- 264.2504
- Rent YoY
- —
- Metro
- —
- State GDP YoY
- ▲ 3.21%
- F500 in state
- 116
Industry mix (Fortune 500 HQ in CA)
| Industry | F500 HQs | Revenue |
|---|---|---|
| Technology | 27 | $1,492B |
|
||
| Financial Services | 3 | $174B |
|
||
| Retail | 3 | $44B |
|
||
| Insurance | 3 | $26B |
|
||
| Media / Entertainment | 2 | $115B |
|
||
| Pharmaceuticals / Biotech | 2 | $62B |
|
||
Cash-flow waterfall
monthlySold comps — $/sqft
last 12 mo · ≤1 miLoading sold comps…