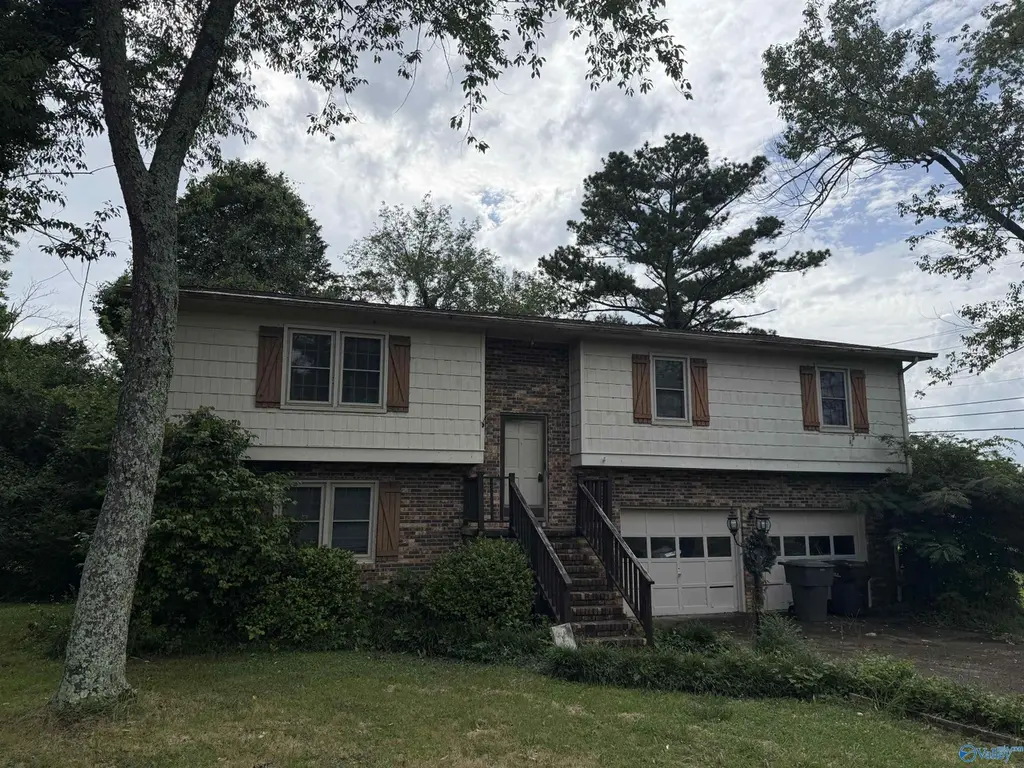
18 Sherwood Dr · Scottsboro, AL
Flood risk 1/10 · Minimal
- FEMA flood zone
- X (unshaded)
- Chance of flooding over 30 yrs
- 0.0%
- Est. flood insurance / yr
- $473 – $860
Fire risk 3/10 · Minor
- Est. fire insurance / yr
- $916 – $1,700
Heat risk 6/10 · Moderate
- Hot days now (above 104°F)
- 7 days/yr
- Hot days in 30 yrs
- 20 days/yr
Wind risk 4/10 · Minor
- Chance of severe wind over 30 yrs
- 18.0%
Air-quality risk 1/10 · Minimal
- Unhealthy air days now
- 0 days/yr
- Unhealthy air days in 30 yrs
- 0 days/yr
Risk factors via First Street. Map © Google.
Why this score? — see what drove the C- grade
The composite is a weighted blend of 9 inputs, each scored 0–100. Each bar is that input's sub-score; the figure is the points it added to the 100-point composite (weight × sub-score).
- Cash flow +20.8/30.0
- ARV discount +7.5/15.0
- DSCR +6.6/10.0
- 1% rule +4.3/10.0
- Livability +3.7/5.0
- Schools +3.4/10.0
- Rent growth +2.5/5.0
- Condition / age +2.5/5.0
- Appreciation +0.0/10.0
$169,900
🖨 Deal sheet (PDF) 📄 Offer letter ✓ Due diligence
Listing remarks
4 Bedrooms, 1.3/4 BA, 2 Car Garage, Living-room, dining, kitchen, Downstairs Den. Rear Deck, with Art Studio/Cottage/Storage off deck. Corner of Clemons Road and Sherwood Drive.
Key facts
- Art studio
- Rear deck
- 0.85 acre lot
Tags
Property features AI
Finance
- HOA & community: No homeowners association; Subdivision: Pine Hill
Exterior
- Parking: Two-car garage
- Utilities: Public water
- Home design: Single-family residence; Residential property; Built in 1986; Living area approximately 1,700 square feet; Split-level/multi-level
- Construction: Stucco exterior; Slab foundation
- Exterior features: Public water; Lot roughly 132 x 281
Interior
- Bedrooms: Total rooms: 8
- Bathrooms: One full bathroom; One three-quarter bathroom
- Heating & cooling: Central heating; Central cooling
- Interior features: Multi/split level layout; No fireplace
Neighborhood map
What this means for you Summary
Snapshot
- This is a 4-bed/1.0-bath single-family listed at $170k.
Deal economics
- At list price, monthly cash flow is $235 ($3k/yr) — positive.
- The deal already cash-flows at list — no discount required.
- To meet the 1% rule (rent ≥ 1% of price), the offer needs to be $158k (7.0% below list).
- Recommended offer: $158k (7.0% below list) — sets the bar for 1% rule.
- Cap rate 7.9% vs local median 3.3% in Scottsboro — top-decile yield for the area; either an underpriced asset or a hidden risk that comps aren't pricing in. Stress-test before assuming the spread holds.
Location & tenants
- Location reads 74/100 on livability (#21 in AL, #4,752 nationally) — a middle-class / working-renter tenant base. Strengths: cost of living A+, health & safety A+, housing B+; Watch: employment D+, amenities D-, commute F.
- Scottsboro City (town): math 27% / reading 54% proficiency, ranked #27 of 129 in AL (top 21%) — families likely to look elsewhere, expect single-tenant / working-renter base with shorter leases.
- Zoned schools: Scottsboro Junior High School (math 22% / reading 60%, grade F, #54 of 257 statewide, top 21%, 379 students, 56% FRL); Scottsboro High School (math 27% / reading 32%, grade F, #70 of 305 statewide, top 27%, 739 students, 50% FRL).
- Market conditions: 174 active listings in the ZIP; 46 units permitted in Jackson County in 2024 (0 in 5+ unit buildings).
Forward outlook
- Local home prices are declining (-3.0%/yr); year-one equity from $1k of loan paydown is wiped out by about $5k of value loss. Plan a longer hold.
- Jackson County population projected at -17% by 2050 — secular population decline; favor cash flow + early exit over multi-decade hold.
Negotiation context
- Only 11 days on market — expect competitive offers; lowballing is unlikely to land.
Risks & watch-outs
- Climate carrying-cost: extreme-heat days projected 7→20/yr by 2055 (HVAC capex compounding) — expect insurance premiums to compound above CPI over the hold.
Questions for the listing agent
- Is there a deadline driving the sale (1031 exchange, divorce, estate, relocation)? That informs how much negotiation room exists.
- What's the average days-on-market for RENTAL listings here right now (not sales)? A rising rental-DOM trend means longer vacancies and softer asking-rent achievability than the comps imply.
- What's the recent tenant-quality profile in this submarket — average credit score on applications, eviction rate, late-payment / NSF rate, and stable-employment percentage? A property-management company in the area should have these aggregated.
- How much new for-sale + rental construction is in the pipeline within 1–3 miles? Heavy new supply typically softens prices + rents 12–24 months out; constrained supply supports both.
Investment metrics
- 1% rule
- 0.93% ✗
- Cap rate
- 7.95%
- Cash-on-cash
- 5.92%
- DSCR
- 1.26
- GRM
- 9.0
CMA / ARV
No comps found within radius.
Projected returns pro-forma
-3.0% appreciation · 3.0% rent growth · sell at horizon
- IRR
- -7.2%
- Equity multiple
- 0.73×
- Total profit
- $-12,670
- Equity at exit
- $25,333
- IRR
- 2.3%
- Equity multiple
- 1.17×
- Total profit
- $7,896
- Equity at exit
- $14,690
Cash invested: $47,572 (down + closing). Projections, not guarantees.
Landlord ↔ Tenant lean methodology
- Overall (STATE)
- 90 Strongly Landlord-Friendly
- State Alabama
- 90 Strongly Landlord-Friendly · R+15
- County
- — inherits STATE
- City
- — inherits STATE
ZIP-level market 35769
- Home prices YoY
- -28.3%
- Active inventory
- 174
- Price-to-rent
- 9.0×
Monthly cashflow live
- Estimated rent
- $1,580 medium interval (Pro) →
- Mortgage (P&I)
- −$891
- Tax from tax record
- −$52 /mo · $624/yr
- Insurance
- −$71
- HOA
- −$0
- Vacancy / Maint / Mgmt
- −$332
- Net cashflow
- $235
Break-even live
Sensitivity live
| Price | -10% $331 | -5% $283 | +0% $235 | +5% $186 | +10% $138 |
|---|---|---|---|---|---|
| Rent | -10% $110 | -5% $172 | +0% $235 | +5% $297 | +10% $359 |
| Rate | -1.0pp $320 | -0.5pp $278 | base $235 | +0.5pp $190 | +1.0pp $146 |
UW: 25.0% down · 7.5% · 30yr · 1.5% tax · 5.0% vac · 8.0% maint · 8.0% mgmt
Financing live
Cash to close
- Down payment
- $42,475
- Closing costs
- $5,097
- Reserves months
- —
- Total cash needed
- —
Loan-product check · same deal, 3 products live
Conventional
25% down · 7.5% · 30yr
- Down + closing
- —
- Monthly P&I
- —
- Monthly cashflow
- —
- DSCR
- —
- Eligible?
- —
Personal DTI + credit; lowest rate.
DSCR
20% down · 8.5% · 30yr
- Down + closing
- —
- Monthly P&I
- —
- Monthly cashflow
- —
- DSCR
- —
- Eligible?
- —
No personal income docs; deal must DSCR.
Hard money
10% down · 12.0% · 12mo
- Down + closing
- —
- Monthly P&I
- —
- Monthly cashflow
- —
- DSCR
- —
- Eligible?
- —
Short-term bridge; refi at stabilization.
Listing history 9 events
-
2026-06-21days on market $169,900 Active 11 DOM
-
2026-06-19days on market $169,900 Active 9 DOM
-
2026-06-18days on market $169,900 Active 8 DOM
-
2026-06-17days on market $169,900 Active 7 DOM
-
2026-06-16days on market $169,900 Active 6 DOM
-
2026-06-15days on market $169,900 Active 5 DOM
-
2026-06-14days on market $169,900 Active 3 DOM
-
2026-06-12remarks 177-char remark
-
2026-06-12$169,900 Active 2 DOM
ⓘ Source: listings_history table (triggers on properties + properties_extension) + one-shot
backfill from property_details.listing_events for pre-trigger history.
Tax reassessment forecast AL · Resets to sale price
- Current annual tax
- $624 · $52/mo
- Projected year-2 tax
- $697 · $58/mo
- Expected delta
- +$73/yr (+$6/mo · 11.7%)
ⓘ Screening estimate from a state-policy table — verify with the county assessor before closing.
Climate risk First Street
- Flood 1/10 Low FEMA zone X (unshaded) · 0% chance over 30 yrs
- Wildfire 3/10 Moderate
- Heat 6/10 Major 7 d/yr ≥104°F today · 20 d/yr by 30 yrs out
- Wind 4/10 Moderate 18% chance of damaging wind over 30 yrs
- Air quality 1/10 Low 0 unhealthy d/yr today · 0 by 30 yrs out
Nearby sold comps map
Loading sold comps map…
Walkable amenities ~0.75 mi
Loading nearby amenities…
Taxation est. · year 1
- Rental income
- $18,961
- − Mortgage interest
- −$9,517
- − Property taxes
- −$624
- − Insurance
- −$850
- − Repairs & maintenance
- −$1,517
- − Management
- −$1,517
- − Depreciation
- −$4,943
- Taxable loss
- −$6
- Est. tax savings @ 24.0%
- +$1
- After-tax cash flow
- $2,815/yr
For passive investors: Depreciation is non-cash, so a rental often shows a tax loss while cash-flowing — sheltering income. Rental losses are passive: they offset passive income freely, and up to $25,000/yr can offset ordinary (W-2) income if you actively participate and your MAGI is under $100k (phasing out to $0 by $150k); unused losses carry forward. On sale, claimed depreciation is recaptured at up to 25%, and gains may owe capital-gains tax (a 1031 exchange can defer both). Figures are a year-1 estimate at your 24.0% rate — not tax advice; consult a CPA.
Schools (NCES district)
- District
- Scottsboro City
- NCES district ID
- 0102940
- Math proficiency
- 27% ▼ -26.00%
- Reading proficiency
- 54% ▼ -3.00%
- Median HH income
- $38,210
- Composite
- 33.67/100
- National rank
- #5388
- State rank
- #27 of 129 in AL
Livability — Scottsboro
- Score
- 74/100
- State rank
- #21
- US rank
- #4752
Category grades
Schools grade is shown separately in the Schools card above.
Census & demographics
- Census place
- Scottsboro, AL
- Population (ZIP)
- 9,571
Population outlook (Jackson County) Hauer SSP2
- Today (2025)
- 50,261 people
- By 2030
- 48,655 · -3.2%
- By 2040
- 45,119 · -10.2%
- By 2050
- 41,518 · -17.4%
- By 2075
- 33,507 · -33.3%
- By 2100
- 26,385 · -47.5%
Race, ethnicity, and origin ACS 2023
- Neighborhood character
- Predominantly White (87%)
- Race & ethnicity
- White 87% Black 6% Hispanic / Latino 5% Two or more races 2%
- Common ancestry
- Lithuanian 2% Italian 1% Slovak 1%
- Foreign-born
- 2% · Canada
- Languages at home
- 97% English-only · Spanish 3%
Political lean MEDSL · Jackson
- 2024 margin
- Solid R (+71.4) · D 13.9% · R 85.4%
- 2008→2024 swing
- -34.5pp toward R · 2008: -36.9pp · 2024: -71.4pp
- All cycles
- 2024: R+71.4 2020: R+67.5 2016: R+62.5 2012: R+41.9 2008: R+36.9
Not yet ingested
- Civics
- —
Market trends
- HPI YoY
- ▼ -80.16%
- Current HPI
- 202.7299
- Rent YoY
- —
- Metro
- —
- State GDP YoY
- ▲ 2.94%
- F500 in state
- 4
Industry mix (Fortune 500 HQ in AL)
| Industry | F500 HQs | Revenue |
|---|---|---|
| Financial Services | 1 | $8B |
|
||
| Healthcare | 1 | $5B |
|
||
Price history
1 event — show timeline
- 2026-06-10 Listed $169,900 VMLS
Property tax history
+2.8%/yrLatest (2025): $624 · +7.2% YoY. Source: county tax records.
Cash-flow waterfall
monthlySold comps — $/sqft
last 12 mo · ≤1 miLoading sold comps…