 Duplex
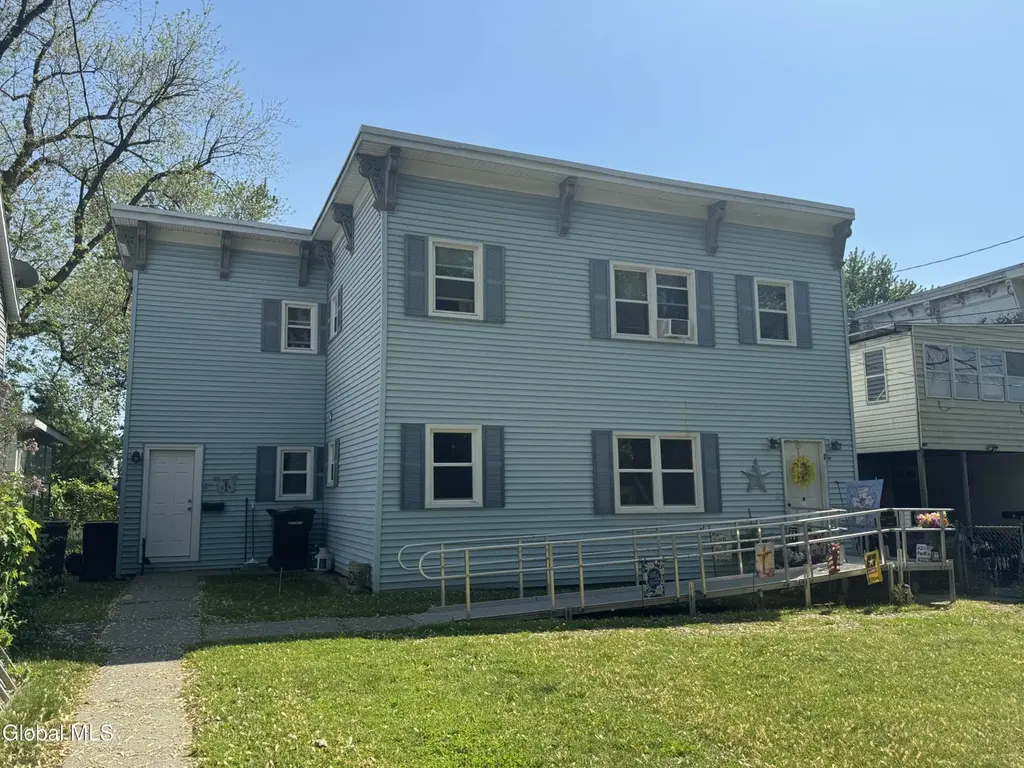
2 Mcloughlin Ln · Troy, NY
Flood risk 7/10 · Major
- FEMA flood zone
- X
- Chance of flooding over 30 yrs
- 0.88%
- Est. flood insurance / yr
- $473 – $860
Fire risk 2/10 · Minimal
- Est. fire insurance / yr
- $691 – $1,283
Heat risk 4/10 · Minor
- Hot days now (above 98°F)
- 7 days/yr
- Hot days in 30 yrs
- 17 days/yr
Wind risk 3/10 · Minor
- Chance of severe wind over 30 yrs
- 7.0%
Air-quality risk 2/10 · Minimal
- Unhealthy air days now
- 0 days/yr
- Unhealthy air days in 30 yrs
- 1 days/yr
Risk factors via First Street. Map © Google.
Why this score? — see what drove the D+ grade
The composite is a weighted blend of 9 inputs, each scored 0–100. Each bar is that input's sub-score; the figure is the points it added to the 100-point composite (weight × sub-score).
- Cash flow +18.9/30.0
- 1% rule +8.0/10.0
- DSCR +5.9/10.0
- Livability +4.0/5.0
- Rent growth +3.7/5.0
- Schools +2.8/10.0
- Condition / age +2.5/5.0
- ARV discount +0.0/15.0
- Appreciation +0.0/10.0
$244,900
🖨 Deal sheet 📄 Offer letter ✓ Due diligence
Multi-family units
County records classify this as Multi-Family (2-4 Unit). Listing-text estimate: 2 units. confirmed
Listing remarks
Spacious 2-family tucked away on a quiet lane. Each unit offers 3 bedrooms, full bath, spacious living room, and a kitchen with dining area. The first-floor unit has been completely renovated. Second-floor unit is occupied by a long-term tenant currently paying below market rent. Strong potential for increased cash flow at market rents, making this a great investment or owner-occupant opportunity. Access to property via recorded easement.
Key facts
- 4,356 sq ft lot
- 4 parking spots
- Built 1946
Property features AI
Finance
- Financial info: For this duplex, tenants pay internet and electricity
Exterior
- Parking: Four parking spaces total; Off-street paved driveway
- Utilities: Public water; Public sewer; 100 amp electric service; Cable available
- Home design: Duplex; Two dwelling units
- Construction: Vinyl siding exterior; Block and brick/mortar foundation
- Exterior features: Flat roof; Property has access to the Hudson River; Lot approximately 0.1 acre
Interior
- Kitchen: Each unit includes its own kitchen
- Bedrooms: Unit 1: 3 bedrooms (all on the 1st floor); Unit 2: 3 bedrooms (all on the 2nd floor)
- Flooring: Tile; Laminate
- Bathrooms: Two full bathrooms total (one full bath on the 1st floor, one full bath on the 2nd floor); Each unit has one full bathroom
- Heating & cooling: Hot water baseboard heating; Natural gas heating
- Interior features: ENERGY STAR qualified windows; Tile and laminate flooring; Full unfinished basement
- Laundry & utility: Washer and electric dryer hookups on main and upper levels
Neighborhood map
What this means for you Summary
Snapshot
- This is a 2 × 3-bed/1.0-bath units multifamily listed at $245k.
Deal economics
- At list price, monthly cash flow is $195 ($2k/yr) — positive. Per door: $97/mo.
- The deal already cash-flows at list — no discount required.
- Meets the 1% rule at list price ($3k rent vs $245k).
- Recommended offer: $241k (1.5% below list) — sets the bar for market timing.
- Cap rate 7.5% vs local median 5.3% in Troy — top-decile yield for the area; either an underpriced asset or a hidden risk that comps aren't pricing in. Stress-test before assuming the spread holds.
Location & tenants
- Location reads 81/100 on livability (#88 in NY, #1,350 nationally) — a professional / high-income tenant draw. Strengths: amenities A+, commute A+, housing A+; Watch: schools C-, employment C-, crime F.
- Lansingburgh Central School District (urban): math 31% / reading 35% proficiency, ranked #566 of 590 in NY (top 96%) — families likely to look elsewhere, expect single-tenant / working-renter base with shorter leases.
- Market conditions: Rents rising fast (+4.9%/yr); 220 active listings in the ZIP; solid renter incomes; 405 units permitted in Rensselaer County in 2024 (224 in 5+ unit buildings).
- At $3,182/mo this rent would consume 50% of the median local household income ($76k/yr) (locally 2698% of renters already pay >50% of income on rent) — very limited rent-growth headroom before tenants either downsize or default.
Forward outlook
- Local home prices are declining (-3.0%/yr); year-one equity from $2k of loan paydown is wiped out by about $7k of value loss. Plan a longer hold.
- Rensselaer County population projected to shrink 6% by 2050 — rents likely to lag national; underwrite the cash flow, not the appreciation.
Negotiation context
- It's been on market 30 days — a 2% lower offer ($241k) is reasonable based on typical stale-listing flexibility.
- Current owner paid $120k; list at $245k implies a 104% gain — meaningful room to come down on a strong offer.
Risks & watch-outs
- Watch-outs: property tax is 4.3% of price; flood insurance adds $56/mo; built in 1946 — expect roof / HVAC / electrical / plumbing capex.
- Climate carrying-cost: major flood risk — expect insurance premiums to compound above CPI over the hold.
Questions for the listing agent
- Can we see the unit-by-unit rent roll, current vacancy, and any below-market leases? What's the average tenancy length?
- What capital expenditures (roof, boiler, parking lot, exteriors) have been made in the last 5 years, and what's planned in the next 2?
- Built in 1946 — when were the roof, HVAC, electrical panel, plumbing, and water heater last replaced?
- Property tax is high relative to price — has the assessment been appealed recently, and will the sale trigger a re-assessment?
- What's the actual annual flood-insurance premium (NFIP or private), and is the property in a SFHA with mandatory coverage?
- Is there a deadline driving the sale (1031 exchange, divorce, estate, relocation)? That informs how much negotiation room exists.
- Crime grade is F in this area — have there been break-ins, vandalism, or insurance claims at this property in the last 3 years? What carrier currently insures it and at what premium?
- The area grade is low — what's the realistic commute time and amenity access for the typical tenant pool here? Any planned neighborhood developments (good or bad) we should know about?
- What's the average days-on-market for RENTAL listings here right now (not sales)? A rising rental-DOM trend means longer vacancies and softer asking-rent achievability than the comps imply.
- What's the recent tenant-quality profile in this submarket — average credit score on applications, eviction rate, late-payment / NSF rate, and stable-employment percentage? A property-management company in the area should have these aggregated.
- How much new apartment / multifamily construction is in the pipeline within 1–3 miles? Heavy new supply (>2% of stock underway) typically softens rents 12–24 months out; light construction supports rent growth.
Investment metrics
- 1% rule
- 1.30% ✓
- Cap rate
- 7.52%
- Cash-on-cash
- 4.38%
- DSCR
- 1.19
- GRM
- 6.4
CMA / ARV
- ARV (on-the-fly)
- $209,760
- Comps found
- 12
Show comp detail 12 sales within ~0.75 mi
| Address | Dist | Beds/Ba | Sqft | Sold | Price | $/sf | Match |
|---|---|---|---|---|---|---|---|
| 48 5th Ave | 0.12mi | 6/2.0 | 2,238 (-2%) | 2mo | $236,500 | $106 | 90 |
| 137 2nd Ave | 0.24mi | 6/2.0 | 2,396 (+5%) | 3mo | $220,000 | $92 | 78 |
| 57 5th Ave | 0.09mi | 7/2.0 (+1) | 2,418 (+6%) | 4mo | $240,000 | $99 | 77 |
| 23 Glen Ave | 0.25mi | 5/2.0 (-1) | 2,200 (-4%) | 1mo | $95,000 | $43 | 76 |
| 70 6th Ave | 0.18mi | 6/2.5 | 2,104 (-8%) | 0mo | $179,900 | $86 | 76 |
| 145 6th Ave | 0.28mi | 6/2.0 | 2,154 (-6%) | 2mo | $210,000 | $97 | 76 |
| 79 6th Ave | 0.17mi | 6/2.0 | 2,048 (-10%) | 2mo | $80,000 | $39 | 73 |
| 172 6th Ave | 0.36mi | 6/2.0 | 2,454 (+8%) | 1mo | $220,000 | $90 | 70 |
| 3161 6th Ave | 0.32mi | 6/2.0 | 2,100 (-8%) | 6mo | $130,000 | $62 | 66 |
| 83 2nd Ave | 0.11mi | 6/3.0 | 2,608 (+14%) | 2mo | $375,000 | $144 | 65 |
| 288 5th Ave | 0.65mi | 6/2.0 | 2,216 (-3%) | 4mo | $140,000 | $63 | 62 |
| 6 W Sunnyside Way | 0.54mi | 5/3.0 (-1) | 1,980 (-13%) | 4mo | $242,000 | $122 | 41 |
Match score weights: distance 35% · size 25% · config 20% · recency 20%. Top-matched comps best support the ARV.
Projected returns pro-forma
-3.0% appreciation · 4.88% rent growth · sell at horizon
- IRR
- -8.0%
- Equity multiple
- 0.70×
- Total profit
- $-20,707
- Equity at exit
- $36,515
- IRR
- 4.6%
- Equity multiple
- 1.38×
- Total profit
- $25,858
- Equity at exit
- $21,174
Cash invested: $68,572 (down + closing). Projections, not guarantees.
Landlord ↔ Tenant lean methodology
- Overall (STATE)
- 15 Strongly Tenant-Friendly
- State New York
- 15 Strongly Tenant-Friendly · D+10
- County
- — inherits STATE
- City
- — inherits STATE
ZIP-level market 12180
- Home prices YoY
- -33.3%
- Rents YoY
- 4.9%
- Active inventory
- 220
- Price-to-rent
- 12.8×
Monthly cashflow live
- Estimated rent
- $3,182 high interval (Pro) →
- Mortgage (P&I)
- −$1,284
- Tax from tax record
- −$877 /mo · $10,524/yr
- Insurance
- −$102
- Flood insurance flood zone
- −$56 /mo · $666/yr
- HOA
- −$0
- Vacancy / Maint / Mgmt
- −$668
- Net cashflow
- $195
Break-even live
2-unit breakdown (identical units grouped — click to expand)
| Units | Beds | Baths | Est. rent |
|---|---|---|---|
| 2× units | 3 | 1 | $3,182 |
| #1 | 3 | 1 | $1,591 |
| #2 | 3 | 1 | $1,591 |
| Total (2 units) | $3,182 | ||
UW: 25.0% down · 7.5% · 30yr · 1.5% tax · 5.0% vac · 8.0% maint · 8.0% mgmt
Financing live
Cash to close
- Down payment
- $61,225
- Closing costs
- $7,347
- Reserves months
- —
- Total cash needed
- —
Loan-product check · same deal, 3 products live
Conventional
25% down · 7.5% · 30yr
- Down + closing
- —
- Monthly P&I
- —
- Monthly cashflow
- —
- DSCR
- —
- Eligible?
- —
Personal DTI + credit; lowest rate.
DSCR
20% down · 8.5% · 30yr
- Down + closing
- —
- Monthly P&I
- —
- Monthly cashflow
- —
- DSCR
- —
- Eligible?
- —
No personal income docs; deal must DSCR.
Hard money
10% down · 12.0% · 12mo
- Down + closing
- —
- Monthly P&I
- —
- Monthly cashflow
- —
- DSCR
- —
- Eligible?
- —
Short-term bridge; refi at stabilization.
Listing history 20 events
-
2026-06-18days on market $244,900 Active 30 DOM
-
2026-06-17days on market $244,900 Active 29 DOM
-
2026-06-16days on market $244,900 Active 28 DOM
-
2026-06-15days on market $244,900 Active 27 DOM
-
2026-06-14remarks 442-char remark
-
2026-06-14days on market $244,900 Active 25 DOM
-
2026-06-10pricedays on market $244,900 Active 22 DOM
-
2026-06-09days on market $254,900 Active 21 DOM
-
2026-06-08days on market $254,900 Active 20 DOM
-
2026-06-07days on market $254,900 Active 19 DOM
-
2026-06-05days on market $254,900 Active 16 DOM
-
2026-06-03days on market $254,900 Active 15 DOM
-
2026-06-03price $254,900 Active 14 DOM
-
2026-06-02days on market $264,900 Active 14 DOM
-
2026-06-01days on market $264,900 Active 13 DOM
-
2026-05-31days on market $264,900 Active 12 DOM
-
2026-05-31days on market $264,900 Active 11 DOM
-
2026-05-19$264,900 Active
-
2024-02-26soldstatus $120,000
-
2022-01-11soldstatus $98,000
ⓘ Source: listings_history table (triggers on properties + properties_extension) + one-shot
backfill from property_details.listing_events for pre-trigger history.
Tax reassessment forecast NY · Partial reset (capped growth)
- Current annual tax
- $10,524 · $877/mo
- Projected year-2 tax
- $10,524 · $877/mo
- Expected delta
- $0/yr ($0/mo · 0.0%)
ⓘ Screening estimate from a state-policy table — verify with the county assessor before closing.
Climate risk First Street
- Flood 7/10 Severe FEMA zone X · 88% chance over 30 yrs
- Wildfire 2/10 Low
- Heat 4/10 Moderate 7 d/yr ≥98°F today · 17 d/yr by 30 yrs out
- Wind 3/10 Moderate 7% chance of damaging wind over 30 yrs
- Air quality 2/10 Low 0 unhealthy d/yr today · 1 by 30 yrs out
Nearby sold comps map
Loading sold comps map…
Walkable amenities ~0.75 mi
Loading nearby amenities…
Taxation est. · year 1
- Rental income
- $38,184
- − Mortgage interest
- −$13,718
- − Property taxes
- −$10,524
- − Insurance
- −$1,891
- − Repairs & maintenance
- −$3,055
- − Management
- −$3,055
- − Depreciation
- −$7,124
- Taxable loss
- −$1,183
- Est. tax savings @ 24.0%
- +$284
- After-tax cash flow
- $2,623/yr
For passive investors: Depreciation is non-cash, so a rental often shows a tax loss while cash-flowing — sheltering income. Rental losses are passive: they offset passive income freely, and up to $25,000/yr can offset ordinary (W-2) income if you actively participate and your MAGI is under $100k (phasing out to $0 by $150k); unused losses carry forward. On sale, claimed depreciation is recaptured at up to 25%, and gains may owe capital-gains tax (a 1031 exchange can defer both). Figures are a year-1 estimate at your 24.0% rate — not tax advice; consult a CPA.
Schools (NCES district)
- District
- Lansingburgh Central School District
- NCES district ID
- 3616740
- Math proficiency
- 31% ▼ -7.00%
- Reading proficiency
- 35% ▼ -6.00%
- Median HH income
- $44,807
- Composite
- 28.19/100
- National rank
- #6810
- State rank
- #566 of 590 in NY
Livability — Troy
- Score
- 81/100
- State rank
- #88
- US rank
- #1350
Category grades
Schools grade is shown separately in the Schools card above.
Census & demographics
- Census place
- Troy, NY
- County
- Rensselaer County · 75,590 people
- City population
- 53,479
- Metro
- Albany-Schenectady-Troy, NY
- Population (ZIP)
- 53,479
- Household income
- $75,851
- Rent vs Own
- Severe rent burden
- 2698.0
Population outlook (Rensselaer County) Hauer SSP2
- Today (2025)
- 162,400 people
- By 2030
- 161,746 · -0.4%
- By 2040
- 158,095 · -2.7%
- By 2050
- 152,966 · -5.8%
- By 2075
- 140,767 · -13.3%
- By 2100
- 124,727 · -23.2%
Race, ethnicity, and origin ACS 2023
- Neighborhood character
- Predominantly White (70%)
- Race & ethnicity
- White 70% Black 12% Hispanic / Latino 8% Two or more races 8% Asian 5%
- Hispanic origin (detail)
- Mexican 1% Puerto Rican 4%
- Common ancestry
- Romanian 5% Lithuanian 5% Slovak 1%
- Foreign-born
- 10% · Canada, China
- Languages at home
- 88% English-only · Spanish 4% Other Indo-European 2% Arabic 2%
Political lean MEDSL · Rensselaer
- 2024 margin
- Toss-up / Even · D 50.7% · R 49.3%
- 2008→2024 swing
- -8.0pp toward R · 2008: 9.3pp · 2024: 1.4pp
- All cycles
- 2024: D+1.4 2020: D+5.6 2016: R+2.9 2012: D+11.8 2008: D+9.3
Not yet ingested
- Civics
- —
Market trends
- HPI YoY
- ▼ -142.53%
- Current HPI
- 285.0762
- Rent YoY
- ▲ 4.88%
- Metro
- Albany-Schenectady-Troy, NY
- State GDP YoY
- ▲ 2.60%
- F500 in state
- 92
Industry mix (Fortune 500 HQ in NY)
| Industry | F500 HQs | Revenue |
|---|---|---|
| Financial Services | 10 | $950B |
|
||
| Consumer Goods | 9 | $162B |
|
||
| Insurance | 4 | $225B |
|
||
| Telecommunications | 2 | $144B |
|
||
| Pharmaceuticals | 2 | $112B |
|
||
| Media / Entertainment | 2 | $69B |
|
||
Price history
+170.3% since first listed3 events — show timeline
- 2026-05-19 Listed $264,900 Global MLS
- 2024-02-26 Sold (Public Records) $120,000 Public Records
- 2022-01-11 Sold (Public Records) $98,000 Public Records
Property tax history
+29.9%/yrLatest (2025): $10,524 · +37.4% YoY. Source: county tax records.
Cash-flow waterfall
monthlySold comps — $/sqft
last 12 mo · ≤1 miLoading sold comps…