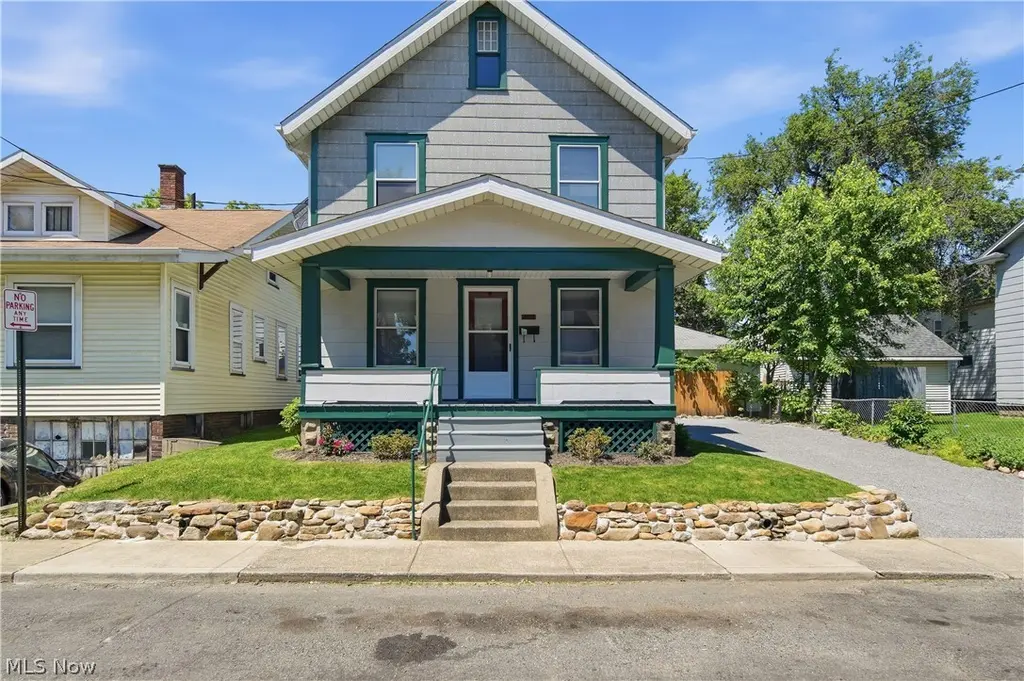
2613 Crown Pl NW · Canton, OH
Flood risk 1/10 · Minimal
- FEMA flood zone
- X (unshaded)
- Chance of flooding over 30 yrs
- 0.0%
- Est. flood insurance / yr
- $473 – $860
Fire risk 1/10 · Minimal
- Est. fire insurance / yr
- $713 – $1,323
Heat risk 3/10 · Minor
- Hot days now (above 96°F)
- 7 days/yr
- Hot days in 30 yrs
- 17 days/yr
Wind risk 1/10 · Minimal
- Chance of severe wind over 30 yrs
- —
Air-quality risk 2/10 · Minimal
- Unhealthy air days now
- 0 days/yr
- Unhealthy air days in 30 yrs
- 1 days/yr
Risk factors via First Street. Map © Google.
Why this score? — see what drove the D+ grade
The composite is a weighted blend of 9 inputs, each scored 0–100. Each bar is that input's sub-score; the figure is the points it added to the 100-point composite (weight × sub-score).
- Cash flow +15.1/30.0
- ARV discount +9.9/15.0
- DSCR +4.6/10.0
- Rent growth +4.2/5.0
- Livability +3.6/5.0
- 1% rule +3.5/10.0
- Condition / age +2.5/5.0
- Schools +1.7/10.0
- Appreciation +0.0/10.0
$119,900
🖨 Deal sheet 📄 Offer letter ✓ Due diligence
Listing remarks
This home has Craftsman character and modern updates. The interior offers a neutral and clean, move-in ready living space with quality finishes throughout. Approx. 1242 +/- sq ft with 3 bedrooms and 1 bathroom. Comfortable and inviting, this home provides the opportunity to settle in and make it your own from day one. Conveniently located near major highways, shopping, dining, and medical facilities, offering easy access to everyday amenities. A charming home with updated features and timeless appeal.
Key facts
- Modern updates
- Quality finishes
- Conveniently located
Tags
Property features AI
Finance
- Financial info: Annual tax amount reported
Exterior
- Parking: Driveway
- Utilities: Public water; Public sewer
- Home design: 2-story house; Above-grade finished area approximately 1,242
- Construction: Built (year per public records); Shingle siding construction; Asphalt roof
- Exterior features: Asphalt roof; Shingle siding
Interior
- Bedrooms: Total of 7 rooms (includes bedrooms and living spaces)
- Bathrooms: 1 full bathroom
- Heating & cooling: Central air conditioning; Forced air heating (gas)
- Interior features: Full unfinished basement
Neighborhood map
What this means for you Summary
Snapshot
- This is a 3-bed/1.0-bath single-family listed at $120k.
Deal economics
- At list price, monthly cash flow is $40 ($480/yr) — positive.
- The deal already cash-flows at list — no discount required.
- To meet the 1% rule (rent ≥ 1% of price), the offer needs to be $102k (14.9% below list).
- Recommended offer: $102k (14.9% below list) — sets the bar for 1% rule.
- Cap rate 6.7% vs local median 5.1% in Canton — top-decile yield for the area; either an underpriced asset or a hidden risk that comps aren't pricing in. Stress-test before assuming the spread holds.
Location & tenants
- Location reads 71/100 on livability (#441 in OH) — a middle-class / working-renter tenant base. Strengths: commute A+, cost of living A+, housing A; Watch: crime F, employment F.
- Canton City (urban): math 17% / reading 26% proficiency, ranked #627 of 656 in OH (top 96%) — low school quality limits family demand, transient renter base, plan for 1-2y turnover; 76% free/reduced lunch — lower-income household profile, screen leases tightly.
- Market conditions: Rents rising fast (+6.7%/yr); 119 active listings in the ZIP; 26 comparable units currently listed for rent nearby; rentals at typical pace (median 21d on market — plan ~3-4 weeks tenant-placement turnaround); 528 units permitted in Stark County in 2024 (84 in 5+ unit buildings).
Forward outlook
- Local home prices are declining (-3.0%/yr); year-one equity from $829 of loan paydown is wiped out by about $4k of value loss. Plan a longer hold.
- Stark County population projected to shrink 8% by 2050 — rents likely to lag national; underwrite the cash flow, not the appreciation.
Negotiation context
- Only 13 days on market — expect competitive offers; lowballing is unlikely to land.
- 2 sale attempts since 32y ago with the ask held roughly flat each time — persistent listings suggest the price (not the market) is what's stuck; bring a comps-based counter.
- Current owner paid $20k; list at $120k implies a 515% gain — meaningful room to come down on a strong offer.
Risks & watch-outs
- Watch-outs: built in 1916 — expect roof / HVAC / electrical / plumbing capex.
Questions for the listing agent
- Built in 1916 — when were the roof, HVAC, electrical panel, plumbing, and water heater last replaced?
- Is there a deadline driving the sale (1031 exchange, divorce, estate, relocation)? That informs how much negotiation room exists.
- Crime grade is F in this area — have there been break-ins, vandalism, or insurance claims at this property in the last 3 years? What carrier currently insures it and at what premium?
- The area grade is low — what's the realistic commute time and amenity access for the typical tenant pool here? Any planned neighborhood developments (good or bad) we should know about?
- What's the average days-on-market for RENTAL listings here right now (not sales)? A rising rental-DOM trend means longer vacancies and softer asking-rent achievability than the comps imply.
- What's the recent tenant-quality profile in this submarket — average credit score on applications, eviction rate, late-payment / NSF rate, and stable-employment percentage? A property-management company in the area should have these aggregated.
- How much new for-sale + rental construction is in the pipeline within 1–3 miles? Heavy new supply typically softens prices + rents 12–24 months out; constrained supply supports both.
Investment metrics
- 1% rule
- 0.85% ✗
- Cap rate
- 6.69%
- Cash-on-cash
- 1.43%
- DSCR
- 1.06
- GRM
- 9.8
CMA / ARV
- ARV (on-the-fly)
- $126,684
- Comps found
- 12
Show comp detail 12 sales within ~0.75 mi
| Address | Dist | Beds/Ba | Sqft | Sold | Price | $/sf | Match |
|---|---|---|---|---|---|---|---|
| 519 Columbus Ave NW | 0.10mi | 3/2.0 | 1,228 (-1%) | 2mo | $105,000 | $86 | 88 |
| 824 Smith Ave NW | 0.31mi | 3/1.0 | 1,264 (+2%) | 0mo | $126,000 | $100 | 83 |
| 354 Clarendon Ave NW | 0.11mi | 2/1.0 (-1) | 1,317 (+6%) | 0mo | $93,500 | $71 | 79 |
| 3014 2nd St NW | 0.34mi | 3/1.0 | 1,200 (-3%) | 2mo | $95,000 | $79 | 76 |
| 2322 9th St NW | 0.29mi | 3/2.0 | 1,296 (+4%) | 1mo | $75,000 | $58 | 75 |
| 3115 2nd St NW | 0.38mi | 2/1.5 (-1) | 1,160 (-7%) | 1mo | $130,000 | $112 | 64 |
| 345 Roslyn Ave NW | 0.44mi | 4/2.0 (+1) | 1,296 (+4%) | 1mo | $145,900 | $113 | 62 |
| 2227 7th St SW | 0.65mi | 3/1.0 | 1,314 (+6%) | 2mo | $55,000 | $42 | 59 |
| 644 Arlington Ave SW | 0.61mi | 3/2.0 | 1,308 (+5%) | 3mo | $132,900 | $102 | 57 |
| 131 Roslyn Ave NW | 0.55mi | 3/1.5 | 1,352 (+9%) | 3mo | $178,500 | $132 | 55 |
| 222 Montrose Ave NW | 0.65mi | 3/1.0 | 1,368 (+10%) | 1mo | $175,000 | $128 | 52 |
| 3016 9th St SW | 0.72mi | 4/1.5 (+1) | 1,296 (+4%) | 1mo | $170,000 | $131 | 51 |
Match score weights: distance 35% · size 25% · config 20% · recency 20%. Top-matched comps best support the ARV.
Projected returns pro-forma
-3.0% appreciation · 6.73% rent growth · sell at horizon
- IRR
- -10.2%
- Equity multiple
- 0.61×
- Total profit
- $-12,931
- Equity at exit
- $17,877
- IRR
- 3.4%
- Equity multiple
- 1.28×
- Total profit
- $9,538
- Equity at exit
- $10,367
Cash invested: $33,572 (down + closing). Projections, not guarantees.
Landlord ↔ Tenant lean methodology
- Overall (STATE)
- 73 Landlord-Friendly
- State Ohio
- 73 Landlord-Friendly · R+6
- County
- — inherits STATE
- City
- — inherits STATE
ZIP-level market 44708
- Rents YoY
- 6.7%
- Active inventory
- 119
- Price-to-rent
- 9.8×
Monthly cashflow live
- Estimated rent
- $1,021 high interval (Pro) →
- Mortgage (P&I)
- −$629
- Tax from tax record
- −$88 /mo · $1,052/yr
- Insurance
- −$50
- HOA
- −$0
- Vacancy / Maint / Mgmt
- −$214
- Net cashflow
- $40
Break-even live
UW: 25.0% down · 7.5% · 30yr · 1.5% tax · 5.0% vac · 8.0% maint · 8.0% mgmt
Financing live
Cash to close
- Down payment
- $29,975
- Closing costs
- $3,597
- Reserves months
- —
- Total cash needed
- —
Loan-product check · same deal, 3 products live
Conventional
25% down · 7.5% · 30yr
- Down + closing
- —
- Monthly P&I
- —
- Monthly cashflow
- —
- DSCR
- —
- Eligible?
- —
Personal DTI + credit; lowest rate.
DSCR
20% down · 8.5% · 30yr
- Down + closing
- —
- Monthly P&I
- —
- Monthly cashflow
- —
- DSCR
- —
- Eligible?
- —
No personal income docs; deal must DSCR.
Hard money
10% down · 12.0% · 12mo
- Down + closing
- —
- Monthly P&I
- —
- Monthly cashflow
- —
- DSCR
- —
- Eligible?
- —
Short-term bridge; refi at stabilization.
Rent comps 26 comps
| Address | Beds | Baths | Sqft | Rent | $/sqft | DOM | Units | Dist |
|---|---|---|---|---|---|---|---|---|
| 2525 6th St NW Unit NA Canton, OH | 2.0 | 1.0 | 950 | $700 | $0.74 | 43d | 1 | 0.07mi |
| 521 Columbus Ave NW Canton, OH | 2.0 | 1.0 | 900 | $775 | $0.86 | 21d | 1 | 0.10mi |
| 521 Columbus Ave NW Unit 2 Canton, OH | 2.0 | 1.0 | 900 | $875 | $0.97 | 43d | 1 | 0.10mi |
| 2510 10th St NW Canton, OH | 3.0 | 1.5 | 1468 | $1,175 | $0.80 | 21d | 1 | 0.27mi |
| 1005 Broad Ave NW Unit 201 Canton, OH | 3.0 | 1.0 | 1200 | $800 | $0.67 | 21d | 1 | 0.29mi |
| 1005 Broad Ave NW Unit 100 Canton, OH | 2.0 | 1.0 | 1200 | $850 | $0.71 | 21d | 1 | 0.29mi |
| 2237 Tuscarawas St W Canton, OH | 2.0 | 1.0 | 1035 | $700 | $0.68 | 21d | 1 | 0.38mi |
| 2237 Tuscarawas St W Unit 7 Canton, OH | 2.0 | 1.0 | 1035 | $725 | $0.70 | 43d | 1 | 0.38mi |
| 2316 2nd St SW Canton, OH | 3.0 | 1.0 | 1125 | $1,095 | $0.97 | 43d | 1 | 0.43mi |
| 202 Smith Ave SW Canton, OH | 2.0 | 1.0 | 1236 | $995 | $0.81 | 43d | 1 | 0.46mi |
| 900 Roslyn Ave SW Canton, OH | 3.0 | 1.0 | 1320 | $1,175 | $0.89 | 13d | 1 | 0.81mi |
| 1023 Harrison Ave SW Canton, OH | 3.0 | 1.0 | 1224 | $1,250 | $1.02 | 21d | 1 | 0.88mi |
| 1014 Roslyn Ave SW Canton, OH | 3.0 | 1.0 | 1128 | $1,150 | $1.02 | 21d | 1 | 0.89mi |
| 1117 Arlington Ave SW Canton, OH | 3.0 | 1.0 | 1240 | $1,200 | $0.97 | 13d | 1 | 0.91mi |
| 2901 17th St NW Canton, OH | 2.0 | 1.0 | 1000 | $885 | $0.89 | 21d | 1 | 0.95mi |
| 1241 Bedford Ave SW Canton, OH | 3.0 | 2.0 | 1152 | $1,200 | $1.04 | 13d | 1 | 1.06mi |
| 1016 2nd St NW Canton, OH | 1.0–3.0 | 1.0–2.0 | 916 | $1,050 | $1.15 | 13d | 20 | 1.11mi |
| 1100 5th St SW Canton, OH | 4.0 | 1.0 | 1397 | $1,200 | $0.86 | 43d | 1 | 1.11mi |
| 1229 Lawn Ave SW Canton, OH | 2.0 | 1.0 | 936 | $950 | $1.01 | 43d | 1 | 1.11mi |
| 1421 Piper Ct NW Canton, OH | 3.0 | 1.5 | 1311 | $995 | $0.76 | 21d | 1 | 1.15mi |
| 1216 14th St NW Canton, OH | 3.0 | 1.0 | 1352 | $1,100 | $0.81 | 21d | 1 | 1.18mi |
| 1224 15th St NW Unit 1 Canton, OH | 2.0 | 1.0 | 900 | $749 | $0.83 | 21d | 1 | 1.23mi |
| 1212 Shorb Ave NW #1 Canton, OH | 2.0 | 1.0 | 832 | $850 | $1.02 | 43d | 1 | 1.31mi |
| 1008 14th St NW Canton, OH | 3.0 | 1.5 | 1100 | $898 | $0.82 | 21d | 1 | 1.32mi |
| 1380 Garfield Ave SW Canton, OH | 2.0 | 1.0 | 1212 | $995 | $0.82 | 21d | 1 | 1.42mi |
| 1520 Bryan Ave SW Canton, OH | 3.0 | 1.0 | 1040 | $1,100 | $1.06 | 43d | 1 | 1.47mi |
Listing history 12 events
-
2026-06-17status $119,900 Pending 13 DOM
-
2026-06-17days on market $119,900 Active 13 DOM
-
2026-06-16days on market $119,900 Active 12 DOM
-
2026-06-15days on market $119,900 Active 11 DOM
-
2026-06-14days on market $119,900 Active 9 DOM
-
2026-06-13days on market $119,900 Active 8 DOM
-
2026-06-10days on market $119,900 Active 6 DOM
-
2026-06-09days on market $119,900 Active 5 DOM
-
2026-06-08days on market $119,900 Active 4 DOM
-
2026-06-07days on market $119,900 Active 3 DOM
-
2026-06-05remarks 506-char remark
-
2026-06-05$119,900 Active 1 DOM
ⓘ Source: listings_history table (triggers on properties + properties_extension) + one-shot
backfill from property_details.listing_events for pre-trigger history.
Tax reassessment forecast OH · Partial reset (capped growth)
- Current annual tax
- $1,052 · $88/mo
- Projected year-2 tax
- $1,461 · $122/mo
- Expected delta
- +$409/yr (+$34/mo · 38.9%)
ⓘ Screening estimate from a state-policy table — verify with the county assessor before closing.
Climate risk First Street
- Flood 1/10 Low FEMA zone X (unshaded) · 0% chance over 30 yrs
- Wildfire 1/10 Low
- Heat 3/10 Moderate 7 d/yr ≥96°F today · 17 d/yr by 30 yrs out
- Wind 1/10 Low
- Air quality 2/10 Low 0 unhealthy d/yr today · 1 by 30 yrs out
Nearby sold comps map
Loading sold comps map…
Walkable amenities ~0.75 mi
Loading nearby amenities…
Taxation est. · year 1
- Rental income
- $12,249
- − Mortgage interest
- −$6,716
- − Property taxes
- −$1,052
- − Insurance
- −$600
- − Repairs & maintenance
- −$980
- − Management
- −$980
- − Depreciation
- −$3,488
- Taxable loss
- −$1,567
- Est. tax savings @ 24.0%
- +$376
- After-tax cash flow
- $856/yr
For passive investors: Depreciation is non-cash, so a rental often shows a tax loss while cash-flowing — sheltering income. Rental losses are passive: they offset passive income freely, and up to $25,000/yr can offset ordinary (W-2) income if you actively participate and your MAGI is under $100k (phasing out to $0 by $150k); unused losses carry forward. On sale, claimed depreciation is recaptured at up to 25%, and gains may owe capital-gains tax (a 1031 exchange can defer both). Figures are a year-1 estimate at your 24.0% rate — not tax advice; consult a CPA.
Schools (NCES district)
- District
- Canton City
- NCES district ID
- 3904371
- Math proficiency
- 17% ▼ -17.00%
- Reading proficiency
- 26% ▼ -12.00%
- Median HH income
- $28,825
- Composite
- 17.1/100
- National rank
- #9116
- State rank
- #627 of 656 in OH
Livability — Canton
- Score
- 71/100
- State rank
- #441
- US rank
- #7259
Category grades
Schools grade is shown separately in the Schools card above.
Census & demographics
- Census place
- Canton, OH
- County
- Stark County · 272,865 people
- City population
- 103,614
- Metro
- Canton-Massillon, OH
- Population (ZIP)
- 24,285
- Household income
- $63,706
- Rent vs Own
- Severe rent burden
- 725.0
Population outlook (Stark County) Hauer SSP2
- Today (2025)
- 373,708 people
- By 2030
- 371,245 · -0.7%
- By 2040
- 361,331 · -3.3%
- By 2050
- 345,290 · -7.6%
- By 2075
- 302,669 · -19.0%
- By 2100
- 238,870 · -36.1%
Race, ethnicity, and origin ACS 2023
- Neighborhood character
- Predominantly White (80%)
- Race & ethnicity
- White 80% Black 8% Two or more races 8% Hispanic / Latino 4% Asian 3%
- Common ancestry
- Italian 8% Romanian 2% Slovak 2%
- Foreign-born
- 4% · Canada, South Korea, Vietnam
- Languages at home
- 95% English-only · Spanish 2% Other Indo-European 1% Tagalog/Filipino 1%
Political lean MEDSL · Stark
- 2024 margin
- Strong R (+21.9) · D 38.6% · R 60.5%
- 2008→2024 swing
- -27.4pp toward R · 2008: 5.5pp · 2024: -21.9pp
- All cycles
- 2024: R+21.9 2020: R+18.5 2016: R+17.4 2012: R+0.4 2008: D+5.5
Not yet ingested
- Civics
- —
Market trends
- HPI YoY
- ▼ -168.35%
- Current HPI
- 206.298
- Rent YoY
- ▲ 6.73%
- Metro
- Canton-Massillon, OH
- State GDP YoY
- ▲ 1.98%
- F500 in state
- 48
Industry mix (Fortune 500 HQ in OH)
| Industry | F500 HQs | Revenue |
|---|---|---|
| Insurance | 3 | $145B |
|
||
| Industrial Machinery | 3 | $49B |
|
||
| Financial Services | 3 | $24B |
|
||
| Consumer Goods | 2 | $93B |
|
||
| Aerospace / Defense | 2 | $47B |
|
||
| Utilities | 2 | $33B |
|
||
Price history
+514.9% since first listed3 events — show timeline
- 2026-06-04 Listed $119,900 MLSNOW
- 1994-12-15 Sold (Public Records) $19,500 Public Records
- 1994-11-17 Listed $19,500 MLSNOW
Property tax history
+2.8%/yrLatest (2024): $1,052 · +10.4% YoY. Source: county tax records.
Cash-flow waterfall
monthlySold comps — $/sqft
last 12 mo · ≤1 miLoading sold comps…