1920 S Delsea Dr #5 · Vineland, NJ
Flood risk No data
- FEMA flood zone
- —
- Chance of flooding over 30 yrs
- —
- Est. flood insurance / yr
- —
Fire risk No data
- Est. fire insurance / yr
- —
Heat risk No data
- Hot days now (above threshold)
- —
- Hot days in 30 yrs
- —
Wind risk No data
- Chance of severe wind over 30 yrs
- —
Air-quality risk No data
- Unhealthy air days now
- —
- Unhealthy air days in 30 yrs
- —
Risk factors via First Street. Map © Google.
Why this score? — see what drove the B- grade
The composite is a weighted blend of 9 inputs, each scored 0–100. Each bar is that input's sub-score; the figure is the points it added to the 100-point composite (weight × sub-score).
- Cash flow +30.0/30.0
- 1% rule +10.0/10.0
- DSCR +10.0/10.0
- ARV discount +7.5/15.0
- Livability +3.3/5.0
- Rent growth +2.5/5.0
- Condition / age +2.2/5.0
- Schools +1.9/10.0
- Appreciation +0.0/10.0
$79,000
🖨 Deal sheet (PDF) 📄 Offer letter ✓ Due diligence
Listing remarks
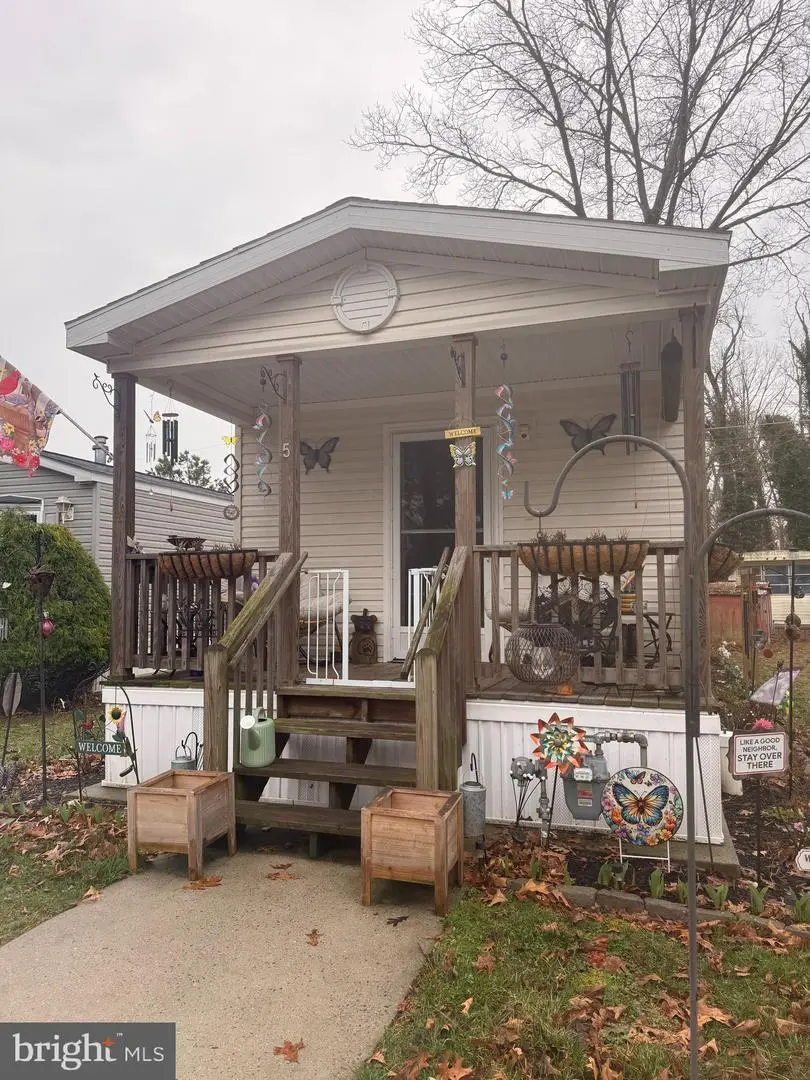
Welcome to Unit 5 in 1920 MHC located in Vineland. This 2 bedroom 1 bath unit was manufactured in 2009 and offers the perfect space for someone looking to downsize or someone who is just starting out. The kitchen has a lot of storage space and is open to the living room. The 2 bedrooms are down the hall and away from the main area of the home. Lot rent will be $756.50 and includes trash, water, sewer and snow removal. This small community is located right on the NJ Transit line for easy access to public transportation and is close to RT 55 and all amenities in Vineland. Take advantage of the opportunity to own your own home with low lot rent! New owner must be park approved. Contact office
Key facts
- Open to living room
- Storage space
- Close to amenities
Tags
Neighborhood map
What this means for you Summary
Snapshot
- This is a 2-bed/1.0-bath single-family listed at $79k. Condition is rated fair.
Deal economics
- At list price, monthly cash flow is $852 ($10k/yr) — positive.
- The deal already cash-flows at list — no discount required.
- Meets the 1% rule at list price ($2k rent vs $79k).
- Recommended offer: $78k (1.5% below list) — sets the bar for market timing.
- Cap rate 19.2% vs local median 4.5% in Vineland — top-decile yield for the area; either an underpriced asset or a hidden risk that comps aren't pricing in. Stress-test before assuming the spread holds.
Location & tenants
- Location reads 66/100 on livability (#363 in NJ) — a middle-class / working-renter tenant base. Strengths: housing A+, health & safety A+; Watch: employment D+, schools D, crime F.
- Vineland Public School District (urban): math 9% / reading 34% proficiency, ranked #418 of 472 in NJ (top 89%) — low school quality limits family demand, transient renter base, plan for 1-2y turnover.
- Market conditions: 173 active listings in the ZIP; 216 units permitted in Cumberland County in 2024 (73 in 5+ unit buildings).
- This rent runs 32% of the median local income ($65k/yr) — at the standard rent-burdened threshold; future hikes will face affordability resistance.
Forward outlook
- Local home prices are declining (-3.0%/yr); year-one equity from $546 of loan paydown is wiped out by about $2k of value loss. Plan a longer hold.
- Cumberland County population projected to shrink 7% by 2050 — rents likely to lag national; underwrite the cash flow, not the appreciation.
- At projected returns (-3.0% appreciation + 3.0% rent growth), your $22k cash investment doubles in ~3 years — after that, you're playing with house money.
Negotiation context
- It's been on market 28 days — a 2% lower offer ($78k) is reasonable based on typical stale-listing flexibility.
- 2 sale attempts since 3y ago with the ask held roughly flat each time — persistent listings suggest the price (not the market) is what's stuck; bring a comps-based counter.
- Current owner paid $61k; 30% above their basis — modest negotiation headroom, anchor on the comps not their cost.
Questions for the listing agent
- Have any recent inspections been done? Can we get a copy of the seller's disclosures and any deferred-maintenance estimates?
- Is there a deadline driving the sale (1031 exchange, divorce, estate, relocation)? That informs how much negotiation room exists.
- Schools are D-rated, which usually means shorter tenancies and higher turnover. Who's the typical renter profile here, and what's been the actual vacancy rate?
- Crime grade is F in this area — have there been break-ins, vandalism, or insurance claims at this property in the last 3 years? What carrier currently insures it and at what premium?
- What's the average days-on-market for RENTAL listings here right now (not sales)? A rising rental-DOM trend means longer vacancies and softer asking-rent achievability than the comps imply.
- What's the recent tenant-quality profile in this submarket — average credit score on applications, eviction rate, late-payment / NSF rate, and stable-employment percentage? A property-management company in the area should have these aggregated.
- How much new for-sale + rental construction is in the pipeline within 1–3 miles? Heavy new supply typically softens prices + rents 12–24 months out; constrained supply supports both.
Investment metrics
- 1% rule
- 2.24% ✓
- Cap rate
- 19.24%
- Cash-on-cash
- 46.23%
- DSCR
- 3.06
- GRM
- 3.7
CMA / ARV
- ARV (on-the-fly)
- $284,256
- Comps found
- 4
Show comp detail 4 sales within ~0.75 mi
| Address | Dist | Beds/Ba | Sqft | Sold | Price | $/sf | Match |
|---|---|---|---|---|---|---|---|
| 1920 Delsea #24 | 0.01mi | 2/1.0 | 1,128 (0%) | 19mo | $71,000 | $63 | 84 |
| 1920 S Delsea Dr #21 | 0.01mi | 2/2.0 | 1,000 (-11%) | 7mo | $89,900 | $90 | 71 |
| 668 W Elmer Rd | 0.25mi | 3/2.0 (+1) | 1,248 (+11%) | 5mo | $315,000 | $252 | 57 |
| 1961 S Orchard Rd | 0.47mi | 3/1.0 (+1) | 1,248 (+11%) | 23mo | $320,000 | $256 | 36 |
Match score weights: distance 35% · size 25% · config 20% · recency 20%. Top-matched comps best support the ARV.
Projected returns pro-forma
-3.0% appreciation · 3.0% rent growth · sell at horizon
- IRR
- 43.5%
- Equity multiple
- 2.88×
- Total profit
- $41,501
- Equity at exit
- $11,779
- IRR
- 49.5%
- Equity multiple
- 5.80×
- Total profit
- $106,136
- Equity at exit
- $6,830
Cash invested: $22,120 (down + closing). Projections, not guarantees.
Landlord ↔ Tenant lean methodology
- Overall (STATE)
- 21 Tenant-Leaning
- State New Jersey
- 21 Tenant-Leaning · D+6
- County
- — inherits STATE
- City
- — inherits STATE
ZIP-level market 08360
- Active inventory
- 173
- Price-to-rent
- 3.7×
Monthly cashflow live
- Estimated rent
- $1,770 medium interval (Pro) →
- Mortgage (P&I)
- −$414
- Tax est. 1.5%
- −$99 /mo · $1,185/yr
- Insurance
- −$33
- HOA
- −$0
- Vacancy / Maint / Mgmt
- −$372
- Net cashflow
- $852
Break-even live
Sensitivity live
| Price | -10% $907 | -5% $879 | +0% $852 | +5% $825 | +10% $798 |
|---|---|---|---|---|---|
| Rent | -10% $712 | -5% $782 | +0% $852 | +5% $922 | +10% $992 |
| Rate | -1.0pp $892 | -0.5pp $872 | base $852 | +0.5pp $832 | +1.0pp $811 |
UW: 25.0% down · 7.5% · 30yr · 1.5% tax · 5.0% vac · 8.0% maint · 8.0% mgmt
Financing live
Cash to close
- Down payment
- $19,750
- Closing costs
- $2,370
- Reserves months
- —
- Total cash needed
- —
Loan-product check · same deal, 3 products live
Conventional
25% down · 7.5% · 30yr
- Down + closing
- —
- Monthly P&I
- —
- Monthly cashflow
- —
- DSCR
- —
- Eligible?
- —
Personal DTI + credit; lowest rate.
DSCR
20% down · 8.5% · 30yr
- Down + closing
- —
- Monthly P&I
- —
- Monthly cashflow
- —
- DSCR
- —
- Eligible?
- —
No personal income docs; deal must DSCR.
Hard money
10% down · 12.0% · 12mo
- Down + closing
- —
- Monthly P&I
- —
- Monthly cashflow
- —
- DSCR
- —
- Eligible?
- —
Short-term bridge; refi at stabilization.
Listing history 6 events
-
2026-04-13status Pending
-
2026-03-16$79,000 Active
-
2023-12-11soldstatus $61,000 Closed
-
2023-11-29price $69,500
-
2023-11-20price $75,000
-
2023-09-22$79,500 Active
ⓘ Source: listings_history table (triggers on properties + properties_extension) + one-shot
backfill from property_details.listing_events for pre-trigger history.
Nearby sold comps map
Loading sold comps map…
Walkable amenities ~0.75 mi
Loading nearby amenities…
Taxation est. · year 1
- Rental income
- $21,237
- − Mortgage interest
- −$4,425
- − Property taxes
- −$1,185
- − Insurance
- −$395
- − Repairs & maintenance
- −$1,699
- − Management
- −$1,699
- − Depreciation
- −$2,298
- Taxable income
- $9,536
- Est. tax owed @ 24.0%
- −$2,289
- After-tax cash flow
- $7,938/yr
For passive investors: Depreciation is non-cash, so a rental often shows a tax loss while cash-flowing — sheltering income. Rental losses are passive: they offset passive income freely, and up to $25,000/yr can offset ordinary (W-2) income if you actively participate and your MAGI is under $100k (phasing out to $0 by $150k); unused losses carry forward. On sale, claimed depreciation is recaptured at up to 25%, and gains may owe capital-gains tax (a 1031 exchange can defer both). Figures are a year-1 estimate at your 24.0% rate — not tax advice; consult a CPA.
Condition & rehab AI · 12 photos
The home is in fair condition with some minor repairs and maintenance needed. It has a moderate level of renovation required to improve its value.
Repairs flagged
- Minor Porch railings — The wooden railings on the porch appear to be in good condition.
- Minor Porch welcome sign — The welcome sign is in good condition.
Value-add opportunities
- Resale Paint interior walls — Painting interior walls can improve the home's appearance and make it more appealing to potential buyers.
- Rental Replace shower curtain — A new shower curtain can make the bathroom more inviting and reduce the risk of mold and mildew.
Renovation cost estimate screening
| Repair item | Severity | Est. cost |
|---|---|---|
| Porch railings · The wooden railings on the porch appear to be in good condition. | Minor | $500–3,000 |
| Porch welcome sign · The welcome sign is in good condition. | Minor | $500–3,000 |
| Total estimated repair cost · 2 items | $1,000–6,000 |
Value-add ROI direction
- Resale Paint interior walls — Painting interior walls can improve the home's appearance and make it more appealing to potential buyers. ↑
- Rental Replace shower curtain — A new shower curtain can make the bathroom more inviting and reduce the risk of mold and mildew. ↑
ⓘ Cost ranges are severity-bucket heuristics (US national rule-of-thumb). Get contractor quotes + a written scope before underwriting a rehab budget.
Schools (NCES district)
- District
- Vineland Public School District
- NCES district ID
- 3416800
- Math proficiency
- 9% ▼ -17.00%
- Reading proficiency
- 34% ▬ 0.00%
- Median HH income
- $51,168
- Composite
- 19.17/100
- National rank
- #8819
- State rank
- #418 of 472 in NJ
Livability — Vineland
- Score
- 66/100
- State rank
- #363
- US rank
- #12180
Category grades
Schools grade is shown separately in the Schools card above.
Census & demographics
- Census place
- Vineland, NJ
- County
- Cumberland County · 80,266 people
- City population
- 45,038
- Metro
- Vineland-Bridgeton, NJ
- Population (ZIP)
- 45,038
- Household income
- $65,359
- Rent vs Own
- Severe rent burden
- 1328.0
Population outlook (Cumberland County) Hauer SSP2
- Today (2025)
- 152,743 people
- By 2030
- 150,373 · -1.6%
- By 2040
- 146,881 · -3.8%
- By 2050
- 142,653 · -6.6%
- By 2075
- 129,468 · -15.2%
- By 2100
- 107,456 · -29.6%
Race, ethnicity, and origin ACS 2023
- Neighborhood character
- Diverse neighborhood (Simpson 0.62)
- Race & ethnicity
- Hispanic / Latino 51% White 32% Two or more races 17% Black 11% Asian 1%
- Hispanic origin (detail)
- Mexican 11% Puerto Rican 33% Dominican 2%
- Common ancestry
- Romanian 2% Subsaharan African 1% Scotch-Irish 1%
- Foreign-born
- 14% · Canada, Jamaica
- Languages at home
- 59% English-only · Spanish 37% Russian/Polish/Slavic 2% Other Indo-European 1%
Political lean MEDSL · Cumberland
- 2024 margin
- Toss-up / Even · D 47.6% · R 51.3% · Other 1.1%
- 2008→2024 swing
- -25.4pp toward R · 2008: 21.6pp · 2024: -3.8pp
- All cycles
- 2024: R+3.8 2020: D+6.0 2016: D+5.3 2012: D+23.1 2008: D+21.6
Not yet ingested
- Civics
- —
Market trends
- HPI YoY
- ▼ -320.06%
- Current HPI
- 278.786
- Rent YoY
- —
- Metro
- Vineland-Bridgeton, NJ
- State GDP YoY
- ▲ 2.05%
- F500 in state
- 34
Industry mix (Fortune 500 HQ in NJ)
| Industry | F500 HQs | Revenue |
|---|---|---|
| Consumer Goods | 3 | $31B |
|
||
| Pharmaceuticals | 2 | $153B |
|
||
| Technology | 2 | $21B |
|
||
| Insurance | 2 | $20B |
|
||
| Healthcare | 2 | $19B |
|
||
| Financial Services | 1 | $70B |
|
||
Price history
-0.6% since first listed6 events — show timeline
- 2026-04-13 Pending — BRIGHT MLS
- 2026-03-16 Listed $79,000 BRIGHT MLS
- 2023-12-11 Sold (MLS) $61,000 BRIGHT MLS
- 2023-11-29 Price Changed $69,500 BRIGHT MLS
- 2023-11-20 Price Changed $75,000 BRIGHT MLS
- 2023-09-22 Listed $79,500 BRIGHT MLS
Cash-flow waterfall
monthlySold comps — $/sqft
last 12 mo · ≤1 miLoading sold comps…