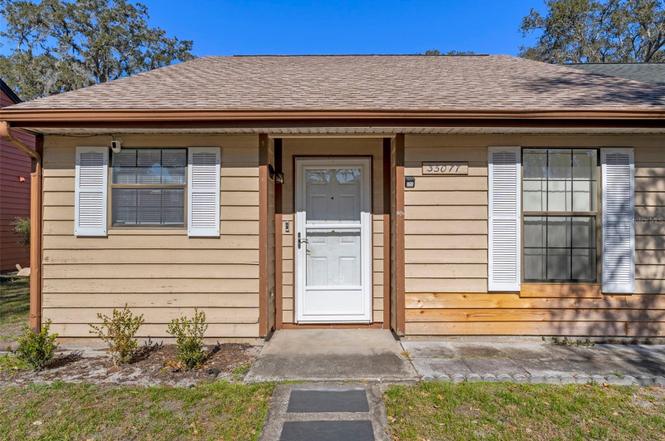
35077 Whispering Oaks Blvd · Ridge Manor, FL
Flood risk 1/10 · Minimal
- FEMA flood zone
- AE
- Chance of flooding over 30 yrs
- 0.0%
- Est. flood insurance / yr
- $1,737 – $8,500
Fire risk 5/10 · Moderate
- Est. fire insurance / yr
- $947 – $1,759
Heat risk 9/10 · Severe
- Hot days now (above 108°F)
- 7 days/yr
- Hot days in 30 yrs
- 25 days/yr
Wind risk 9/10 · Severe
- Chance of severe wind over 30 yrs
- 99.0%
Air-quality risk 1/10 · Minimal
- Unhealthy air days now
- 0 days/yr
- Unhealthy air days in 30 yrs
- 0 days/yr
Risk factors via First Street. Map © Google.
Why this score? — see what drove the B- grade
The composite is a weighted blend of 9 inputs, each scored 0–100. Each bar is that input's sub-score; the figure is the points it added to the 100-point composite (weight × sub-score).
- Cash flow +23.8/30.0
- ARV discount +10.4/15.0
- Appreciation +10.0/10.0
- DSCR +7.7/10.0
- 1% rule +5.7/10.0
- Schools +4.2/10.0
- Livability +3.2/5.0
- Rent growth +2.5/5.0
- Condition / age +2.5/5.0
$178,000
🖨 Deal sheet 📄 Offer letter ✓ Due diligence
Listing remarks
Virtually Staged. END UNIT 2/2 VILLA in Whispering Oaks Estates! This delightful "Coventry" villa offers low maintenance, an open floor plan which includes a great room with dining (you're sure to love the volume ceilings!) plus Florida room and a rear patio with scenic views of nature. NEW ROOF in November of last year. A single carport plus guest parking space are included. The former golf course behind the home has new owners who are actively preparing the property to be a "better than ever" 18 hole championship course! The handy kitchen is fully applianced. Washer and dryer hookups are available in the kitchen and in the storage room off the Florida room - your cho
Key facts
- Open floor plan
- Florida room
- Single carport
Tags
Property features AI
Finance
- Other: Homestead exemption declared; Irrigation equipment installed; Planned unit development zoning (MPUD - MF)
- Financial info: No lease restrictions indicated
- HOA & community: Has HOA; monthly fee approximately $23.08 (annual $277); Association amenities include recreational facilities, golf course access, private road maintenance; association enforces fence and vehicle restrictions; Association fee covers common area taxes, escrow reserves, private road and recreational facilities; Deed restrictions and special community restrictions apply; Golf carts allowed (per community rules); Pets allowed with number limit
Exterior
- Parking: Carport (1 space); Guest parking available
- Security: Smoke detector(s)
- Utilities: Public water; Public sewer; Broadband/high-speed internet available; Cable available; Electricity connected; Phone available; Fire hydrant nearby
- Home design: Residential villa; One story; Facing southeast; Completed condition
- Construction: Brick and frame construction; Shingle roof; Slab foundation; Built as single-story (one level)
- Exterior features: Patio; Rain gutters; Trees and landscaped yard; On golf course; Paved, private maintained road; Level lot; Flood insurance required
Interior
- Kitchen: Dishwasher; Disposal; Microwave; Range; Refrigerator; Electric water heater
- Bedrooms: 2 bedrooms
- Flooring: Laminate; Tile
- Bathrooms: 2 full bathrooms
- Heating & cooling: Central heating (electric, heat pump); Central air conditioning
- Interior features: Central vacuum; High ceilings; Living room/dining room combo; Open floorplan; Split bedroom layout; Thermostat; Vaulted ceilings; Blinds; Double-pane windows; Smoke detector(s)
- Laundry & utility: Washer hookup; Dryer hookup (electric); Laundry area inside, located in kitchen
Neighborhood map
What this means for you Summary
Snapshot
- This is a 2-bed/2.0-bath single-family listed at $178k.
Deal economics
- At list price, monthly cash flow is $-84 ($-1k/yr) — negative.
- To cash-flow at today's rent, offer at most $163k (8.4% below list).
- Meets the 1% rule at list price ($2k rent vs $178k).
- Recommended offer: $157k (12.0% below list) — sets the bar for market timing.
- Cap rate 8.6% vs local median 4.3% in Ridge Manor — top-decile yield for the area; either an underpriced asset or a hidden risk that comps aren't pricing in. Stress-test before assuming the spread holds.
Location & tenants
- Location reads 63/100 on livability (#736 in FL) — a middle-class / working-renter tenant base. Strengths: cost of living A+, housing A+, crime B+; Watch: health & safety C-, employment D, amenities F.
- Hernando (suburban): math 50% / reading 50% proficiency, ranked #38 of 73 in FL (top 52%) — acceptable for families but not a draw, mixed tenant base, ~2y average lease.
- Zoned schools: Eastside Elementary School (math 37% / reading 32%, grade F, #1,709 of 2,144 statewide, top 81%, 737 students, 73% FRL); Hernando High School (math 42% / reading 42%, grade F, #275 of 667 statewide, top 42%, 1,299 students, 58% FRL).
- Market conditions: 295 active listings in the ZIP; 1 comparable units currently listed for rent nearby; 2,505 units permitted in Hernando County in 2024 (318 in 5+ unit buildings).
Forward outlook
- In year one you build about $19k of equity ($1k loan paydown + $18k appreciation (10.0% local appreciation)).
- Hernando County population projected at +11% by 2050 — modest demand growth; plan on rents tracking national, not racing it.
- By year 2, paydown + projected appreciation supports a ~$31k cash-out refi (75% LTV) — recoverable capital for the next deal without selling this one.
Negotiation context
- It's been on market 133 days — a 12% lower offer ($157k) is reasonable based on typical stale-listing flexibility.
- 7 sale attempts since 15y ago with the ask held roughly flat each time — persistent listings suggest the price (not the market) is what's stuck; bring a comps-based counter.
- Current owner paid $152k; 17% above their basis — modest negotiation headroom, anchor on the comps not their cost.
Risks & watch-outs
- Watch-outs: flood insurance adds $427/mo.
- Climate carrying-cost: in FEMA flood zone AE (mandatory federal flood insurance); severe wind risk, 99% chance of damaging wind over 30y; moderate wildfire risk; extreme-heat days projected 7→25/yr by 2055 (HVAC capex compounding) — expect insurance premiums to compound above CPI over the hold.
Questions for the listing agent
- What do current leases actually rent for vs. the listed asking? Can we see a recent rent roll and the last 12 months of T-12 income?
- It's been on market 133 days. Have you received any prior offers? Is the seller open to a 12% concession, seller financing, or rate buy-down credit?
- What's the actual annual flood-insurance premium (NFIP or private), and is the property in a SFHA with mandatory coverage?
- What does the HOA fee cover, when was the last increase, and are there any pending special assessments or reserve-fund shortfalls?
- Why hasn't it sold? Are there any deal-killer items the seller is aware of (foundation, flood, title, zoning, code violations)?
- Is there a deadline driving the sale (1031 exchange, divorce, estate, relocation)? That informs how much negotiation room exists.
- Schools are F-rated, which usually means shorter tenancies and higher turnover. Who's the typical renter profile here, and what's been the actual vacancy rate?
- What's the average days-on-market for RENTAL listings here right now (not sales)? A rising rental-DOM trend means longer vacancies and softer asking-rent achievability than the comps imply.
- What's the recent tenant-quality profile in this submarket — average credit score on applications, eviction rate, late-payment / NSF rate, and stable-employment percentage? A property-management company in the area should have these aggregated.
- How much new for-sale + rental construction is in the pipeline within 1–3 miles? Heavy new supply typically softens prices + rents 12–24 months out; constrained supply supports both.
Investment metrics
- 1% rule
- 1.07% ✓
- Cap rate
- 8.60%
- Cash-on-cash
- 8.24%
- DSCR
- 1.37
- GRM
- 7.8
CMA / ARV
- ARV (on-the-fly)
- $190,080
- Comps found
- 1
Show comp detail 1 sale within ~0.75 mi
| Address | Dist | Beds/Ba | Sqft | Sold | Price | $/sf | Match |
|---|---|---|---|---|---|---|---|
| 6175 Beechwood Dr | 0.20mi | 2/2.0 | 990 (0%) | 8mo | $190,000 | $192 | 84 |
Match score weights: distance 35% · size 25% · config 20% · recency 20%. Top-matched comps best support the ARV.
Projected returns pro-forma
10.0% appreciation · 3.0% rent growth · sell at horizon
- IRR
- 22.9%
- Equity multiple
- 2.84×
- Total profit
- $91,818
- Equity at exit
- $160,357
- IRR
- 20.5%
- Equity multiple
- 6.52×
- Total profit
- $275,106
- Equity at exit
- $345,815
Cash invested: $49,840 (down + closing). Projections, not guarantees.
Landlord ↔ Tenant lean methodology
- Overall (STATE)
- 87 Strongly Landlord-Friendly
- State Florida
- 87 Strongly Landlord-Friendly · R+3
- County
- — inherits STATE
- City
- — inherits STATE
ZIP-level market 33523
- Home prices YoY
- 3.8%
- Active inventory
- 295
- Price-to-rent
- 7.8×
Monthly cashflow live
- Estimated rent
- $1,900 medium interval (Pro) →
- Mortgage (P&I)
- −$933
- Tax from tax record
- −$128 /mo · $1,538/yr
- Insurance
- −$74
- Flood insurance flood zone
- −$427 /mo · $5,118/yr
- HOA
- −$23
- Vacancy / Maint / Mgmt
- −$399
- Net cashflow
- $-84
Break-even live
UW: 25.0% down · 7.5% · 30yr · 1.5% tax · 5.0% vac · 8.0% maint · 8.0% mgmt
Financing live
Cash to close
- Down payment
- $44,500
- Closing costs
- $5,340
- Reserves months
- —
- Total cash needed
- —
Loan-product check · same deal, 3 products live
Conventional
25% down · 7.5% · 30yr
- Down + closing
- —
- Monthly P&I
- —
- Monthly cashflow
- —
- DSCR
- —
- Eligible?
- —
Personal DTI + credit; lowest rate.
DSCR
20% down · 8.5% · 30yr
- Down + closing
- —
- Monthly P&I
- —
- Monthly cashflow
- —
- DSCR
- —
- Eligible?
- —
No personal income docs; deal must DSCR.
Hard money
10% down · 12.0% · 12mo
- Down + closing
- —
- Monthly P&I
- —
- Monthly cashflow
- —
- DSCR
- —
- Eligible?
- —
Short-term bridge; refi at stabilization.
Rent comps 1 comps
| Address | Beds | Baths | Sqft | Rent | $/sqft | DOM | Units | Dist |
|---|---|---|---|---|---|---|---|---|
| 34807 Evergreen Way Dade City, FL | 3.0 | 1.0 | 1000 | $1,900 | $1.90 | 20d | 1 | 1.21mi |
HOA detail
- Monthly dues
- $23 · $276/yr
Listing history 50 events
-
2026-06-18days on market $178,000 Active 133 DOM
-
2026-06-17days on market $178,000 Active 132 DOM
-
2026-06-16days on market $178,000 Active 131 DOM
-
2026-06-15days on market $178,000 Active 130 DOM
-
2026-06-13days on market $178,000 Active 128 DOM
-
2026-06-13days on market $178,000 Active 127 DOM
-
2026-06-09days on market $178,000 Active 124 DOM
-
2026-06-08days on market $178,000 Active 123 DOM
-
2026-06-07days on market $178,000 Active 122 DOM
-
2026-06-04days on market $178,000 Active 119 DOM
-
2026-06-03days on market $178,000 Active 118 DOM
-
2026-06-02days on market $178,000 Active 117 DOM
-
2026-06-01days on market $178,000 Active 116 DOM
-
2026-05-31days on market $178,000 Active 115 DOM
-
2026-02-26price $178,000
-
2026-02-05$183,000 Active
-
2025-12-29historical
-
2025-11-07status Active
-
2025-11-07price $185,000
-
2025-08-25price $190,000
-
2025-08-03price $195,000
-
2025-06-12$225,000 Active
-
2025-06-05historical
-
2025-05-16price $174,500
-
2025-05-06price $175,000
-
2025-04-30price $178,500
-
2025-04-28price $181,500
-
2025-04-17price $182,500
-
2025-04-14price $184,500
-
2025-04-03price $185,480
-
2025-01-14price $188,480
-
2024-11-11price $188,500
-
2024-09-20price $188,700
-
2024-08-18price $189,700
-
2024-08-07price $198,000
-
2024-08-02price $199,985
-
2024-07-09price $205,900
-
2024-06-29price $208,900
-
2024-06-05$210,000 Active
-
2022-05-02soldstatus $152,000
-
2022-04-29soldstatus $152,000 Closed
-
2022-04-05status Pending
-
2022-03-29$145,000 Active
-
2017-03-20soldstatus $73,000
-
2017-03-16soldstatus $73,000
-
2016-10-27$75,000
-
2012-09-04soldstatus $48,500
-
2012-08-06soldstatus $48,500
-
2011-07-21$65,000
-
1984-04-01soldstatus $58,967
ⓘ Source: listings_history table (triggers on properties + properties_extension) + one-shot
backfill from property_details.listing_events for pre-trigger history.
Tax reassessment forecast FL · Resets to sale price
- Current annual tax
- $1,538 · $128/mo
- Projected year-2 tax
- $1,538 · $128/mo
- Expected delta
- $0/yr ($0/mo · 0.0%)
ⓘ Screening estimate from a state-policy table — verify with the county assessor before closing.
Climate risk First Street
- Flood 1/10 Low FEMA zone AE · 0% chance over 30 yrs
- Wildfire 5/10 Major
- Heat 9/10 Extreme 7 d/yr ≥108°F today · 25 d/yr by 30 yrs out
- Wind 9/10 Extreme 99% chance of damaging wind over 30 yrs
- Air quality 1/10 Low 0 unhealthy d/yr today · 0 by 30 yrs out
Nearby sold comps map
Loading sold comps map…
Walkable amenities ~0.75 mi
Loading nearby amenities…
Taxation est. · year 1
- Rental income
- $22,800
- − Mortgage interest
- −$9,971
- − Property taxes
- −$1,538
- − Insurance
- −$6,008
- − Repairs & maintenance
- −$1,824
- − Management
- −$1,824
- − HOA
- −$276
- − Depreciation
- −$5,178
- Taxable loss
- −$3,820
- Est. tax savings @ 24.0%
- +$917
- After-tax cash flow
- $-95/yr
For passive investors: Depreciation is non-cash, so a rental often shows a tax loss while cash-flowing — sheltering income. Rental losses are passive: they offset passive income freely, and up to $25,000/yr can offset ordinary (W-2) income if you actively participate and your MAGI is under $100k (phasing out to $0 by $150k); unused losses carry forward. On sale, claimed depreciation is recaptured at up to 25%, and gains may owe capital-gains tax (a 1031 exchange can defer both). Figures are a year-1 estimate at your 24.0% rate — not tax advice; consult a CPA.
Schools (NCES district)
- District
- Hernando
- NCES district ID
- 1200810
- Math proficiency
- 50% ▼ -8.00%
- Reading proficiency
- 50% ▼ -4.00%
- Median HH income
- $41,985
- Composite
- 42.03/100
- National rank
- #3329
- State rank
- #38 of 73 in FL
Livability — Ridge Manor
- Score
- 63/100
- State rank
- #736
- US rank
- #15912
Category grades
Schools grade is shown separately in the Schools card above.
Census & demographics
- Census place
- Ridge Manor, FL
- City population
- 21,077
- Population (ZIP)
- 19,296
Population outlook (Hernando County) Hauer SSP2
- Today (2025)
- 189,218 people
- By 2030
- 194,367 · +2.7%
- By 2040
- 203,398 · +7.5%
- By 2050
- 209,589 · +10.8%
- By 2075
- 218,452 · +15.4%
- By 2100
- 205,923 · +8.8%
Race, ethnicity, and origin ACS 2023
- Neighborhood character
- Diverse neighborhood (Simpson 0.59)
- Race & ethnicity
- White 57% Hispanic / Latino 28% Black 10% Two or more races 10% Native American 3% Asian 1%
- Hispanic origin (detail)
- Mexican 21% Puerto Rican 2% Cuban 2%
- Common ancestry
- Lithuanian 5% Slovak 1% Romanian 1%
- Foreign-born
- 13% · Canada, China, Jamaica
- Languages at home
- 75% English-only · Spanish 21% Other Indo-European 2% Chinese 1%
Political lean MEDSL · Hernando
- 2024 margin
- Solid R (+37.0) · D 31.1% · R 68.2%
- 2008→2024 swing
- -33.5pp toward R · 2008: -3.6pp · 2024: -37.0pp
- All cycles
- 2024: R+37.0 2020: R+30.2 2016: R+29.0 2012: R+8.5 2008: R+3.6
Not yet ingested
- Civics
- —
Market trends
- HPI YoY
- ▲ 16.36%
- Current HPI
- 448.7
- Rent YoY
- —
- Metro
- —
- State GDP YoY
- ▲ 3.28%
- F500 in state
- 36
Industry mix (Fortune 500 HQ in FL)
| Industry | F500 HQs | Revenue |
|---|---|---|
| Industrial Technology | 2 | $29B |
|
||
| Insurance | 2 | $17B |
|
||
| Retail | 1 | $60B |
|
||
| Technology Distribution | 1 | $58B |
|
||
| Homebuilding | 1 | $35B |
|
||
| Technology Manufacturing | 1 | $35B |
|
||
Price history
+201.9% since first listed36 events — show timeline
- 2026-02-26 Price Changed $178,000 Stellar MLS as Distributed by MLS Grid
- 2026-02-05 Listed $183,000 Stellar MLS as Distributed by MLS Grid
- 2025-12-29 Listing Removed — Stellar MLS as Distributed by MLS Grid
- 2025-11-07 Relisted — Stellar MLS as Distributed by MLS Grid
- 2025-11-07 Price Changed $185,000 Stellar MLS as Distributed by MLS Grid
- 2025-08-25 Price Changed $190,000 Stellar MLS as Distributed by MLS Grid
- 2025-08-03 Price Changed $195,000 Stellar MLS as Distributed by MLS Grid
- 2025-06-12 Listed $225,000 Stellar MLS as Distributed by MLS Grid
- 2025-06-05 Listing Removed — Stellar MLS as Distributed by MLS Grid
- 2025-05-16 Price Changed $174,500 Stellar MLS as Distributed by MLS Grid
- 2025-05-06 Price Changed $175,000 Stellar MLS as Distributed by MLS Grid
- 2025-04-30 Price Changed $178,500 Stellar MLS as Distributed by MLS Grid
- 2025-04-28 Price Changed $181,500 Stellar MLS as Distributed by MLS Grid
- 2025-04-17 Price Changed $182,500 Stellar MLS as Distributed by MLS Grid
- 2025-04-14 Price Changed $184,500 Stellar MLS as Distributed by MLS Grid
- 2025-04-03 Price Changed $185,480 Stellar MLS as Distributed by MLS Grid
- 2025-01-14 Price Changed $188,480 Stellar MLS as Distributed by MLS Grid
- 2024-11-11 Price Changed $188,500 Stellar MLS as Distributed by MLS Grid
- 2024-09-20 Price Changed $188,700 Stellar MLS as Distributed by MLS Grid
- 2024-08-18 Price Changed $189,700 Stellar MLS as Distributed by MLS Grid
- 2024-08-07 Price Changed $198,000 Stellar MLS as Distributed by MLS Grid
- 2024-08-02 Price Changed $199,985 Stellar MLS as Distributed by MLS Grid
- 2024-07-09 Price Changed $205,900 Stellar MLS as Distributed by MLS Grid
- 2024-06-29 Price Changed $208,900 Stellar MLS as Distributed by MLS Grid
- 2024-06-05 Listed $210,000 Stellar MLS as Distributed by MLS Grid
- 2022-05-02 Sold (Public Records) $152,000 Public Records
- 2022-04-29 Sold (MLS) $152,000 Stellar MLS as Distributed by MLS Grid
- 2022-04-05 Pending — Stellar MLS as Distributed by MLS Grid
- 2022-03-29 Listed $145,000 Stellar MLS as Distributed by MLS Grid
- 2017-03-20 Sold (Public Records) $73,000 Public Records
- 2017-03-16 Sold (MLS) $73,000 Stellar MLS as Distributed by MLS Grid
- 2016-10-27 Listed $75,000 Stellar MLS as Distributed by MLS Grid
- 2012-09-04 Sold (Public Records) $48,500 Public Records
- 2012-08-06 Sold (MLS) $48,500 Stellar MLS as Distributed by MLS Grid
- 2011-07-21 Listed $65,000 Stellar MLS as Distributed by MLS Grid
- 1984-04-01 Sold (Public Records) $58,967 Public Records
Property tax history
+4.2%/yrLatest (2025): $1,538 · +0.7% YoY. Source: county tax records.
Cash-flow waterfall
monthlySold comps — $/sqft
last 12 mo · ≤1 miLoading sold comps…