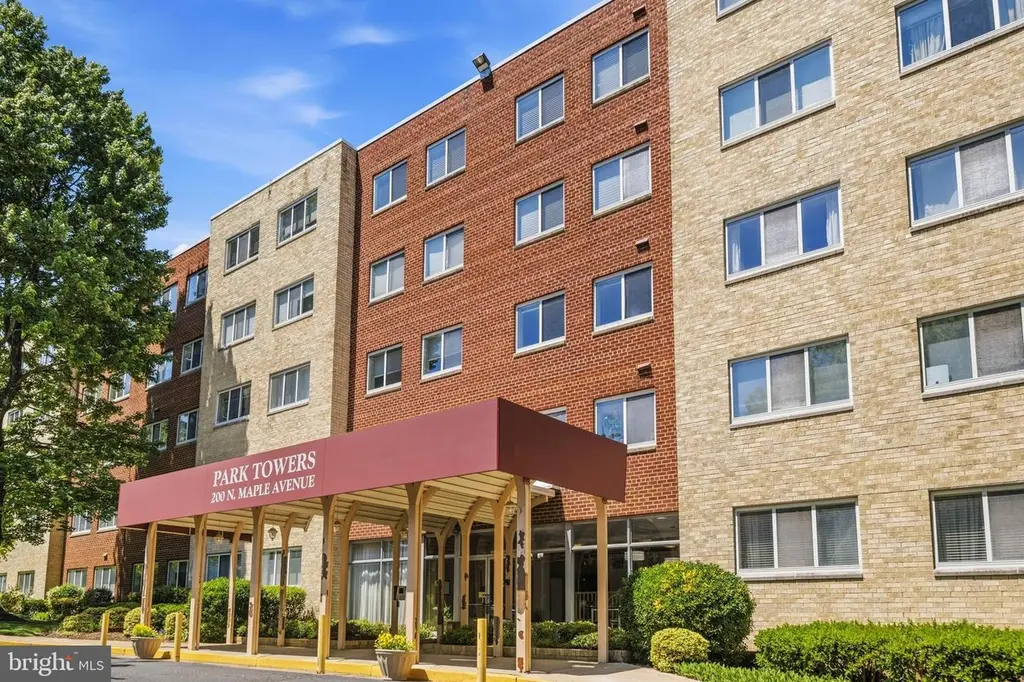
200 N Maple Ave #110 · Falls Church, VA
Flood risk 1/10 · Minimal
- FEMA flood zone
- X (unshaded)
- Chance of flooding over 30 yrs
- 0.0%
- Est. flood insurance / yr
- $507 – $1,088
Fire risk 1/10 · Minimal
- Est. fire insurance / yr
- $666 – $1,236
Heat risk 7/10 · Major
- Hot days now (above 104°F)
- 7 days/yr
- Hot days in 30 yrs
- 16 days/yr
Wind risk 4/10 · Minor
- Chance of severe wind over 30 yrs
- 16.0%
Air-quality risk 3/10 · Minor
- Unhealthy air days now
- 3 days/yr
- Unhealthy air days in 30 yrs
- 4 days/yr
Risk factors via First Street. Map © Google.
Why this score? — see what drove the D grade
The composite is a weighted blend of 9 inputs, each scored 0–100. Each bar is that input's sub-score; the figure is the points it added to the 100-point composite (weight × sub-score).
- ARV discount +15.0/15.0
- Schools +7.9/10.0
- Cash flow +5.5/30.0
- Livability +4.4/5.0
- 1% rule +3.7/10.0
- Rent growth +2.5/5.0
- Condition / age +2.5/5.0
- DSCR +0.0/10.0
- Appreciation +0.0/10.0
$259,500
🖨 Deal sheet (PDF) 📄 Offer letter ✓ Due diligence
Listing remarks MLS
Walk to East Falls Church Metro! Spacious and updated 736 sq. ft. 1 bd-1 bath condo in Falls Church City!!Walk to shops, restaurants and State Theater. This bright basement condo has its own separate entrance, plenty of parking, new carpet and new appliances. The building is well managed and all utilities are included in the low condo fee.
Key facts
- $638 HOA
- Community pool
- Built 1963
Property features AI
Finance
- HOA & community: Condo fee $638 monthly; HOA covers air conditioning, common area maintenance, custodial services, electricity, exterior building maintenance, gas, heat, management, pool(s), reserves, sewer, snow removal, trash, water, and parking fee; Association amenities include elevator and party room
Exterior
- Parking: Parking lot with permit included (unassigned)
- Utilities: Public water; Public sewer; Electric service
- Home design: Condominium unit (Unit/Flat); Mid-rise building (5–8 floors); Level entry to main level; Brick construction; Above-grade and below-grade structures
- Construction: Brick construction; Built by assessor (year built source: Assessor)
- Exterior features: Community pool; Common grounds; Extra storage
Interior
- Kitchen: Built-in microwave; Dishwasher; Disposal; Refrigerator; Freezer; Stove
- Bedrooms: One bedroom on the main level
- Flooring: Hardwood; Carpet
- Bathrooms: One full bathroom on the main level; One full bathroom total
- Heating & cooling: Central A/C (electric); Electric heating; Hot water from natural gas
- Interior features: Ceiling fan(s); Family room off kitchen; Flat layout; Entry-level bedroom; Wood floors; Carpet
- Laundry & utility: Common laundry (not in-unit)
Neighborhood map
What this means for you Summary
Snapshot
- This is a 1-bed/1.0-bath condo listed at $260k.
Deal economics
- At list price, monthly cash flow is $-556 ($-7k/yr) — negative.
- To cash-flow at today's rent, offer at most $161k (37.9% below list).
- To meet the 1% rule (rent ≥ 1% of price), the offer needs to be $226k (13.1% below list).
- Recommended offer: $161k (37.9% below list) — sets the bar for cash-flow.
- Cap rate 3.7% vs local median 1.4% in Falls Church — top-decile yield for the area; either an underpriced asset or a hidden risk that comps aren't pricing in. Stress-test before assuming the spread holds.
Location & tenants
- Location reads 87/100 on livability (#9 in VA, #254 nationally) — a professional / high-income tenant draw. Strengths: amenities A+, commute A+, employment A+; Watch: cost of living F.
- Falls Church City Public School District (suburban): math 84% / reading 89% proficiency, ranked #1 of 131 in VA (top 1%) — strong family-tenant draw, lease renewals of 3-5y typical; only 6% free/reduced lunch — higher-income household profile.
- Zoned schools: Oak Street Elementary (math 87% / reading 89%, grade A+, #30 of 1,108 statewide, top 3%, 526 students, 7% FRL); Mary Ellen Henderson Middle (math 81% / reading 88%, grade A+, #14 of 342 statewide, top 4%, 581 students, 9% FRL); Meridian High (math 84% / reading 93%, grade A, #11 of 319 statewide, top 3%, 865 students, 10% FRL) — zoned schools at 9% FRL track the district average.
- Market conditions: Rents soft (-0.2%/yr); 97 active listings in the ZIP; 19 comparable units currently listed for rent nearby; rentals leasing fast (median 1d on market — plan ~1-2 weeks tenant-placement turnaround); high-income renter base; 20 units permitted in Falls Church city in 2024 (0 in 5+ unit buildings).
- This rent is only 16% of the median local income ($169k/yr) — well below the 30% rent-burden line; pricing power to push rent on renewal without tenant pushback.
Forward outlook
- Local home prices are declining (-3.0%/yr); year-one equity from $2k of loan paydown is wiped out by about $8k of value loss. Plan a longer hold.
- Falls Church County population projected at +51% by 2050 — long-run rental-demand tailwind backs the buy-and-hold thesis.
Negotiation context
- It's been on market 32 days — a 3% lower offer ($252k) is reasonable based on typical stale-listing flexibility.
- 4 sale attempts since 24y ago; this cycle's ask has dropped $16k (6%) from the opening price — seller is motivated, your offer sets the floor, not the list.
- Current owner paid $200k; 30% above their basis — modest negotiation headroom, anchor on the comps not their cost.
Risks & watch-outs
- Watch-outs: HOA is 28% of rent.
- Climate carrying-cost: extreme-heat days projected 7→16/yr by 2055 (HVAC capex compounding) — expect insurance premiums to compound above CPI over the hold.
Questions for the listing agent
- What do current leases actually rent for vs. the listed asking? Can we see a recent rent roll and the last 12 months of T-12 income?
- It's been on market 32 days. Have you received any prior offers? Is the seller open to a 38% concession, seller financing, or rate buy-down credit?
- Built in 1963 — when were the roof, HVAC, electrical panel, plumbing, and water heater last replaced?
- What does the HOA fee cover, when was the last increase, and are there any pending special assessments or reserve-fund shortfalls?
- Any open or pending special assessments — roof, HVAC, plumbing, elevator, façade? What's the per-unit balance and payoff schedule, and is the seller paying it off at close or rolling it to the buyer?
- Is there a deadline driving the sale (1031 exchange, divorce, estate, relocation)? That informs how much negotiation room exists.
- Schools are A-rated — typically a magnet for longer-tenancy family renters. What's the average tenant stay here, and is there a school-zone premium baked into asking?
- The area grade is low — what's the realistic commute time and amenity access for the typical tenant pool here? Any planned neighborhood developments (good or bad) we should know about?
- What's the average days-on-market for RENTAL listings here right now (not sales)? A rising rental-DOM trend means longer vacancies and softer asking-rent achievability than the comps imply.
- What's the recent tenant-quality profile in this submarket — average credit score on applications, eviction rate, late-payment / NSF rate, and stable-employment percentage? A property-management company in the area should have these aggregated.
- How much new apartment / multifamily construction is in the pipeline within 1–3 miles? Heavy new supply (>2% of stock underway) typically softens rents 12–24 months out; light construction supports rent growth.
Investment metrics
- 1% rule
- 0.87% ✗
- Cap rate
- 3.72%
- Cash-on-cash
- -9.19%
- DSCR
- 0.59
- GRM
- 9.6
CMA / ARV
- ARV (median comp)
- $453,591
- List price
- $259,500
- Delta
- -42.79%
- Verdict
- UNDERPRICED
- Comps
- 20 within 1.0 mi
Projected returns pro-forma
-3.0% appreciation · 0.0% rent growth · sell at horizon
- IRR
- -37.3%
- Equity multiple
- -0.15×
- Total profit
- $-83,734
- Equity at exit
- $38,692
- IRR
- -87.1%
- Equity multiple
- -0.96×
- Total profit
- $-142,602
- Equity at exit
- $22,437
Cash invested: $72,660 (down + closing). Projections, not guarantees.
Landlord ↔ Tenant lean methodology
- Overall (STATE)
- 55 Moderately Landlord-Leaning
- State Virginia
- 55 Moderately Landlord-Leaning · D+2
- County
- — inherits STATE
- City
- — inherits STATE
ZIP-level market 22046
- Rents YoY
- -0.2%
- Active inventory
- 97
- Price-to-rent
- 9.6×
Monthly cashflow live
- Estimated rent
- $2,256 high interval (Pro) →
- Mortgage (P&I)
- −$1,361
- Tax from tax record
- −$232 /mo · $2,781/yr
- Insurance
- −$108
- HOA
- −$638
- Vacancy / Maint / Mgmt
- −$474
- Net cashflow
- $-556
Break-even live
Sensitivity live
| Price | -10% $-410 | -5% $-483 | +0% $-556 | +5% $-630 | +10% $-703 |
|---|---|---|---|---|---|
| Rent | -10% $-735 | -5% $-646 | +0% $-556 | +5% $-467 | +10% $-378 |
| Rate | -1.0pp $-426 | -0.5pp $-490 | base $-556 | +0.5pp $-624 | +1.0pp $-692 |
UW: 25.0% down · 7.5% · 30yr · 1.5% tax · 5.0% vac · 8.0% maint · 8.0% mgmt
Financing live
Cash to close
- Down payment
- $64,875
- Closing costs
- $7,785
- Reserves months
- —
- Total cash needed
- —
Loan-product check · same deal, 3 products live
Conventional
25% down · 7.5% · 30yr
- Down + closing
- —
- Monthly P&I
- —
- Monthly cashflow
- —
- DSCR
- —
- Eligible?
- —
Personal DTI + credit; lowest rate.
DSCR
20% down · 8.5% · 30yr
- Down + closing
- —
- Monthly P&I
- —
- Monthly cashflow
- —
- DSCR
- —
- Eligible?
- —
No personal income docs; deal must DSCR.
Hard money
10% down · 12.0% · 12mo
- Down + closing
- —
- Monthly P&I
- —
- Monthly cashflow
- —
- DSCR
- —
- Eligible?
- —
Short-term bridge; refi at stabilization.
Rent comps 19 comps
| Address | Beds | Baths | Sqft | Rent | $/sqft | DOM | Units | Dist |
|---|---|---|---|---|---|---|---|---|
| 301 W Broad St Falls Church, VA | 1.0–2.0 | 1.0–2.0 | 823 | $1,730 | $2.10 | 0d | 20 | 0.19mi |
| 111 E Broad St Falls Church, VA | 2.0 | 1.0–2.0 | 804 | $2,853 | $3.55 | 0d | 26 | 0.22mi |
| 450 N Washington St Falls Church, VA | 1.0–2.0 | 1.0–2.0 | 826 | $2,295 | $2.78 | 0d | 14 | 0.32mi |
| 210 E Fairfax St Falls Church, VA | 2.0 | 1.0 | 767 | $1,998 | $2.60 | 0d | 6 | 0.39mi |
| 809 W Broad St Falls Church, VA | 1.0 | 1.5 | 1075 | $2,000 | $1.86 | 0d | 11 | 0.60mi |
| 6600 Colton Crawford Cir Falls Church, VA | 1.0–3.0 | 1.0–2.5 | 1272 | $2,510 | $1.97 | 0d | 1 | 0.73mi |
| 110 Founders Ave Falls Church, VA | 2.0 | 1.0–2.0 | 941 | $3,117 | $3.31 | 0d | 26 | 0.77mi |
| 1033 W Broad St Falls Church, VA | 2.0 | 1.0–2.0 | 910 | $3,218 | $3.54 | 0d | 18 | 0.90mi |
| 6410 Arlington Blvd Falls Church, VA | 1.0 | 1.0–2.0 | 808 | $2,576 | $3.19 | 0d | 9 | 0.99mi |
| 501 Roosevelt Blvd Falls Church, VA | 2.0 | 1.0–2.0 | 823 | $2,309 | $2.81 | 4d | 33 | 1.07mi |
| 500 Roosevelt Blvd Falls Church, VA | 3.0 | 1.0–1.5 | 955 | $2,155 | $2.26 | 0d | 16 | 1.14mi |
| 136 W Falls Station Blvd Falls Church, VA | 2.0 | 1.0–2.0 | 877 | $3,098 | $3.53 | 0d | 54 | 1.31mi |
| 2916 Willston Pl Apt 101 Falls Church, VA | 1.0 | 1.0 | 578 | $1,650 | $2.85 | 0d | 1 | 1.37mi |
| 2910 Willston Pl Apt 202 Falls Church, VA | 2.0 | 1.0 | 718 | $2,000 | $2.79 | 6d | 1 | 1.37mi |
| 2825 Kalmia Lee Ct #301 Falls Church, VA | 1.0 | 1.0 | 707 | $2,000 | $2.83 | 16d | 1 | 1.40mi |
| 2919 Willston Pl #101 Falls Church, VA | 1.0 | 1.0 | 578 | $1,700 | $2.94 | 45d | 1 | 1.40mi |
| 2827 Kalmia Lee Ct Falls Church, VA | 1.0 | 1.0 | 707 | $1,900 | $2.69 | 4d | 1 | 1.40mi |
| 6200 Wilson Blvd Falls Church, VA | 3.0 | 1.0–2.0 | 912 | $2,266 | $2.48 | 0d | 22 | 1.42mi |
| 2916 Peyton Randolph Dr Falls Church, VA | 1.0 | 1.0 | 578 | $1,650 | $2.85 | 45d | 1 | 1.43mi |
HOA detail condo
- Monthly dues
- $638 · $7,656/yr
- Assessments
- None detected in remarks — confirm with the listing agent.
Listing history 30 events
-
2026-06-21days on market $259,500 Active 32 DOM
-
2026-06-18days on market $259,500 Active 29 DOM
-
2026-06-17price $259,500 Active 28 DOM
-
2026-06-17days on market $275,000 Active 28 DOM
-
2026-06-16days on market $275,000 Active 27 DOM
-
2026-06-15days on market $275,000 Active 26 DOM
-
2026-06-13days on market $275,000 Active 24 DOM
-
2026-06-13days on market $275,000 Active 23 DOM
-
2026-06-09days on market $275,000 Active 20 DOM
-
2026-06-08days on market $275,000 Active 19 DOM
-
2026-06-07days on market $275,000 Active 18 DOM
-
2026-06-04days on market $275,000 Active 15 DOM
-
2026-06-03days on market $275,000 Active 14 DOM
-
2026-06-02days on market $275,000 Active 13 DOM
-
2026-06-01days on market $275,000 Active 12 DOM
-
2026-05-31days on market $275,000 Active 11 DOM
-
2026-05-15historical $275,000 44-char remark
-
2025-01-31historical $1,975
-
2024-12-31$1,975
-
2004-10-25soldstatus $200,000
-
2004-10-22soldstatus $200,000 341-char remark
Show marketing remark (341 chars)
Walk to East Falls Church Metro! Spacious and updated 736 sq. ft. 1 bd-1 bath condo in Falls Church City!!Walk to shops, restaurants and State Theater. This bright basement condo has its own separate entrance, plenty of parking, new carpet and new appliances. The building is well managed and all utilities are included in the low condo fee.
-
2004-09-11historical 341-char remark
Show marketing remark (341 chars)
Walk to East Falls Church Metro! Spacious and updated 736 sq. ft. 1 bd-1 bath condo in Falls Church City!!Walk to shops, restaurants and State Theater. This bright basement condo has its own separate entrance, plenty of parking, new carpet and new appliances. The building is well managed and all utilities are included in the low condo fee.
-
2004-08-19$200,000 341-char remark
Show marketing remark (341 chars)
Walk to East Falls Church Metro! Spacious and updated 736 sq. ft. 1 bd-1 bath condo in Falls Church City!!Walk to shops, restaurants and State Theater. This bright basement condo has its own separate entrance, plenty of parking, new carpet and new appliances. The building is well managed and all utilities are included in the low condo fee.
-
2002-08-27soldstatus $100,000
-
2002-08-26soldstatus $100,000
-
2002-07-31historical
-
2002-07-26$101,900
-
1988-06-29soldstatus $66,000
-
1988-03-31soldstatus $66,000
-
1986-06-04soldstatus $52,700
ⓘ Source: listings_history table (triggers on properties + properties_extension) + one-shot
backfill from property_details.listing_events for pre-trigger history.
Tax reassessment forecast VA · Resets to sale price
- Current annual tax
- $2,781 · $232/mo
- Projected year-2 tax
- $2,781 · $232/mo
- Expected delta
- $0/yr ($0/mo · 0.0%)
ⓘ Screening estimate from a state-policy table — verify with the county assessor before closing.
Climate risk First Street
- Flood 1/10 Low FEMA zone X (unshaded) · 0% chance over 30 yrs
- Wildfire 1/10 Low
- Heat 7/10 Severe 7 d/yr ≥104°F today · 16 d/yr by 30 yrs out
- Wind 4/10 Moderate 16% chance of damaging wind over 30 yrs
- Air quality 3/10 Moderate 3 unhealthy d/yr today · 4 by 30 yrs out
Nearby sold comps map
Loading sold comps map…
Walkable amenities ~0.75 mi
Loading nearby amenities…
Taxation est. · year 1
- Rental income
- $27,072
- − Mortgage interest
- −$14,536
- − Property taxes
- −$2,781
- − Insurance
- −$1,298
- − Repairs & maintenance
- −$2,166
- − Management
- −$2,166
- − HOA
- −$7,656
- − Depreciation
- −$7,549
- Taxable loss
- −$11,079
- Est. tax savings @ 24.0%
- +$2,659
- After-tax cash flow
- $-4,019/yr
For passive investors: Depreciation is non-cash, so a rental often shows a tax loss while cash-flowing — sheltering income. Rental losses are passive: they offset passive income freely, and up to $25,000/yr can offset ordinary (W-2) income if you actively participate and your MAGI is under $100k (phasing out to $0 by $150k); unused losses carry forward. On sale, claimed depreciation is recaptured at up to 25%, and gains may owe capital-gains tax (a 1031 exchange can defer both). Figures are a year-1 estimate at your 24.0% rate — not tax advice; consult a CPA.
Schools (NCES district)
- District
- Falls Church City Public School District
- NCES district ID
- 5101290
- Math proficiency
- 84% ▼ -6.00%
- Reading proficiency
- 89% ▼ -2.00%
- Median HH income
- $115,025
- Composite
- 79.25/100
- National rank
- #64
- State rank
- #1 of 131 in VA
Livability — Falls Church
- Score
- 87/100
- State rank
- #9
- US rank
- #254
Category grades
Schools grade is shown separately in the Schools card above.
Census & demographics
- Census place
- Falls Church, VA
- County
- Falls Church City · 18,169 people
- City population
- 122,581
- Metro
- Washington-Arlington-Alexandria, DC-VA-MD-WV
- Population (ZIP)
- 18,169
- Household income
- $168,882
- Rent vs Own
- Severe rent burden
- 607.0
Population outlook (Falls Church County) Hauer SSP2
- Today (2025)
- 17,217 people
- By 2030
- 18,882 · +9.7%
- By 2040
- 22,350 · +29.8%
- By 2050
- 25,928 · +50.6%
- By 2075
- 34,606 · +101.0%
- By 2100
- 39,910 · +131.8%
Race, ethnicity, and origin ACS 2023
- Neighborhood character
- Predominantly White (67%)
- Race & ethnicity
- White 67% Hispanic / Latino 13% Asian 10% Two or more races 9% Black 5%
- Hispanic origin (detail)
- Mexican 2% Puerto Rican 1%
- Common ancestry
- Slovak 4% Romanian 3% Italian 3%
- Foreign-born
- 20% · Canada, Jamaica, Vietnam
- Languages at home
- 76% English-only · Spanish 9% Other Indo-European 4% Arabic 2%
Political lean MEDSL · Falls Church
- 2024 margin
- Solid D (+62.2) · D 80.3% · R 18.1% · Other 1.7%
- 2008→2024 swing
- +21.9pp toward D · 2008: 40.4pp · 2024: 62.2pp
- All cycles
- 2024: D+62.2 2020: D+64.1 2016: D+58.5 2012: D+39.5 2008: D+40.4
Not yet ingested
- Civics
- —
Market trends
- HPI YoY
- ▼ -811.68%
- Current HPI
- 346.6258
- Rent YoY
- ▼ -0.17%
- Metro
- Washington-Arlington-Alexandria, DC-VA-MD-WV
- State GDP YoY
- ▲ 2.40%
- F500 in state
- 50
Industry mix (Fortune 500 HQ in VA)
| Industry | F500 HQs | Revenue |
|---|---|---|
| Aerospace / Defense | 4 | $236B |
|
||
| Technology / Defense | 3 | $32B |
|
||
| Financial Services | 2 | $176B |
|
||
| Utilities | 2 | $27B |
|
||
| Insurance | 2 | $25B |
|
||
| Technology | 2 | $15B |
|
||
Price history
+392.4% since first listed16 events — show timeline
- 2026-06-17 Price Changed $259,500 BRIGHT MLS
- 2026-05-21 Listed $275,000 BRIGHT MLS
- 2026-05-15 Coming Soon $275,000 BRIGHT MLS
- 2025-01-31 Rental Removed $1,975 Avail
- 2024-12-31 Listed for Rent $1,975 Avail
- 2004-10-25 Sold (Public Records) $200,000 Public Records
- 2004-10-22 Sold (MLS) $200,000 MRIS
- 2004-09-11 Delisted — MRIS
- 2004-08-19 Listed $200,000 MRIS
- 2002-08-27 Sold (Public Records) $100,000 Public Records
- 2002-08-26 Sold (MLS) $100,000 MRIS
- 2002-07-31 Delisted — MRIS
- 2002-07-26 Listed $101,900 MRIS
- 1988-06-29 Sold (Public Records) $66,000 Public Records
- 1988-03-31 Sold (Public Records) $66,000 Public Records
- 1986-06-04 Sold (Public Records) $52,700 Public Records
Property tax history
+1.6%/yrLatest (2025): $2,781 · -3.0% YoY. Source: county tax records.
Cash-flow waterfall
monthlySold comps — $/sqft
last 12 mo · ≤1 miLoading sold comps…