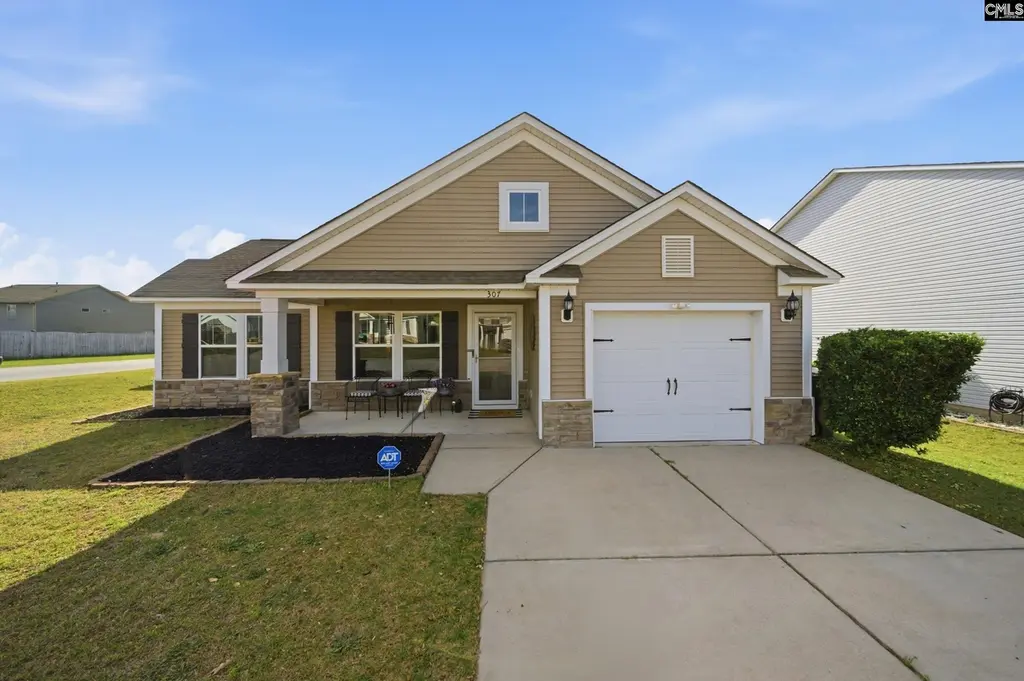
307 Deertrack Run · Red Bank, SC
Flood risk 1/10 · Minimal
- FEMA flood zone
- X (unshaded)
- Chance of flooding over 30 yrs
- 0.0%
- Est. flood insurance / yr
- $507 – $1,088
Fire risk 4/10 · Minor
- Est. fire insurance / yr
- $783 – $1,453
Heat risk 7/10 · Major
- Hot days now (above 108°F)
- 7 days/yr
- Hot days in 30 yrs
- 17 days/yr
Wind risk 6/10 · Moderate
- Chance of severe wind over 30 yrs
- 71.0%
Air-quality risk 3/10 · Minor
- Unhealthy air days now
- 2 days/yr
- Unhealthy air days in 30 yrs
- 2 days/yr
Risk factors via First Street. Map © Google.
Why this score? — see what drove the D- grade
The composite is a weighted blend of 9 inputs, each scored 0–100. Each bar is that input's sub-score; the figure is the points it added to the 100-point composite (weight × sub-score).
- Cash flow +11.6/30.0
- ARV discount +7.5/15.0
- Schools +4.2/10.0
- DSCR +3.4/10.0
- Rent growth +3.3/5.0
- Livability +3.3/5.0
- 1% rule +2.5/10.0
- Condition / age +2.5/5.0
- Appreciation +0.0/10.0
$260,000
🖨 Deal sheet 📄 Offer letter ✓ Due diligence
Listing remarks
Welcome to your next home! 3 bedrooms and 2 full baths. Equipped with 50 amp plug for smart car charging, programmable irrigation in front and back yard. Very energy efficient with gas tankless water heater. Hardwoods in the living room, dining and kitchen. Vaulted Ceilings in the living room and master bedroom. Granite counter tops in kitchen and baths. Kitchen has plenty of cabinet space and large center island, built in speaker system withcharging station. A grand living room with cathedral ceilings. Fully fenced in back yard with storage building. Tons of curb appeal, In ground sprinklers, Fully Fenced Backyard. Corner lot. Beautiful stone façade makes this home so warmand welcom
Key facts
- Granite counter tops
- Vaulted ceilings
- 6,969 sq ft lot
Tags
Property features AI
Finance
- HOA & community: Has an association; Association fee includes common area maintenance
Exterior
- Parking: Attached garage with 1 garage space (garage on main level)
- Utilities: Public water; Public sewer
- Home design: Single-story home; Main-level entry
- Construction: Slab foundation
- Exterior features: Covered front porch; Uncovered back porch; Stone and vinyl exterior; Paved road access
Interior
- Kitchen: Free-standing range
- Bedrooms: Master bedroom with private bath, separate shower, walk-in closet, ceiling fan, carpeted floors (main level); Second bedroom with shared bath, garden tub, carpeted floors (main level); Third bedroom with shared bath, private closet, carpeted floors (main level)
- Flooring: Carpet in bedrooms
- Bathrooms: Two full bathrooms
- Heating & cooling: Central heating; Central cooling
- Interior features: Attic with pull-down access; Free-standing range
- Laundry & utility: Washer/Dryer located on main level
Neighborhood map
What this means for you Summary
Snapshot
- This is a 3-bed/2.0-bath single-family listed at $260k.
Deal economics
- At list price, monthly cash flow is $-79 ($-943/yr) — negative.
- To cash-flow at today's rent, offer at most $246k (5.3% below list).
- To meet the 1% rule (rent ≥ 1% of price), the offer needs to be $194k (25.3% below list).
- Recommended offer: $194k (25.3% below list) — sets the bar for 1% rule.
Location & tenants
- Location reads 66/100 on livability (#121 in SC) — a middle-class / working-renter tenant base. Strengths: cost of living A+, housing A+, health & safety B; Watch: employment C-, crime D+, amenities F.
- Lexington 01 (suburban): math 42% / reading 53% proficiency, ranked #11 of 80 in SC (top 14%) — families likely to look elsewhere, expect single-tenant / working-renter base with shorter leases.
- Zoned schools: Saxe Gotha Elementary (math 35% / reading 40%, grade F, #311 of 597 statewide, top 53%, 686 students, 100% FRL); White Knoll High (math 47% / reading 85%, grade B, #81 of 196 statewide, top 42%, 2,204 students, 45% FRL) — zoned schools average 73% FRL vs 30% district-wide (42 pts higher); higher-poverty schools than district average — tighter screening recommended.
- Market conditions: Rents rising (+3.2%/yr); 564 active listings in the ZIP; 11 comparable units currently listed for rent nearby; rentals at typical pace (median 15d on market — plan ~3-4 weeks tenant-placement turnaround); solid renter incomes; 1,712 units permitted in Lexington County in 2024 (0 in 5+ unit buildings).
- This rent runs 30% of the median local income ($77k/yr) — at the standard rent-burdened threshold; future hikes will face affordability resistance.
Forward outlook
- Local home prices are declining (-3.0%/yr); year-one equity from $2k of loan paydown is wiped out by about $8k of value loss. Plan a longer hold.
- Lexington County population projected at +26% by 2050 — long-run rental-demand tailwind backs the buy-and-hold thesis.
Negotiation context
- It's been on market 41 days — a 3% lower offer ($252k) is reasonable based on typical stale-listing flexibility.
- 3 sale attempts since 3y ago with the ask held roughly flat each time — persistent listings suggest the price (not the market) is what's stuck; bring a comps-based counter.
Risks & watch-outs
- Climate carrying-cost: major wind risk, 71% chance of damaging wind over 30y; extreme-heat days projected 7→17/yr by 2055 (HVAC capex compounding) — expect insurance premiums to compound above CPI over the hold.
Questions for the listing agent
- What do current leases actually rent for vs. the listed asking? Can we see a recent rent roll and the last 12 months of T-12 income?
- It's been on market 41 days. Have you received any prior offers? Is the seller open to a 25% concession, seller financing, or rate buy-down credit?
- What does the HOA fee cover, when was the last increase, and are there any pending special assessments or reserve-fund shortfalls?
- Is there a deadline driving the sale (1031 exchange, divorce, estate, relocation)? That informs how much negotiation room exists.
- Schools are F-rated, which usually means shorter tenancies and higher turnover. Who's the typical renter profile here, and what's been the actual vacancy rate?
- Crime grade is D in this area — have there been break-ins, vandalism, or insurance claims at this property in the last 3 years? What carrier currently insures it and at what premium?
- The area grade is low — what's the realistic commute time and amenity access for the typical tenant pool here? Any planned neighborhood developments (good or bad) we should know about?
- What's the average days-on-market for RENTAL listings here right now (not sales)? A rising rental-DOM trend means longer vacancies and softer asking-rent achievability than the comps imply.
- What's the recent tenant-quality profile in this submarket — average credit score on applications, eviction rate, late-payment / NSF rate, and stable-employment percentage? A property-management company in the area should have these aggregated.
- How much new for-sale + rental construction is in the pipeline within 1–3 miles? Heavy new supply typically softens prices + rents 12–24 months out; constrained supply supports both.
Investment metrics
- 1% rule
- 0.75% ✗
- Cap rate
- 5.93%
- Cash-on-cash
- -1.29%
- DSCR
- 0.94
- GRM
- 11.2
CMA / ARV
No comps found within radius.
Projected returns pro-forma
-3.0% appreciation · 3.24% rent growth · sell at horizon
- IRR
- -18.2%
- Equity multiple
- 0.36×
- Total profit
- $-46,748
- Equity at exit
- $38,767
- IRR
- -10.2%
- Equity multiple
- 0.37×
- Total profit
- $-45,552
- Equity at exit
- $22,480
Cash invested: $72,800 (down + closing). Projections, not guarantees.
Landlord ↔ Tenant lean methodology
- Overall (STATE)
- 90 Strongly Landlord-Friendly
- State South Carolina
- 90 Strongly Landlord-Friendly · R+6
- County
- — inherits STATE
- City
- — inherits STATE
ZIP-level market 29073
- Home prices YoY
- -19.1%
- Rents YoY
- 3.2%
- Active inventory
- 564
- Price-to-rent
- 11.2×
Monthly cashflow live
- Estimated rent
- $1,942 high interval (Pro) →
- Mortgage (P&I)
- −$1,363
- Tax from tax record
- −$122 /mo · $1,463/yr
- Insurance
- −$108
- HOA
- −$19
- Vacancy / Maint / Mgmt
- −$408
- Net cashflow
- $-79
Break-even live
UW: 25.0% down · 7.5% · 30yr · 1.5% tax · 5.0% vac · 8.0% maint · 8.0% mgmt
Financing live
Cash to close
- Down payment
- $65,000
- Closing costs
- $7,800
- Reserves months
- —
- Total cash needed
- —
Loan-product check · same deal, 3 products live
Conventional
25% down · 7.5% · 30yr
- Down + closing
- —
- Monthly P&I
- —
- Monthly cashflow
- —
- DSCR
- —
- Eligible?
- —
Personal DTI + credit; lowest rate.
DSCR
20% down · 8.5% · 30yr
- Down + closing
- —
- Monthly P&I
- —
- Monthly cashflow
- —
- DSCR
- —
- Eligible?
- —
No personal income docs; deal must DSCR.
Hard money
10% down · 12.0% · 12mo
- Down + closing
- —
- Monthly P&I
- —
- Monthly cashflow
- —
- DSCR
- —
- Eligible?
- —
Short-term bridge; refi at stabilization.
Rent comps 11 comps
| Address | Beds | Baths | Sqft | Rent | $/sqft | DOM | Units | Dist |
|---|---|---|---|---|---|---|---|---|
| 847 Dovefield Ln Lexington, SC | 3.0 | 2.0 | 1302 | $1,850 | $1.42 | 14d | 1 | 0.05mi |
| 212 Pin Oak Dr Lexington, SC | 3.0 | 2.0 | 1349 | $1,710 | $1.27 | 14d | 1 | 0.36mi |
| 128 S Wrenwood Dr Lexington, SC | 3.0 | 2.0 | 1250 | $1,695 | $1.36 | 23d | 1 | 0.44mi |
| 120 W Lake Dr Lexington, SC | 3.0 | 2.0 | 1476 | $1,880 | $1.27 | 3d | 1 | 0.65mi |
| 290 Browning Ct Unit b Lexington, SC | 2.0 | 1.0 | 1100 | $1,495 | $1.36 | 21d | 1 | 0.65mi |
| 140 Land of Lakes Cir Lexington, SC | 3.0 | 2.0 | 1452 | $1,925 | $1.33 | 3d | 1 | 0.68mi |
| 1607 Commendable Ct Lexington, SC | 4.0 | 2.5 | 1783 | $2,238 | $1.26 | 23d | 1 | 0.70mi |
| 1603 Commendable Ct Lexington, SC | 3.0 | 2.0 | 1399 | $2,033 | $1.45 | 3d | 1 | 0.70mi |
| 110 Darian Dr Lexington, SC | 3.0 | 2.0 | 1364 | $1,949 | $1.43 | 14d | 1 | 0.93mi |
| 644 Old Orangeburg Rd Unit 644-B Lexington, SC | 2.0 | 2.0 | 900 | $1,095 | $1.22 | 3d | 1 | 0.99mi |
| 449 Lady Liberty Way Lexington, SC | 3.0 | 3.0 | 1635 | $1,995 | $1.22 | 23d | 1 | 1.19mi |
HOA detail
- Monthly dues
- $19 · $228/yr
- Likely covers
- watergas
Listing history 13 events
-
2026-05-20status Pending
-
2026-05-05historical Active - Contingent
-
2026-05-01price $260,000
-
2026-04-19price $262,500
-
2026-04-09$265,000 Active
-
2025-07-08$260,000 Active
-
2023-08-15soldstatus $245,000
-
2023-07-13status Pending
-
2023-06-29historical Active - Contingent
-
2023-06-23$245,000 Active
-
2017-09-21soldstatus $144,900
-
2015-01-30soldstatus $600,000
-
2012-12-28soldstatus $1,400,000
ⓘ Source: listings_history table (triggers on properties + properties_extension) + one-shot
backfill from property_details.listing_events for pre-trigger history.
Tax reassessment forecast SC · Resets to sale price
- Current annual tax
- $1,463 · $122/mo
- Projected year-2 tax
- $1,482 · $124/mo
- Expected delta
- +$19/yr (+$2/mo · 1.3%)
ⓘ Screening estimate from a state-policy table — verify with the county assessor before closing.
Climate risk First Street
- Flood 1/10 Low FEMA zone X (unshaded) · 0% chance over 30 yrs
- Wildfire 4/10 Moderate
- Heat 7/10 Severe 7 d/yr ≥108°F today · 17 d/yr by 30 yrs out
- Wind 6/10 Major 71% chance of damaging wind over 30 yrs
- Air quality 3/10 Moderate 2 unhealthy d/yr today · 2 by 30 yrs out
Nearby sold comps map
Loading sold comps map…
Walkable amenities ~0.75 mi
Loading nearby amenities…
Taxation est. · year 1
- Rental income
- $23,304
- − Mortgage interest
- −$14,564
- − Property taxes
- −$1,463
- − Insurance
- −$1,300
- − Repairs & maintenance
- −$1,864
- − Management
- −$1,864
- − HOA
- −$228
- − Depreciation
- −$7,564
- Taxable loss
- −$5,544
- Est. tax savings @ 24.0%
- +$1,330
- After-tax cash flow
- $388/yr
For passive investors: Depreciation is non-cash, so a rental often shows a tax loss while cash-flowing — sheltering income. Rental losses are passive: they offset passive income freely, and up to $25,000/yr can offset ordinary (W-2) income if you actively participate and your MAGI is under $100k (phasing out to $0 by $150k); unused losses carry forward. On sale, claimed depreciation is recaptured at up to 25%, and gains may owe capital-gains tax (a 1031 exchange can defer both). Figures are a year-1 estimate at your 24.0% rate — not tax advice; consult a CPA.
Schools (NCES district)
- District
- Lexington 01
- NCES district ID
- 4502700
- Math proficiency
- 42% ▼ -12.00%
- Reading proficiency
- 53% ▼ -2.00%
- Median HH income
- $61,298
- Composite
- 41.75/100
- National rank
- #3399
- State rank
- #11 of 80 in SC
Livability — Red Bank
- Score
- 66/100
- State rank
- #121
- US rank
- #11985
Category grades
Schools grade is shown separately in the Schools card above.
Census & demographics
- Census place
- Red Bank, SC
- County
- Lexington County · 232,571 people
- Metro
- Columbia, SC
- Population (ZIP)
- 53,156
- Household income
- $77,229
- Rent vs Own
- Severe rent burden
- 935.0
Population outlook (Lexington County) Hauer SSP2
- Today (2025)
- 322,999 people
- By 2030
- 342,356 · +6.0%
- By 2040
- 377,715 · +16.9%
- By 2050
- 406,984 · +26.0%
- By 2075
- 465,447 · +44.1%
- By 2100
- 485,674 · +50.4%
Race, ethnicity, and origin ACS 2023
- Neighborhood character
- Predominantly White (72%)
- Race & ethnicity
- White 72% Black 14% Two or more races 7% Hispanic / Latino 6% Asian 2%
- Hispanic origin (detail)
- Mexican 2% Puerto Rican 1%
- Common ancestry
- Romanian 3% Italian 2% Slovak 1%
- Foreign-born
- 4% · Canada, China
- Languages at home
- 93% English-only · Spanish 5% Other Indo-European 1%
Political lean MEDSL · Lexington
- 2024 margin
- Solid R (+33.5) · D 32.5% · R 66.0% · Other 1.4%
- 2008→2024 swing
- +4.6pp toward D · 2008: -38.0pp · 2024: -33.5pp
- All cycles
- 2024: R+33.5 2020: R+30.1 2016: R+36.7 2012: R+37.8 2008: R+38.0
Not yet ingested
- Civics
- —
Market trends
- HPI YoY
- ▼ -59.20%
- Current HPI
- 249.8957
- Rent YoY
- ▲ 3.24%
- Metro
- Columbia, SC
- State GDP YoY
- ▲ 4.51%
- F500 in state
- 2
Industry mix (Fortune 500 HQ in SC)
| Industry | F500 HQs | Revenue |
|---|---|---|
| Packaging | 1 | $7B |
|
||
Price history
-81.4% since first listed13 events — show timeline
- 2026-05-20 Pending — Consolidated MLS
- 2026-05-05 Contingent — Consolidated MLS
- 2026-05-01 Price Changed $260,000 Consolidated MLS
- 2026-04-19 Price Changed $262,500 Consolidated MLS
- 2026-04-09 Listed $265,000 Consolidated MLS
- 2025-07-08 Listed $260,000 Consolidated MLS
- 2023-08-15 Sold (Public Records) $245,000 Public Records
- 2023-07-13 Pending — Consolidated MLS
- 2023-06-29 Contingent — Consolidated MLS
- 2023-06-23 Listed $245,000 Consolidated MLS
- 2017-09-21 Sold (Public Records) $144,900 Public Records
- 2015-01-30 Sold (Public Records) $600,000 Public Records
- 2012-12-28 Sold (Public Records) $1,400,000 Public Records
Property tax history
+31.0%/yrLatest (2024): $1,463 · +64.8% YoY. Source: county tax records.
Cash-flow waterfall
monthlySold comps — $/sqft
last 12 mo · ≤1 miLoading sold comps…