1160 E Lakeshore Dr W · Shelton, WA
Flood risk 1/10 · Minimal
- FEMA flood zone
- X (unshaded)
- Chance of flooding over 30 yrs
- 0.0%
- Est. flood insurance / yr
- $507 – $1,088
Fire risk 3/10 · Minor
- Est. fire insurance / yr
- $604 – $1,122
Heat risk 3/10 · Minor
- Hot days now (above 88°F)
- 7 days/yr
- Hot days in 30 yrs
- 14 days/yr
Wind risk 1/10 · Minimal
- Chance of severe wind over 30 yrs
- —
Air-quality risk 7/10 · Major
- Unhealthy air days now
- 8 days/yr
- Unhealthy air days in 30 yrs
- 9 days/yr
Risk factors via First Street. Map © Google.
Why this score? — see what drove the B- grade
The composite is a weighted blend of 9 inputs, each scored 0–100. Each bar is that input's sub-score; the figure is the points it added to the 100-point composite (weight × sub-score).
- Cash flow +25.5/30.0
- ARV discount +15.0/15.0
- DSCR +8.4/10.0
- 1% rule +6.1/10.0
- Schools +4.0/10.0
- Livability +3.7/5.0
- Rent growth +2.5/5.0
- Condition / age +2.5/5.0
- Appreciation +0.0/10.0
$140,000
🖨 Deal sheet 📄 Offer letter ✓ Due diligence
Listing remarks
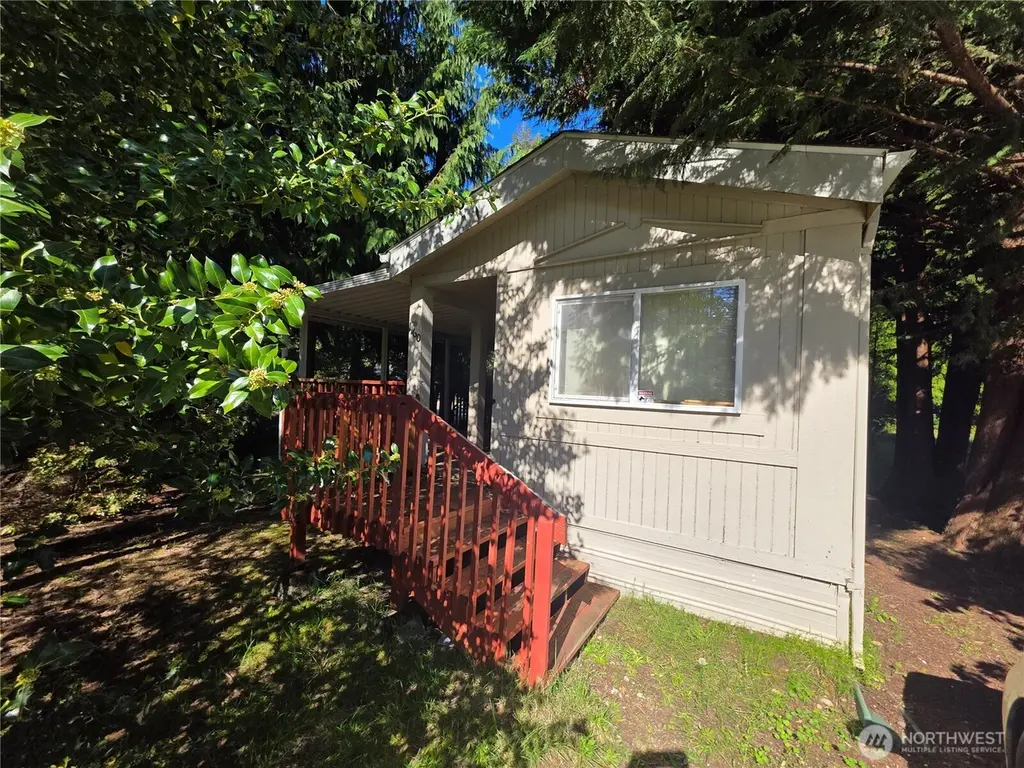
Opportunity on a half-acre corner lot in a cul-de-sac in Timberlakes. The existing home offers potential for a full remodel or tear down, with value in the land and key improvements already in place—including a 3-bedroom septic system and detached garage. Spacious yard with additional upside from the adjacent wooded lot. Cash sale only, sold as-is. Ideal for investors, builders, or buyers looking to create something new.
Key facts
- Spacious yard
- Half-acre corner lot
- Adjacent wooded lot
Tags
Property features AI
Finance
- Other: Property condition noted as fixer; Lot is approximately 0.5 acre (lots 102 & 103)
- Financial info: Listing terms: Cash
- HOA & community: Homeowners association with annual fee of $280 (includes road maintenance); association contact: Angie; Community features include boat launch, CCRs, club house, playground, trails; No senior exemption indicated
Exterior
- Parking: Detached garage; One covered space; Two uncovered/off-street spaces; Driveway
- Utilities: Electric energy source; Community water (Timberlakes); Septic sewer; Electric water heater; Power via PUD 3
- Home design: Manufactured single-wide home; Manufactured on land (Residential); One story; Entry on main level; Facing level topography
- Construction: Built 1993 (effective year); Wood construction; Composition roof; Tie down foundation; Marlette Homes model 1828
- Exterior features: Wood products siding; Deck; Outbuildings; Fruit trees; Garden space; Wooded; Paved site; Value in land
Interior
- Kitchen: Refrigerator; Stove/Range; Kitchen with eating space
- Bedrooms: Two bedrooms on the main level; Possible third bedroom
- Flooring: Vinyl; Carpet
- Bathrooms: One full bathroom with tub and separate shower (main level)
- Heating & cooling: Forced air heating; No cooling
- Interior features: Water heater; Tie down foundation
- Laundry & utility: Utility room (main level)
Neighborhood map
What this means for you Summary
Snapshot
- This is a 2-bed/1.0-bath manufactured listed at $140k.
Deal economics
- At list price, monthly cash flow is $327 ($4k/yr) — positive.
- The deal already cash-flows at list — no discount required.
- Meets the 1% rule at list price ($2k rent vs $140k).
- Recommended offer: $136k (3.0% below list) — sets the bar for market timing.
- Cap rate 9.1% vs local median 3.1% in Shelton — top-decile yield for the area; either an underpriced asset or a hidden risk that comps aren't pricing in. Stress-test before assuming the spread holds.
Location & tenants
- Location reads 73/100 on livability (#203 in WA) — a middle-class / working-renter tenant base. Strengths: housing A+, health & safety A+, amenities A-; Watch: employment D+, crime F, commute F.
- Pioneer School District (rural): math 37% / reading 51% proficiency, ranked #188 of 291 in WA (top 65%) — families likely to look elsewhere, expect single-tenant / working-renter base with shorter leases.
- Zoned schools: Pioneer Elementary School (503 students, 63% FRL).
- Market conditions: 439 active listings in the ZIP; solid renter incomes; 299 units permitted in Mason County in 2024 (0 in 5+ unit buildings).
Forward outlook
- Local home prices are declining (-3.0%/yr); year-one equity from $968 of loan paydown is wiped out by about $4k of value loss. Plan a longer hold.
- Mason County population projected at -14% by 2050 — secular population decline; favor cash flow + early exit over multi-decade hold.
Negotiation context
- It's been on market 35 days — a 3% lower offer ($136k) is reasonable based on typical stale-listing flexibility.
- 3 sale attempts since 8y ago; this cycle's ask has dropped $10k (7%) from the opening price — seller is motivated, your offer sets the floor, not the list.
- Current owner paid $90k; list at $140k implies a 56% gain — meaningful room to come down on a strong offer.
Questions for the listing agent
- It's been on market 35 days. Have you received any prior offers? Is the seller open to a 3% concession, seller financing, or rate buy-down credit?
- What does the HOA fee cover, when was the last increase, and are there any pending special assessments or reserve-fund shortfalls?
- Is there a deadline driving the sale (1031 exchange, divorce, estate, relocation)? That informs how much negotiation room exists.
- Schools are D-rated, which usually means shorter tenancies and higher turnover. Who's the typical renter profile here, and what's been the actual vacancy rate?
- Crime grade is F in this area — have there been break-ins, vandalism, or insurance claims at this property in the last 3 years? What carrier currently insures it and at what premium?
- What's the average days-on-market for RENTAL listings here right now (not sales)? A rising rental-DOM trend means longer vacancies and softer asking-rent achievability than the comps imply.
- What's the recent tenant-quality profile in this submarket — average credit score on applications, eviction rate, late-payment / NSF rate, and stable-employment percentage? A property-management company in the area should have these aggregated.
- How much new for-sale + rental construction is in the pipeline within 1–3 miles? Heavy new supply typically softens prices + rents 12–24 months out; constrained supply supports both.
Investment metrics
- 1% rule
- 1.11% ✓
- Cap rate
- 9.09%
- Cash-on-cash
- 10.00%
- DSCR
- 1.44
- GRM
- 7.5
CMA / ARV
- ARV (median comp)
- $272,104
- List price
- $140,000
- Delta
- -48.55%
- Verdict
- UNDERPRICED
- Comps
- 6 within 1.0 mi
Show comp detail 3 sales within ~0.75 mi
| Address | Dist | Beds/Ba | Sqft | Sold | Price | $/sf | Match |
|---|---|---|---|---|---|---|---|
| 141 E Elk Pl | 0.17mi | 3/2.0 (+1) | 960 (+4%) | 11mo | $287,000 | $299 | 67 |
| 260 E Tahuya Dr | 0.52mi | 2/1.0 | 924 (0%) | 10mo | $255,000 | $276 | 67 |
| 421 E Agate Dr | 0.54mi | 2/1.0 | 840 (-9%) | 3mo | $90,000 | $107 | 57 |
Match score weights: distance 35% · size 25% · config 20% · recency 20%. Top-matched comps best support the ARV.
Projected returns pro-forma
-3.0% appreciation · 3.0% rent growth · sell at horizon
- IRR
- -1.3%
- Equity multiple
- 0.95×
- Total profit
- $-1,899
- Equity at exit
- $20,874
- IRR
- 8.4%
- Equity multiple
- 1.64×
- Total profit
- $25,072
- Equity at exit
- $12,105
Cash invested: $39,200 (down + closing). Projections, not guarantees.
Landlord ↔ Tenant lean methodology
- Overall (STATE)
- 28 Tenant-Leaning
- State Washington
- 28 Tenant-Leaning · D+8
- County
- — inherits STATE
- City
- — inherits STATE
ZIP-level market 98584
- Active inventory
- 439
- Price-to-rent
- 7.5×
Monthly cashflow live
- Estimated rent
- $1,560 medium interval (Pro) →
- Mortgage (P&I)
- −$734
- Tax from tax record
- −$90 /mo · $1,083/yr
- Insurance
- −$58
- HOA
- −$23
- Vacancy / Maint / Mgmt
- −$328
- Net cashflow
- $327
Break-even live
UW: 25.0% down · 7.5% · 30yr · 1.5% tax · 5.0% vac · 8.0% maint · 8.0% mgmt
Financing live
Cash to close
- Down payment
- $35,000
- Closing costs
- $4,200
- Reserves months
- —
- Total cash needed
- —
Loan-product check · same deal, 3 products live
Conventional
25% down · 7.5% · 30yr
- Down + closing
- —
- Monthly P&I
- —
- Monthly cashflow
- —
- DSCR
- —
- Eligible?
- —
Personal DTI + credit; lowest rate.
DSCR
20% down · 8.5% · 30yr
- Down + closing
- —
- Monthly P&I
- —
- Monthly cashflow
- —
- DSCR
- —
- Eligible?
- —
No personal income docs; deal must DSCR.
Hard money
10% down · 12.0% · 12mo
- Down + closing
- —
- Monthly P&I
- —
- Monthly cashflow
- —
- DSCR
- —
- Eligible?
- —
Short-term bridge; refi at stabilization.
HOA detail
- Monthly dues
- $23 · $276/yr
Listing history 19 events
-
2026-06-12statusdays on market $140,000 Pending 35 DOM
-
2026-06-09days on market $140,000 Active 33 DOM
-
2026-06-08days on market $140,000 Active 32 DOM
-
2026-06-07days on market $140,000 Active 31 DOM
-
2026-06-03days on market $140,000 Active 27 DOM
-
2026-06-02days on market $140,000 Active 26 DOM
-
2026-06-01days on market $140,000 Active 25 DOM
-
2026-05-31days on market $140,000 Active 24 DOM
-
2026-05-30days on market $140,000 Active 23 DOM
-
2026-05-12status Active
-
2026-05-11status Pending
-
2026-05-06$150,000 Active
-
2019-01-18soldstatus $90,000 Sold
-
2019-01-18soldstatus $90,000
-
2019-01-04status Pending
-
2018-12-20status Pending Inspection
-
2018-11-27price $99,900
-
2018-11-14price $109,900
-
2018-10-26$119,900 Active
ⓘ Source: listings_history table (triggers on properties + properties_extension) + one-shot
backfill from property_details.listing_events for pre-trigger history.
Tax reassessment forecast WA · Resets to sale price
- Current annual tax
- $1,083 · $90/mo
- Projected year-2 tax
- $1,372 · $114/mo
- Expected delta
- +$289/yr (+$24/mo · 26.7%)
ⓘ Screening estimate from a state-policy table — verify with the county assessor before closing.
Climate risk First Street
- Flood 1/10 Low FEMA zone X (unshaded) · 0% chance over 30 yrs
- Wildfire 3/10 Moderate
- Heat 3/10 Moderate 7 d/yr ≥88°F today · 14 d/yr by 30 yrs out
- Wind 1/10 Low
- Air quality 7/10 Severe 8 unhealthy d/yr today · 9 by 30 yrs out
Nearby sold comps map
Loading sold comps map…
Walkable amenities ~0.75 mi
Loading nearby amenities…
Taxation est. · year 1
- Rental income
- $18,719
- − Mortgage interest
- −$7,842
- − Property taxes
- −$1,083
- − Insurance
- −$700
- − Repairs & maintenance
- −$1,498
- − Management
- −$1,498
- − HOA
- −$276
- − Depreciation
- −$4,073
- Taxable income
- $1,750
- Est. tax owed @ 24.0%
- −$420
- After-tax cash flow
- $3,499/yr
For passive investors: Depreciation is non-cash, so a rental often shows a tax loss while cash-flowing — sheltering income. Rental losses are passive: they offset passive income freely, and up to $25,000/yr can offset ordinary (W-2) income if you actively participate and your MAGI is under $100k (phasing out to $0 by $150k); unused losses carry forward. On sale, claimed depreciation is recaptured at up to 25%, and gains may owe capital-gains tax (a 1031 exchange can defer both). Figures are a year-1 estimate at your 24.0% rate — not tax advice; consult a CPA.
Schools (NCES district)
- District
- Pioneer School District
- NCES district ID
- 5306750
- Math proficiency
- 37% ▼ -6.00%
- Reading proficiency
- 51% ▼ -2.00%
- Median HH income
- $51,151
- Composite
- 40.15/100
- National rank
- #7840
- State rank
- #188 of 291 in WA
Livability — Shelton
- Score
- 73/100
- State rank
- #203
- US rank
- #5586
Category grades
Schools grade is shown separately in the Schools card above.
Census & demographics
- County
- Mason County · 40,606 people
- City population
- 40,606
- Metro
- Shelton, WA
- Population (ZIP)
- 40,606
- Household income
- $78,610
- Rent vs Own
- Severe rent burden
- 687.0
Population outlook (Mason County) Hauer SSP2
- Today (2025)
- 60,005 people
- By 2030
- 58,567 · -2.4%
- By 2040
- 54,735 · -8.8%
- By 2050
- 51,470 · -14.2%
- By 2075
- 46,276 · -22.9%
- By 2100
- 39,883 · -33.5%
Race, ethnicity, and origin ACS 2023
- Neighborhood character
- Predominantly White (72%)
- Race & ethnicity
- White 72% Hispanic / Latino 15% Two or more races 11% Native American 3%
- Hispanic origin (detail)
- Mexican 8%
- Common ancestry
- Portuguese 4% Slovak 3% Italian 2%
- Foreign-born
- 8% · Canada
- Languages at home
- 88% English-only · Spanish 10%
Political lean MEDSL · Mason
- 2024 margin
- Toss-up / Even · D 47.2% · R 49.7% · Other 3.2%
- 2008→2024 swing
- -11.2pp toward R · 2008: 8.7pp · 2024: -2.5pp
- All cycles
- 2024: R+2.5 2020: R+3.9 2016: R+6.0 2012: D+6.9 2008: D+8.7
Not yet ingested
- Civics
- —
Market trends
- HPI YoY
- ▼ -232.42%
- Current HPI
- 199.0698
- Rent YoY
- —
- Metro
- Shelton, WA
- State GDP YoY
- ▲ 4.65%
- F500 in state
- 22
Industry mix (Fortune 500 HQ in WA)
| Industry | F500 HQs | Revenue |
|---|---|---|
| Retail | 2 | $269B |
|
||
| Technology / Retail | 1 | $638B |
|
||
| Technology | 1 | $245B |
|
||
| Telecommunications | 1 | $38B |
|
||
| Food / Beverage | 1 | $36B |
|
||
| Automotive / Trucks | 1 | $34B |
|
||
Price history
+16.8% since first listed12 events — show timeline
- 2026-06-11 Pending — NWMLS as Distributed by MLS Grid
- 2026-05-29 Price Changed $140,000 NWMLS as Distributed by MLS Grid
- 2026-05-12 Relisted — NWMLS as Distributed by MLS Grid
- 2026-05-11 Pending — NWMLS as Distributed by MLS Grid
- 2026-05-06 Listed $150,000 NWMLS as Distributed by MLS Grid
- 2019-01-18 Sold (Public Records) $90,000 Public Records
- 2019-01-18 Sold (MLS) $90,000 NWMLS as Distributed by MLS Grid
- 2019-01-04 Pending — NWMLS as Distributed by MLS Grid
- 2018-12-20 Pending — NWMLS as Distributed by MLS Grid
- 2018-11-27 Price Changed $99,900 NWMLS as Distributed by MLS Grid
- 2018-11-14 Price Changed $109,900 NWMLS as Distributed by MLS Grid
- 2018-10-26 Listed $119,900 NWMLS as Distributed by MLS Grid
Property tax history
+37.2%/yrLatest (2026): $1,083 · +5.0% YoY. Source: county tax records.
Cash-flow waterfall
monthlySold comps — $/sqft
last 12 mo · ≤1 miLoading sold comps…