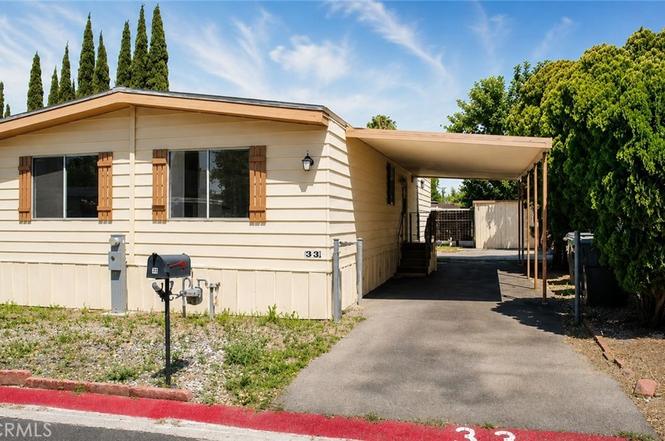
995 Pomona Rd #33 · Corona, CA
Flood risk 1/10 · Minimal
- FEMA flood zone
- X (shaded)
- Chance of flooding over 30 yrs
- 0.0%
- Est. flood insurance / yr
- $507 – $1,088
Fire risk 7/10 · Major
- Est. fire insurance / yr
- $659 – $1,223
Heat risk 7/10 · Major
- Hot days now (above 100°F)
- 6 days/yr
- Hot days in 30 yrs
- 17 days/yr
Wind risk 1/10 · Minimal
- Chance of severe wind over 30 yrs
- —
Air-quality risk 9/10 · Severe
- Unhealthy air days now
- 19 days/yr
- Unhealthy air days in 30 yrs
- 23 days/yr
Risk factors via First Street. Map © Google.
Why this score? — see what drove the B+ grade
The composite is a weighted blend of 9 inputs, each scored 0–100. Each bar is that input's sub-score; the figure is the points it added to the 100-point composite (weight × sub-score).
- Cash flow +30.0/30.0
- ARV discount +15.0/15.0
- 1% rule +10.0/10.0
- DSCR +10.0/10.0
- Schools +5.1/10.0
- Livability +3.2/5.0
- Rent growth +2.9/5.0
- Condition / age +2.5/5.0
- Appreciation +0.0/10.0
$139,999
🖨 Deal sheet 📄 Offer letter ✓ Due diligence
Listing remarks MLS
Enjoy community living at Corona West Mobile home Park! This updated 3-bedroom, 2 bath home is in a family friendly community offering a clubhouse and swimming pool. Features include new interior paint, flooring, kitchen cabinets, and remodeled bathrooms. Conveniently located near freeway for easy commuting. Great opportunity! Perfect opportunity to make it your own! "Virtually staged and enhanced photos"
Key facts
- Clubhouse
- Swimming pool
- Prime location
Tags
Neighborhood map
What this means for you Summary
Snapshot
- This is a 2-bed/2.0-bath manufactured listed at $140k.
Deal economics
- At list price, monthly cash flow is $1k ($14k/yr) — positive.
- The deal already cash-flows at list — no discount required.
- Meets the 1% rule at list price ($3k rent vs $140k).
- Recommended offer: $127k (9.0% below list) — sets the bar for market timing.
- Cap rate 16.4% vs local median 2.9% in Corona — top-decile yield for the area; either an underpriced asset or a hidden risk that comps aren't pricing in. Stress-test before assuming the spread holds.
Location & tenants
- Location reads 63/100 on livability (#461 in CA) — a middle-class / working-renter tenant base. Strengths: employment A+, housing A-; Watch: commute C-, health & safety D, amenities F.
- Corona-Norco Unified (suburban): math 46% / reading 61% proficiency, ranked #312 of 1,400 in CA (top 22%) — acceptable for families but not a draw, mixed tenant base, ~2y average lease.
- Market conditions: Rents rising (+1.4%/yr); 126 active listings in the ZIP; 34 comparable units currently listed for rent nearby; rentals at typical pace (median 22d on market — plan ~3-4 weeks tenant-placement turnaround); solid renter incomes; 9,195 units permitted in Riverside County in 2024 (1,512 in 5+ unit buildings).
- This rent runs 31% of the median local income ($104k/yr) — at the standard rent-burdened threshold; future hikes will face affordability resistance.
Forward outlook
- Local home prices are declining (-3.0%/yr); year-one equity from $968 of loan paydown is wiped out by about $4k of value loss. Plan a longer hold.
- Riverside County population projected at +22% by 2050 — long-run rental-demand tailwind backs the buy-and-hold thesis.
- At projected returns (-3.0% appreciation + 1.4% rent growth), your $39k cash investment doubles in ~4 years — after that, you're playing with house money.
Negotiation context
- It's been on market 104 days — a 9% lower offer ($127k) is reasonable based on typical stale-listing flexibility.
- 3 sale attempts; this cycle's ask is 56% above the opening price — seller raised mid-cycle; expect resistance to lowballs.
Risks & watch-outs
- Climate carrying-cost: major wildfire risk; extreme-heat days projected 6→17/yr by 2055 (HVAC capex compounding) — expect insurance premiums to compound above CPI over the hold.
Questions for the listing agent
- It's been on market 104 days. Have you received any prior offers? Is the seller open to a 9% concession, seller financing, or rate buy-down credit?
- Built in 1978 — when were the roof, HVAC, electrical panel, plumbing, and water heater last replaced?
- Why hasn't it sold? Are there any deal-killer items the seller is aware of (foundation, flood, title, zoning, code violations)?
- Is there a deadline driving the sale (1031 exchange, divorce, estate, relocation)? That informs how much negotiation room exists.
- Schools are B-rated — typically a magnet for longer-tenancy family renters. What's the average tenant stay here, and is there a school-zone premium baked into asking?
- What's the average days-on-market for RENTAL listings here right now (not sales)? A rising rental-DOM trend means longer vacancies and softer asking-rent achievability than the comps imply.
- What's the recent tenant-quality profile in this submarket — average credit score on applications, eviction rate, late-payment / NSF rate, and stable-employment percentage? A property-management company in the area should have these aggregated.
- How much new for-sale + rental construction is in the pipeline within 1–3 miles? Heavy new supply typically softens prices + rents 12–24 months out; constrained supply supports both.
Investment metrics
- 1% rule
- 1.94% ✓
- Cap rate
- 16.38%
- Cash-on-cash
- 36.03%
- DSCR
- 2.60
- GRM
- 4.3
CMA / ARV
- ARV (median comp)
- $170,000
- List price
- $139,999
- Delta
- -17.65%
- Verdict
- UNDERPRICED
- Comps
- 5 within 1.0 mi
Show comp detail 3 sales within ~0.75 mi
| Address | Dist | Beds/Ba | Sqft | Sold | Price | $/sf | Match |
|---|---|---|---|---|---|---|---|
| 995 Pomona Rd Spc 11 | 0.01mi | 3/2.0 (+1) | 1,344 (+8%) | 7mo | $125,000 | $93 | 76 |
| 995 Pomona Rd #47 | 0.01mi | 2/1.0 | 1,152 (-8%) | 19mo | $75,000 | $65 | 67 |
| 1225 W 8th St #45 | 0.68mi | 3/2.0 (+1) | 1,320 (+6%) | 20mo | $148,000 | $112 | 37 |
Match score weights: distance 35% · size 25% · config 20% · recency 20%. Top-matched comps best support the ARV.
Projected returns pro-forma
-3.0% appreciation · 1.45% rent growth · sell at horizon
- IRR
- 30.0%
- Equity multiple
- 2.23×
- Total profit
- $48,141
- Equity at exit
- $20,874
- IRR
- 36.4%
- Equity multiple
- 4.11×
- Total profit
- $122,020
- Equity at exit
- $12,105
Cash invested: $39,200 (down + closing). Projections, not guarantees.
Landlord ↔ Tenant lean methodology
- Overall (STATE)
- 18 Strongly Tenant-Friendly
- State California
- 18 Strongly Tenant-Friendly · D+13
- County
- — inherits STATE
- City
- — inherits STATE
ZIP-level market 92882
- Rents YoY
- 1.4%
- Active inventory
- 126
- Price-to-rent
- 4.3×
Monthly cashflow live
- Estimated rent
- $2,714 high interval (Pro) →
- Mortgage (P&I)
- −$734
- Tax est. 1.5%
- −$175 /mo · $2,100/yr
- Insurance
- −$58
- HOA
- −$0
- Vacancy / Maint / Mgmt
- −$570
- Net cashflow
- $1,177
Break-even live
UW: 25.0% down · 7.5% · 30yr · 1.5% tax · 5.0% vac · 8.0% maint · 8.0% mgmt
Financing live
Cash to close
- Down payment
- $35,000
- Closing costs
- $4,200
- Reserves months
- —
- Total cash needed
- —
Loan-product check · same deal, 3 products live
Conventional
25% down · 7.5% · 30yr
- Down + closing
- —
- Monthly P&I
- —
- Monthly cashflow
- —
- DSCR
- —
- Eligible?
- —
Personal DTI + credit; lowest rate.
DSCR
20% down · 8.5% · 30yr
- Down + closing
- —
- Monthly P&I
- —
- Monthly cashflow
- —
- DSCR
- —
- Eligible?
- —
No personal income docs; deal must DSCR.
Hard money
10% down · 12.0% · 12mo
- Down + closing
- —
- Monthly P&I
- —
- Monthly cashflow
- —
- DSCR
- —
- Eligible?
- —
Short-term bridge; refi at stabilization.
Rent comps 34 comps
| Address | Beds | Baths | Sqft | Rent | $/sqft | DOM | Units | Dist |
|---|---|---|---|---|---|---|---|---|
| 125 N Buena Vista Ave Corona, CA | 2.0 | 2.0 | 747 | $2,100 | $2.81 | 11d | 1 | 0.11mi |
| 125 N Buena Vista Ave Apt H Corona, CA | 2.0 | 2.0 | 785 | $2,000 | $2.55 | 24d | 1 | 0.13mi |
| 1211 W 6th St Corona, CA | 1.0–2.0 | 1.0–2.0 | 723 | $2,435 | $3.37 | 3d | 2 | 0.63mi |
| 260 W 3rd St Corona, CA | 2.0 | 1.5 | 832 | $2,250 | $2.70 | 43d | 1 | 0.65mi |
| 211 W Rincon St Corona, CA | 1.0–2.0 | 1.0–2.0 | 948 | $3,005 | $3.17 | 1d | 17 | 0.68mi |
| 111 W Harrison St Corona, CA | 1.0–2.0 | 1.0–2.0 | 900 | $3,160 | $3.51 | 1d | 15 | 0.69mi |
| 418 N Main St Corona, CA | 1.0–2.0 | 1.0–2.0 | 999 | $2,940 | $2.94 | 2d | 16 | 0.71mi |
| 1261 Ryan Ln Corona, CA | 2.0 | 1.5–2.0 | 860 | $2,425 | $2.82 | 24d | 2 | 0.77mi |
| 604 W 10th St Unit 1 Corona, CA | 3.0 | 2.0 | 1450 | $2,595 | $1.79 | 16d | 1 | 0.82mi |
| 901 S Smith Ave Corona, CA | 2.0 | 2.0 | 985 | $1,950 | $1.98 | 43d | 1 | 0.88mi |
| 461 River Rd Unit 473-B Corona, CA | 2.0 | 1.5 | 1072 | $2,100 | $1.96 | 16d | 1 | 0.88mi |
| 508 S Victoria Ave Apt 21 Corona, CA | 2.0 | 1.5 | 705 | $1,895 | $2.69 | 24d | 1 | 0.93mi |
| 508 S Victoria Ave Corona, CA | 1.0–2.0 | 1.0–1.5 | 652 | $1,995 | $3.06 | 16d | 4 | 0.93mi |
| 928 N Vicentia Ave Unit C Corona, CA | 2.0 | 1.5 | 1050 | $2,100 | $2.00 | 5d | 1 | 0.98mi |
| 931 Rebecca Way Corona, CA | 1.0–2.0 | 1.0–2.0 | 766 | $2,485 | $3.24 | 1d | 7 | 0.99mi |
| 985 Samar Ct Corona, CA | 2.0 | 2.0 | 945 | $2,208 | $2.34 | 5d | 3 | 1.01mi |
| 730 Via De Luna Corona, CA | 1.0–2.0 | 1.0 | 690 | $2,156 | $3.12 | 1d | 9 | 1.01mi |
| 219 E Parkridge Ave Corona, CA | 2.0 | 1.0 | 730 | $2,300 | $3.15 | 43d | 1 | 1.12mi |
| 1617 Toyon Pl Corona, CA | 3.0 | 2.0 | 1497 | $3,490 | $2.33 | 2d | 1 | 1.25mi |
| 810 Quarry St Corona, CA | 1.0 | 1.0 | 824 | $2,200 | $2.67 | 43d | 1 | 1.25mi |
| 929 E Grand Blvd Corona, CA | 2.0 | 1.5 | 1425 | $2,800 | $1.96 | 2d | 1 | 1.31mi |
| 1704 Lorraine Dr Unit 2 Corona, CA | 3.0 | 2.0 | 1176 | $3,599 | $3.06 | 43d | 1 | 1.31mi |
| 1705 Lorraine Ave Corona, CA | 3.0 | 2.0 | 1429 | $4,349 | $3.04 | 43d | 1 | 1.32mi |
| 1704 Taylor Ave Corona, CA | 3.0 | 2.0 | 1429 | $4,679 | $3.27 | 1d | 1 | 1.32mi |
| 1734 Lorraine Dr Unit 2 Corona, CA | 3.0 | 2.0 | 1176 | $3,649 | $3.10 | 43d | 1 | 1.33mi |
| 1735 Lorraine Dr Unit 2 Corona, CA | 3.0 | 2.0 | 1176 | $3,869 | $3.29 | 43d | 1 | 1.35mi |
| 680 Susanne St Unit 2 Corona, CA | 3.0 | 2.0 | 1176 | $3,619 | $3.08 | 43d | 1 | 1.36mi |
| 662 Susanne St Unit 2 Corona, CA | 3.0 | 2.0 | 1176 | $3,669 | $3.12 | 43d | 1 | 1.37mi |
| 639 W Citron St Corona, CA | 3.0 | 2.0 | 1429 | $4,099 | $2.87 | 43d | 1 | 1.38mi |
| 629 Citron St Unit 2 Corona, CA | 3.0 | 2.0 | 1176 | $3,639 | $3.09 | 24d | 1 | 1.39mi |
| 810 Pine St Corona, CA | 3.0 | 2.0 | 1000 | $2,700 | $2.70 | 21d | 1 | 1.44mi |
| 1700 Via Pacifica Corona, CA | 1.0–3.0 | 1.0–2.0 | 1000 | $2,649 | $2.65 | 1d | 26 | 1.47mi |
| 1428 Camelot Dr Corona, CA | 3.0 | 1.5 | 1495 | $2,800 | $1.87 | 18d | 1 | 1.49mi |
| 445 E Francis St Unit 1/2 Corona, CA | 1.0 | 1.0 | 750 | $1,900 | $2.53 | 43d | 1 | 1.50mi |
Listing history 18 events
-
2026-06-18days on market $139,999 Active 104 DOM
-
2026-06-17days on market $139,999 Active 103 DOM
-
2026-06-16days on market $139,999 Active 102 DOM
-
2026-06-15days on market $139,999 Active 101 DOM
-
2026-06-13days on market $139,999 Active 99 DOM
-
2026-06-13days on market $139,999 Active 98 DOM
-
2026-06-09days on market $139,999 Active 95 DOM
-
2026-06-08days on market $139,999 Active 94 DOM
-
2026-06-07days on market $139,999 Active 93 DOM
-
2026-06-04days on market $139,999 Active 90 DOM
-
2026-06-03days on market $139,999 Active 89 DOM
-
2026-06-02days on market $139,999 Active 88 DOM
-
2026-06-01days on market $139,999 Active 87 DOM
-
2026-05-31days on market $139,999 Active 86 DOM
-
2026-04-05status Active 420-char remark
Show marketing remark (420 chars)
Enjoy community living at Corona West Mobile home Park! This updated 3-bedroom, 2 bath home is in a family friendly community offering a clubhouse and swimming pool. Features include new interior paint, flooring, kitchen cabinets, and remodeled bathrooms. Conveniently located near freeway for easy commuting. Great opportunity! Perfect opportunity to make it your own! "Virtually staged and enhanced photos"
-
2026-03-12price $139,999 420-char remark
Show marketing remark (420 chars)
Enjoy community living at Corona West Mobile home Park! This updated 3-bedroom, 2 bath home is in a family friendly community offering a clubhouse and swimming pool. Features include new interior paint, flooring, kitchen cabinets, and remodeled bathrooms. Conveniently located near freeway for easy commuting. Great opportunity! Perfect opportunity to make it your own! "Virtually staged and enhanced photos"
-
2026-03-07status Active 420-char remark
Show marketing remark (420 chars)
Enjoy community living at Corona West Mobile home Park! This updated 3-bedroom, 2 bath home is in a family friendly community offering a clubhouse and swimming pool. Features include new interior paint, flooring, kitchen cabinets, and remodeled bathrooms. Conveniently located near freeway for easy commuting. Great opportunity! Perfect opportunity to make it your own! "Virtually staged and enhanced photos"
-
2026-01-18$89,900 Active 420-char remark
Show marketing remark (420 chars)
Enjoy community living at Corona West Mobile home Park! This updated 3-bedroom, 2 bath home is in a family friendly community offering a clubhouse and swimming pool. Features include new interior paint, flooring, kitchen cabinets, and remodeled bathrooms. Conveniently located near freeway for easy commuting. Great opportunity! Perfect opportunity to make it your own! "Virtually staged and enhanced photos"
ⓘ Source: listings_history table (triggers on properties + properties_extension) + one-shot
backfill from property_details.listing_events for pre-trigger history.
Climate risk First Street
- Flood 1/10 Low FEMA zone X (shaded) · 0% chance over 30 yrs
- Wildfire 7/10 Severe
- Heat 7/10 Severe 6 d/yr ≥100°F today · 17 d/yr by 30 yrs out
- Wind 1/10 Low
- Air quality 9/10 Extreme 19 unhealthy d/yr today · 23 by 30 yrs out
Nearby sold comps map
Loading sold comps map…
Walkable amenities ~0.75 mi
Loading nearby amenities…
Taxation est. · year 1
- Rental income
- $32,573
- − Mortgage interest
- −$7,842
- − Property taxes
- −$2,100
- − Insurance
- −$700
- − Repairs & maintenance
- −$2,606
- − Management
- −$2,606
- − Depreciation
- −$4,073
- Taxable income
- $12,646
- Est. tax owed @ 24.0%
- −$3,035
- After-tax cash flow
- $11,087/yr
For passive investors: Depreciation is non-cash, so a rental often shows a tax loss while cash-flowing — sheltering income. Rental losses are passive: they offset passive income freely, and up to $25,000/yr can offset ordinary (W-2) income if you actively participate and your MAGI is under $100k (phasing out to $0 by $150k); unused losses carry forward. On sale, claimed depreciation is recaptured at up to 25%, and gains may owe capital-gains tax (a 1031 exchange can defer both). Figures are a year-1 estimate at your 24.0% rate — not tax advice; consult a CPA.
Schools (NCES district)
- District
- Corona-Norco Unified
- NCES district ID
- 0609850
- Math proficiency
- 46% ▲ 1.00%
- Reading proficiency
- 61% ▬ 0.00%
- Median HH income
- $83,380
- Composite
- 50.72/100
- National rank
- #3920
- State rank
- #312 of 1400 in CA
Livability — Corona
- Score
- 63/100
- State rank
- #461
- US rank
- #15787
Category grades
Schools grade is shown separately in the Schools card above.
Census & demographics
- Census place
- Corona, CA
- County
- Riverside County · 2,287,001 people
- City population
- 188,369
- Metro
- Riverside-San Bernardino-Ontario, CA
- Population (ZIP)
- 68,715
- Household income
- $104,457
- Rent vs Own
- Severe rent burden
- 1971.0
Population outlook (Riverside County) Hauer SSP2
- Today (2025)
- 2,664,475 people
- By 2030
- 2,802,692 · +5.2%
- By 2040
- 3,050,904 · +14.5%
- By 2050
- 3,256,783 · +22.2%
- By 2075
- 3,655,058 · +37.2%
- By 2100
- 3,766,594 · +41.4%
Race, ethnicity, and origin ACS 2023
- Neighborhood character
- Diverse neighborhood (Simpson 0.62)
- Race & ethnicity
- Hispanic / Latino 52% White 31% Two or more races 17% Asian 9% Black 4%
- Hispanic origin (detail)
- Mexican 44% Puerto Rican 1%
- Common ancestry
- Italian 4% Romanian 1% Portuguese 1%
- Foreign-born
- 24% · Canada, South Korea, China
- Languages at home
- 54% English-only · Spanish 36% Other Indo-European 3% Arabic 2%
Political lean MEDSL · Riverside
- 2024 margin
- Toss-up / Even · D 48.0% · R 49.3% · Other 2.6%
- 2008→2024 swing
- -3.6pp toward R · 2008: 2.3pp · 2024: -1.3pp
- All cycles
- 2024: R+1.3 2020: D+8.0 2016: D+4.3 2012: R+0.4 2008: D+2.3
Not yet ingested
- Civics
- —
Market trends
- HPI YoY
- ▼ -707.65%
- Current HPI
- 367.5939
- Rent YoY
- ▲ 1.45%
- Metro
- Riverside-San Bernardino-Ontario, CA
- State GDP YoY
- ▲ 3.21%
- F500 in state
- 116
Industry mix (Fortune 500 HQ in CA)
| Industry | F500 HQs | Revenue |
|---|---|---|
| Technology | 27 | $1,492B |
|
||
| Financial Services | 3 | $174B |
|
||
| Retail | 3 | $44B |
|
||
| Insurance | 3 | $26B |
|
||
| Media / Entertainment | 2 | $115B |
|
||
| Pharmaceuticals / Biotech | 2 | $62B |
|
||
Price history
+55.7% since first listed4 events — show timeline
- 2026-04-05 Relisted — CRMLS
- 2026-03-12 Price Changed $139,999 CRMLS
- 2026-03-07 Relisted — CRMLS
- 2026-01-18 Listed $89,900 CRMLS
Property tax history
-1.9%/yrLatest (2025): $143 · +4.6% YoY. Source: county tax records.
Cash-flow waterfall
monthlySold comps — $/sqft
last 12 mo · ≤1 miLoading sold comps…