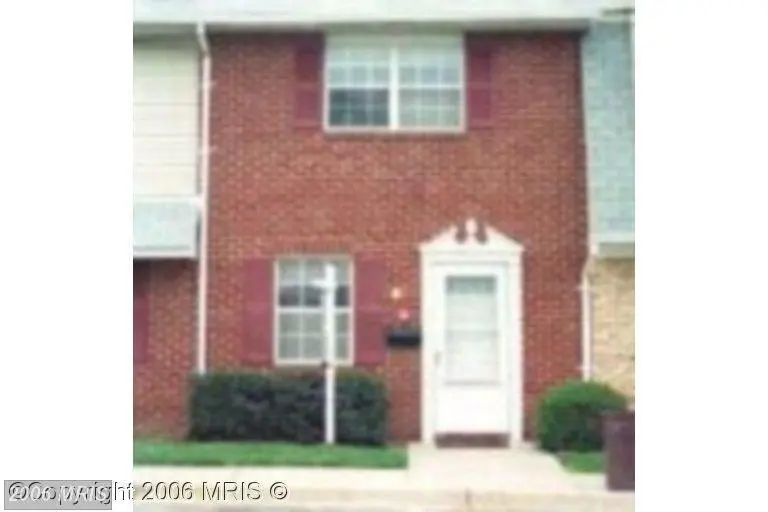
38 Heritage Ct #78 · Annapolis, MD
Flood risk 1/10 · Minimal
- FEMA flood zone
- X (unshaded)
- Chance of flooding over 30 yrs
- 0.0%
- Est. flood insurance / yr
- $507 – $1,088
Fire risk 1/10 · Minimal
- Est. fire insurance / yr
- $755 – $1,403
Heat risk 8/10 · Major
- Hot days now (above 104°F)
- 7 days/yr
- Hot days in 30 yrs
- 15 days/yr
Wind risk 6/10 · Moderate
- Chance of severe wind over 30 yrs
- 66.0%
Air-quality risk 3/10 · Minor
- Unhealthy air days now
- 3 days/yr
- Unhealthy air days in 30 yrs
- 4 days/yr
Risk factors via First Street. Map © Google.
Why this score? — see what drove the B- grade
The composite is a weighted blend of 9 inputs, each scored 0–100. Each bar is that input's sub-score; the figure is the points it added to the 100-point composite (weight × sub-score).
- Cash flow +30.0/30.0
- 1% rule +10.0/10.0
- DSCR +10.0/10.0
- ARV discount +7.5/15.0
- Livability +3.9/5.0
- Schools +2.9/10.0
- Rent growth +2.5/5.0
- Condition / age +2.5/5.0
- Appreciation +0.0/10.0
$125,000
🖨 Deal sheet 📄 Offer letter ✓ Due diligence
Listing remarks MLS
You can get 5.75% FIXED no matter what the media says! Compute the payments on this and see the benefits of owning! Conveniently located and affordably priced this 2 BR, 1.5 Bath TH features renovated kitchen & baths, newer stack W/ D & heat pump. Community features pool & lawn care in monthly fee. Close to Rt. 50 and downtown. OPEN HOUSE, SUNDAY 10/15 12-4 PM. Owner/agent.
Key facts
- $296 HOA
- Community pool
- Built 1973
Property features AI
Finance
- Other: Part of Hilltop Village Condo
- HOA & community: Monthly HOA fee; HOA amenities include an outdoor pool; HOA covers common area maintenance, front and rear lawn care, management, insurance, pool(s), reserves, and trash
Exterior
- Parking: On-street parking
- Utilities: Public water; Public sewer; Cable TV available
- Home design: Condominium interior townhouse/rowhouse; Level main entry with entry slope less than 1 foot; Brick front
- Construction: Built/majorly remodeled in 2005; Slab foundation; Asphalt roof
- Exterior features: Sidewalks; Community pool
Interior
- Kitchen: Dishwasher; Disposal; Refrigerator; Stove
- Bedrooms: Two bedrooms on the first upper level; Rooms include master bedroom and second bedroom
- Bathrooms: One full bathroom on the upper level; One half bathroom on the main level
- Heating & cooling: Heat pump heating; Central air conditioning; Electric heating and cooling; Electric hot water
- Interior features: Kitchen with country-style layout and table space; Window treatments; Traditional floor plan; Drywall walls and ceilings; Sliding glass and storm doors
- Laundry & utility: Stacked washer and dryer; Laundry room
Neighborhood map
What this means for you Summary
Snapshot
- This is a 2-bed/1.5-bath townhouse listed at $125k.
Deal economics
- At list price, monthly cash flow is $670 ($8k/yr) — positive.
- The deal already cash-flows at list — no discount required.
- Meets the 1% rule at list price ($2k rent vs $125k).
- Cap rate 12.7% vs local median 1.9% in Annapolis — top-decile yield for the area; either an underpriced asset or a hidden risk that comps aren't pricing in. Stress-test before assuming the spread holds.
Location & tenants
- Location reads 78/100 on livability (#71 in MD, #2,563 nationally) — a middle-class / working-renter tenant base. Strengths: commute A+, employment A+, health & safety A+; Watch: crime F, cost of living F.
- Anne Arundel County Public Schools (suburban): math 20% / reading 37% proficiency, ranked #10 of 24 in MD (top 42%) — low school quality limits family demand, transient renter base, plan for 1-2y turnover.
- Market conditions: Rents flat; 221 active listings in the ZIP; 22 comparable units currently listed for rent nearby; rentals at typical pace (median 24d on market — plan ~3-4 weeks tenant-placement turnaround); high-income renter base; 1,303 units permitted in Anne Arundel County in 2024 (299 in 5+ unit buildings).
Forward outlook
- Local home prices are declining (-3.0%/yr); year-one equity from $864 of loan paydown is wiped out by about $4k of value loss. Plan a longer hold.
- Anne Arundel County population projected at +17% by 2050 — long-run rental-demand tailwind backs the buy-and-hold thesis.
- At projected returns (-3.0% appreciation + 0.1% rent growth), your $35k cash investment doubles in ~7 years — after that, you're playing with house money.
Negotiation context
- Only 1 days on market — expect competitive offers; lowballing is unlikely to land.
- 4 sale attempts since 27y ago with the ask held roughly flat each time — persistent listings suggest the price (not the market) is what's stuck; bring a comps-based counter.
Risks & watch-outs
- Climate carrying-cost: major wind risk, 66% chance of damaging wind over 30y; extreme-heat days projected 7→15/yr by 2055 (HVAC capex compounding) — expect insurance premiums to compound above CPI over the hold.
Questions for the listing agent
- Built in 1973 — when were the roof, HVAC, electrical panel, plumbing, and water heater last replaced?
- What does the HOA fee cover, when was the last increase, and are there any pending special assessments or reserve-fund shortfalls?
- Is there a deadline driving the sale (1031 exchange, divorce, estate, relocation)? That informs how much negotiation room exists.
- Crime grade is F in this area — have there been break-ins, vandalism, or insurance claims at this property in the last 3 years? What carrier currently insures it and at what premium?
- What's the average days-on-market for RENTAL listings here right now (not sales)? A rising rental-DOM trend means longer vacancies and softer asking-rent achievability than the comps imply.
- What's the recent tenant-quality profile in this submarket — average credit score on applications, eviction rate, late-payment / NSF rate, and stable-employment percentage? A property-management company in the area should have these aggregated.
- How much new for-sale + rental construction is in the pipeline within 1–3 miles? Heavy new supply typically softens prices + rents 12–24 months out; constrained supply supports both.
Investment metrics
- 1% rule
- 1.85% ✓
- Cap rate
- 12.72%
- Cash-on-cash
- 22.95%
- DSCR
- 2.02
- GRM
- 4.5
CMA / ARV
- ARV (on-the-fly)
- $255,360
- Comps found
- 12
Show comp detail 12 sales within ~0.75 mi
| Address | Dist | Beds/Ba | Sqft | Sold | Price | $/sf | Match |
|---|---|---|---|---|---|---|---|
| 133 Merryman Ct #17 | 0.06mi | 2/1.5 | 960 (0%) | 1mo | $255,000 | $266 | 96 |
| 34 Heritage Ct | 0.01mi | 2/1.5 | 960 (0%) | 8mo | $260,000 | $271 | 93 |
| 128 Merryman Ct | 0.06mi | 2/1.5 | 992 (+3%) | 6mo | $255,000 | $257 | 87 |
| 115 Merryman Ct | 0.08mi | 2/1.5 | 992 (+3%) | 8mo | $245,000 | $247 | 84 |
| 44 Belle Ct | 0.46mi | 3/1.5 (+1) | 1,008 (+5%) | 0mo | $320,000 | $317 | 65 |
| 290-M Hilltop Ln | 0.63mi | 2/1.5 | 1,024 (+7%) | 7mo | $237,500 | $232 | 54 |
| 300 Hilltop Ln Unit H | 0.68mi | 2/2.0 | 1,082 (+13%) | 1mo | $270,000 | $250 | 44 |
| 304-G Hilltop Ln | 0.72mi | 2/2.0 | 1,072 (+12%) | 4mo | $285,000 | $266 | 41 |
| 1233 Gemini Dr Unit C | 0.72mi | 1/1.0 (-1) | 864 (-10%) | 2mo | $230,000 | $266 | 41 |
| 300 Hilltop Ln Unit 300K | 0.68mi | 2/2.0 | 1,085 (+13%) | 8mo | $273,400 | $252 | 38 |
| 1231 Gemini Dr Unit B | 0.71mi | 1/1.0 (-1) | 862 (-10%) | 9mo | $242,000 | $281 | 35 |
| 1233-G Gemini Dr Unit G | 0.72mi | 1/1.0 (-1) | 863 (-10%) | 9mo | $239,900 | $278 | 34 |
Match score weights: distance 35% · size 25% · config 20% · recency 20%. Top-matched comps best support the ARV.
Projected returns pro-forma
-3.0% appreciation · 0.14% rent growth · sell at horizon
- IRR
- 12.1%
- Equity multiple
- 1.46×
- Total profit
- $16,124
- Equity at exit
- $18,638
- IRR
- 18.2%
- Equity multiple
- 2.28×
- Total profit
- $44,723
- Equity at exit
- $10,808
Cash invested: $35,000 (down + closing). Projections, not guarantees.
Landlord ↔ Tenant lean methodology
- Overall (STATE)
- 27 Tenant-Leaning
- State Maryland
- 27 Tenant-Leaning · D+14
- County
- — inherits STATE
- City
- — inherits STATE
ZIP-level market 21401
- Rents YoY
- 0.1%
- Active inventory
- 221
- Price-to-rent
- 4.5×
Monthly cashflow live
- Estimated rent
- $2,316 high interval (Pro) →
- Mortgage (P&I)
- −$656
- Tax est. 1.5%
- −$156 /mo · $1,875/yr
- Insurance
- −$52
- HOA
- −$296
- Vacancy / Maint / Mgmt
- −$486
- Net cashflow
- $670
Break-even live
UW: 25.0% down · 7.5% · 30yr · 1.5% tax · 5.0% vac · 8.0% maint · 8.0% mgmt
Financing live
Cash to close
- Down payment
- $31,250
- Closing costs
- $3,750
- Reserves months
- —
- Total cash needed
- —
Loan-product check · same deal, 3 products live
Conventional
25% down · 7.5% · 30yr
- Down + closing
- —
- Monthly P&I
- —
- Monthly cashflow
- —
- DSCR
- —
- Eligible?
- —
Personal DTI + credit; lowest rate.
DSCR
20% down · 8.5% · 30yr
- Down + closing
- —
- Monthly P&I
- —
- Monthly cashflow
- —
- DSCR
- —
- Eligible?
- —
No personal income docs; deal must DSCR.
Hard money
10% down · 12.0% · 12mo
- Down + closing
- —
- Monthly P&I
- —
- Monthly cashflow
- —
- DSCR
- —
- Eligible?
- —
Short-term bridge; refi at stabilization.
Rent comps 22 comps
| Address | Beds | Baths | Sqft | Rent | $/sqft | DOM | Units | Dist |
|---|---|---|---|---|---|---|---|---|
| 67 Heritage Ct Annapolis, MD | 2.0 | 1.5 | 1000 | $2,150 | $2.15 | 14d | 1 | 0.01mi |
| 7 Heritage Ct #120 Annapolis, MD | 2.0 | 1.5 | 960 | $1,895 | $1.97 | 43d | 1 | 0.09mi |
| 1029 Spa Rd Annapolis, MD | 1.0–2.0 | 1.0–2.0 | 835 | $2,415 | $2.89 | 2d | 12 | 0.13mi |
| 988 Spa Rd Annapolis, MD | 1.0–2.0 | 1.0–2.0 | 679 | $2,800 | $4.12 | 1d | 12 | 0.22mi |
| 230 Hilltop Ln Annapolis, MD | 1.0–2.0 | 1.0 | 692 | $2,316 | $3.35 | 3d | 6 | 0.38mi |
| 721 S Cherry Grove Ave Annapolis, MD | 1.0–3.0 | 1.0–2.0 | 1055 | $2,750 | $2.61 | 1d | 27 | 0.49mi |
| 8 Johnson Pl Annapolis, MD | 2.0 | 1.5 | 900 | $2,295 | $2.55 | 43d | 1 | 0.55mi |
| 1225 Gemini Dr Unit B Annapolis, MD | 1.0 | 1.0 | 865 | $1,950 | $2.25 | 24d | 1 | 0.66mi |
| 302 Hilltop Ln Annapolis, MD | 2.0 | 2.0 | 1205 | $2,422 | $2.01 | 5d | 2 | 0.68mi |
| 5 Park Pl #710 Annapolis, MD | 1.0 | 1.0 | 991 | $3,200 | $3.23 | 24d | 1 | 0.85mi |
| 1115 Primrose Ct #101 Annapolis, MD | 2.0 | 2.0 | 1014 | $2,400 | $2.37 | 43d | 1 | 0.86mi |
| 1012 Primrose Rd Annapolis, MD | 1.0–2.0 | 1.0–2.0 | 921 | $2,152 | $2.34 | 1d | 8 | 0.89mi |
| 11 Spa Creek Lndg Annapolis, MD | 1.0 | 2.0 | 1000 | $3,195 | $3.19 | 24d | 1 | 0.97mi |
| 714 Rosedale St Unit A Annapolis, MD | 1.0 | 1.0 | 600 | $2,400 | $4.00 | 43d | 1 | 0.99mi |
| 701 Glenwood St Annapolis, MD | 2.0 | 1.0 | 623 | $1,703 | $2.73 | 43d | 1 | 1.04mi |
| 1 Murray Ave Unit 2 Annapolis, MD | 1.0 | 1.0 | 800 | $1,750 | $2.19 | 43d | 1 | 1.10mi |
| 1900 Center St Annapolis, MD | 3.0 | 1.0–2.5 | 1051 | $4,813 | $4.58 | 16d | 1 | 1.17mi |
| 63 Town Pines Ct Annapolis, MD | 3.0 | 1.5 | 1037 | $2,500 | $2.41 | 43d | 1 | 1.18mi |
| 81 Conduit St Annapolis, MD | 2.0 | 1.5 | 1040 | $3,150 | $3.03 | 43d | 1 | 1.30mi |
| 1303 Bay Ridge Ave Annapolis, MD | 2.0 | 1.0 | 768 | $2,700 | $3.52 | 16d | 1 | 1.44mi |
| 23 Francis St Annapolis, MD | 3.0 | 1.0 | 750 | $2,265 | $3.02 | 24d | 1 | 1.49mi |
| 1293 Thom Ct Annapolis, MD | 1.0–2.0 | 1.0 | 757 | $1,995 | $2.63 | 1d | 26 | 1.50mi |
HOA detail
- Monthly dues
- $296 · $3,552/yr
- Likely covers
- landscapingpool
Listing history 4 events
-
2026-06-10status $125,000 Pending 1 DOM
-
2026-06-09remarks 312-char remark
-
2026-06-08remarks 234-char remark
-
2026-06-08$125,000 Active 1 DOM
ⓘ Source: listings_history table (triggers on properties + properties_extension) + one-shot
backfill from property_details.listing_events for pre-trigger history.
Climate risk First Street
- Flood 1/10 Low FEMA zone X (unshaded) · 0% chance over 30 yrs
- Wildfire 1/10 Low
- Heat 8/10 Severe 7 d/yr ≥104°F today · 15 d/yr by 30 yrs out
- Wind 6/10 Major 66% chance of damaging wind over 30 yrs
- Air quality 3/10 Moderate 3 unhealthy d/yr today · 4 by 30 yrs out
Nearby sold comps map
Loading sold comps map…
Walkable amenities ~0.75 mi
Loading nearby amenities…
Taxation est. · year 1
- Rental income
- $27,788
- − Mortgage interest
- −$7,002
- − Property taxes
- −$1,875
- − Insurance
- −$625
- − Repairs & maintenance
- −$2,223
- − Management
- −$2,223
- − HOA
- −$3,552
- − Depreciation
- −$3,636
- Taxable income
- $6,651
- Est. tax owed @ 24.0%
- −$1,596
- After-tax cash flow
- $6,438/yr
For passive investors: Depreciation is non-cash, so a rental often shows a tax loss while cash-flowing — sheltering income. Rental losses are passive: they offset passive income freely, and up to $25,000/yr can offset ordinary (W-2) income if you actively participate and your MAGI is under $100k (phasing out to $0 by $150k); unused losses carry forward. On sale, claimed depreciation is recaptured at up to 25%, and gains may owe capital-gains tax (a 1031 exchange can defer both). Figures are a year-1 estimate at your 24.0% rate — not tax advice; consult a CPA.
Schools (NCES district)
- District
- Anne Arundel County Public Schools
- NCES district ID
- 2400060
- Math proficiency
- 20% ▼ -21.00%
- Reading proficiency
- 37% ▼ -13.00%
- Median HH income
- $87,880
- Composite
- 28.52/100
- National rank
- #6733
- State rank
- #10 of 24 in MD
Livability — Annapolis
- Score
- 78/100
- State rank
- #71
- US rank
- #2563
Category grades
Schools grade is shown separately in the Schools card above.
Census & demographics
- Census place
- Annapolis, MD
- County
- Anne Arundel County · 535,653 people
- City population
- 91,599
- Metro
- Baltimore-Columbia-Towson, MD
- Population (ZIP)
- 38,629
- Household income
- $123,381
- Rent vs Own
- Severe rent burden
- 1158.0
Population outlook (Anne Arundel County) Hauer SSP2
- Today (2025)
- 617,384 people
- By 2030
- 642,094 · +4.0%
- By 2040
- 686,621 · +11.2%
- By 2050
- 723,031 · +17.1%
- By 2075
- 809,346 · +31.1%
- By 2100
- 837,658 · +35.7%
Race, ethnicity, and origin ACS 2023
- Neighborhood character
- Predominantly White (69%)
- Race & ethnicity
- White 69% Black 15% Hispanic / Latino 9% Two or more races 6% Asian 4%
- Hispanic origin (detail)
- Mexican 2%
- Common ancestry
- Romanian 3% Slovak 3% Italian 2%
- Foreign-born
- 9% · Canada, Jamaica
- Languages at home
- 87% English-only · Spanish 5% Tagalog/Filipino 2% Other Indo-European 1%
Political lean MEDSL · Anne Arundel
- 2024 margin
- D (+13.9) · D 55.7% · R 41.7% · Other 2.6%
- 2008→2024 swing
- +15.7pp toward D · 2008: -1.8pp · 2024: 13.9pp
- All cycles
- 2024: D+13.9 2020: D+14.5 2016: D+0.7 2012: R+0.9 2008: R+1.8
Not yet ingested
- Civics
- —
Market trends
- HPI YoY
- ▼ -498.22%
- Current HPI
- 297.4285
- Rent YoY
- ▲ 0.14%
- Metro
- Baltimore-Columbia-Towson, MD
- State GDP YoY
- ▲ 2.97%
- F500 in state
- 12
Industry mix (Fortune 500 HQ in MD)
| Industry | F500 HQs | Revenue |
|---|---|---|
| Aerospace / Defense | 1 | $71B |
|
||
| Utilities | 1 | $25B |
|
||
| Hotels | 1 | $24B |
|
||
| Consumer Goods | 1 | $7B |
|
||
| Real Estate | 1 | $6B |
|
||
| Chemicals | 1 | $2B |
|
||
Price history
+66.9% since first listed10 events — show timeline
- 2026-06-08 Listed $125,000 BRIGHT MLS
- 2006-11-30 Sold (MLS) $225,000 MRIS
- 2006-10-21 Delisted — MRIS
- 2006-10-02 Listed $225,000 MRIS
- 2005-11-10 Sold (MLS) $199,000 MRIS
- 2005-09-27 Delisted — MRIS
- 2005-09-20 Listed $197,000 MRIS
- 1999-08-23 Sold (MLS) $74,900 MRIS
- 1999-05-25 Delisted — MRIS
- 1999-05-04 Listed $74,900 MRIS
Cash-flow waterfall
monthlySold comps — $/sqft
last 12 mo · ≤1 miLoading sold comps…