515 Townsford Ln · Moncks Corner, SC
Flood risk 7/10 · Major
- FEMA flood zone
- AE
- Chance of flooding over 30 yrs
- 0.99%
- Est. flood insurance / yr
- $1,737 – $8,500
Fire risk 5/10 · Moderate
- Est. fire insurance / yr
- $783 – $1,453
Heat risk 8/10 · Major
- Hot days now (above 109°F)
- 7 days/yr
- Hot days in 30 yrs
- 16 days/yr
Wind risk 8/10 · Major
- Chance of severe wind over 30 yrs
- 95.0%
Air-quality risk 2/10 · Minimal
- Unhealthy air days now
- 2 days/yr
- Unhealthy air days in 30 yrs
- 2 days/yr
Risk factors via First Street. Map © Google.
Why this score? — see what drove the C- grade
The composite is a weighted blend of 9 inputs, each scored 0–100. Each bar is that input's sub-score; the figure is the points it added to the 100-point composite (weight × sub-score).
- Cash flow +20.1/30.0
- ARV discount +7.5/15.0
- DSCR +6.4/10.0
- 1% rule +5.1/10.0
- Schools +3.6/10.0
- Livability +3.4/5.0
- Rent growth +3.2/5.0
- Condition / age +2.5/5.0
- Appreciation +0.0/10.0
$219,990
🖨 Deal sheet 📄 Offer letter ✓ Due diligence
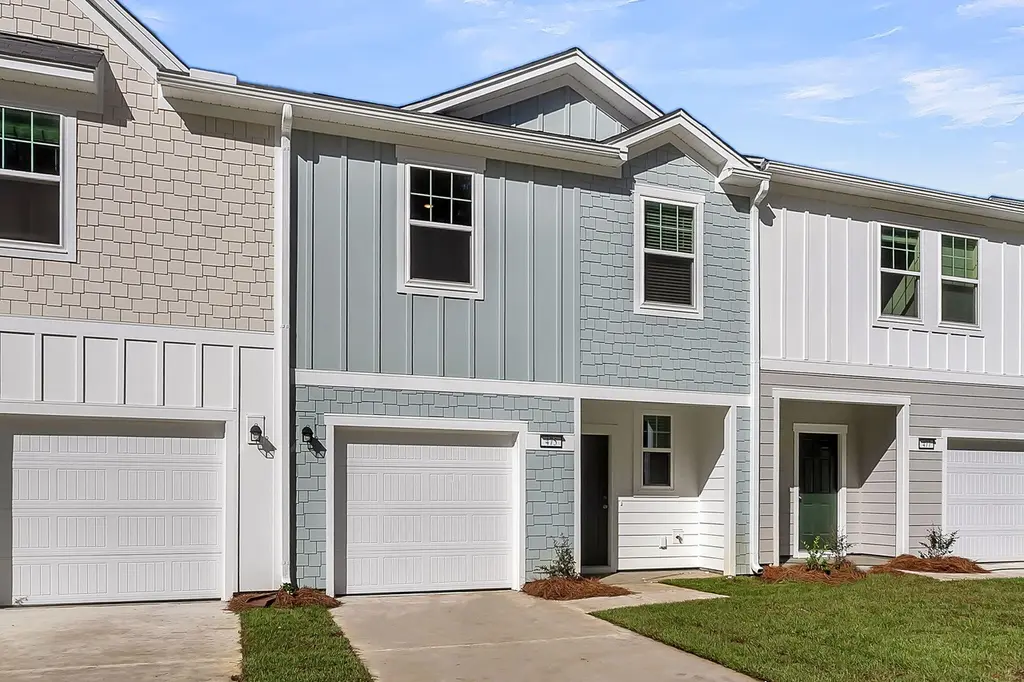
Listing remarks
ALL APPLIANCES INCLUDED! Ask about our Down Payment Assistance Program! Welcome home to the Pulsar! This beautifully designed 3 bedroom, 2.5 bath townhome offers modern finishes and low-maintenance living. Enjoy granite countertops and luxury vinyl plank flooring throughout the main living areas, laundry room, and all bathrooms. The open layout is perfect for everyday living and entertaining, and the home includes an attached one-car garage for added convenience. Thoughtful details and quality finishes are found throughout. Please see the on-site agent for full details. Sales office located at 901 Wicksford Place, Moncks Corner.
Key facts
- Open layout
- Granite countertops
- $158 HOA
Tags
Property features AI
Finance
- HOA & community: Monthly HOA fee; HOA fee: $158; Community amenities: dog park, park, walk/jog trails
Exterior
- Parking: Attached 1-car garage
- Utilities: Public sewer; BCW & SA water; Berkeley Electric Cooperative power
- Home design: Residential single-family attached (townhouse); Two levels; New construction
- Construction: Townhouse construction
- Exterior features: Architectural roof; Lot size under 0.5 acre; No other structures
Interior
- Kitchen: Electric range; Self-cleaning oven; Microwave; Dishwasher; Disposal; Refrigerator
- Bedrooms: 3 bedrooms; Primary bedroom on upper level with walk-in closet
- Flooring: Carpet; Luxury vinyl
- Bathrooms: 2.5 bathrooms
- Heating & cooling: Central heating; Central air conditioning
- Interior features: Smooth ceilings; High ceilings; Walk-in closet(s); Living/dining combo
- Laundry & utility: Washer; Dryer
Neighborhood map
What this means for you Summary
Snapshot
- This is a 3-bed/2.5-bath land listed at $220k.
Deal economics
- At list price, monthly cash flow is $-154 ($-2k/yr) — negative.
- To cash-flow at today's rent, offer at most $193k (12.3% below list).
- Meets the 1% rule at list price ($2k rent vs $220k).
- Recommended offer: $193k (12.3% below list) — sets the bar for cash-flow.
- Cap rate 7.8% vs local median 4.3% in Moncks Corner — top-decile yield for the area; either an underpriced asset or a hidden risk that comps aren't pricing in. Stress-test before assuming the spread holds.
Location & tenants
- Location reads 67/100 on livability (#99 in SC) — a middle-class / working-renter tenant base. Strengths: housing A+, health & safety A+, cost of living A; Watch: crime C-, amenities F, commute F.
- Berkeley 01 (suburban): math 35% / reading 48% proficiency, ranked #30 of 80 in SC (top 38%) — families likely to look elsewhere, expect single-tenant / working-renter base with shorter leases.
- Zoned schools: Whitesville Elementary (math 34% / reading 39%, grade F, #328 of 597 statewide, top 55%, 1,031 students, 62% FRL); Berkeley Middle (math 19% / reading 32%, grade F, #162 of 229 statewide, top 71%, 1,403 students, 57% FRL); Berkeley High (math 36% / reading 83%, grade C+, #110 of 196 statewide, top 58%, 1,776 students, 50% FRL).
- Market conditions: Rents rising (+2.8%/yr); 642 active listings in the ZIP; 3 comparable units currently listed for rent nearby; rentals at typical pace (median 14d on market — plan ~3-4 weeks tenant-placement turnaround); solid renter incomes; 3,183 units permitted in Berkeley County in 2024 (580 in 5+ unit buildings).
- This rent runs 32% of the median local income ($83k/yr) — at the standard rent-burdened threshold; future hikes will face affordability resistance.
Forward outlook
- Local home prices are declining (-3.0%/yr); year-one equity from $2k of loan paydown is wiped out by about $7k of value loss. Plan a longer hold.
- Berkeley County population projected at +48% by 2050 — long-run rental-demand tailwind backs the buy-and-hold thesis.
Negotiation context
- It's been on market 57 days — a 3% lower offer ($213k) is reasonable based on typical stale-listing flexibility.
Risks & watch-outs
- Watch-outs: flood insurance adds $427/mo.
- Climate carrying-cost: in FEMA flood zone AE (mandatory federal flood insurance); severe wind risk, 95% chance of damaging wind over 30y; moderate wildfire risk; extreme-heat days projected 7→16/yr by 2055 (HVAC capex compounding) — expect insurance premiums to compound above CPI over the hold.
Questions for the listing agent
- What do current leases actually rent for vs. the listed asking? Can we see a recent rent roll and the last 12 months of T-12 income?
- It's been on market 57 days. Have you received any prior offers? Is the seller open to a 12% concession, seller financing, or rate buy-down credit?
- What's the actual annual flood-insurance premium (NFIP or private), and is the property in a SFHA with mandatory coverage?
- What does the HOA fee cover, when was the last increase, and are there any pending special assessments or reserve-fund shortfalls?
- Is there a deadline driving the sale (1031 exchange, divorce, estate, relocation)? That informs how much negotiation room exists.
- Schools are D-rated, which usually means shorter tenancies and higher turnover. Who's the typical renter profile here, and what's been the actual vacancy rate?
- What's the average days-on-market for RENTAL listings here right now (not sales)? A rising rental-DOM trend means longer vacancies and softer asking-rent achievability than the comps imply.
- What's the recent tenant-quality profile in this submarket — average credit score on applications, eviction rate, late-payment / NSF rate, and stable-employment percentage? A property-management company in the area should have these aggregated.
- How much new for-sale + rental construction is in the pipeline within 1–3 miles? Heavy new supply typically softens prices + rents 12–24 months out; constrained supply supports both.
Investment metrics
- 1% rule
- 1.01% ✓
- Cap rate
- 7.78%
- Cash-on-cash
- 5.32%
- DSCR
- 1.24
- GRM
- 8.2
CMA / ARV
No comps found within radius.
Projected returns pro-forma
-3.0% appreciation · 2.77% rent growth · sell at horizon
- IRR
- -21.5%
- Equity multiple
- 0.26×
- Total profit
- $-45,676
- Equity at exit
- $32,801
- IRR
- -15.4%
- Equity multiple
- 0.13×
- Total profit
- $-53,364
- Equity at exit
- $19,021
Cash invested: $61,597 (down + closing). Projections, not guarantees.
Landlord ↔ Tenant lean methodology
- Overall (STATE)
- 90 Strongly Landlord-Friendly
- State South Carolina
- 90 Strongly Landlord-Friendly · R+6
- County
- — inherits STATE
- City
- — inherits STATE
ZIP-level market 29461
- Home prices YoY
- -13.9%
- Rents YoY
- 2.8%
- Active inventory
- 642
- Price-to-rent
- 8.2×
Monthly cashflow live
- Estimated rent
- $2,225 medium interval (Pro) →
- Mortgage (P&I)
- −$1,154
- Tax from tax record
- −$82 /mo · $980/yr
- Insurance
- −$92
- Flood insurance flood zone
- −$427 /mo · $5,118/yr
- HOA
- −$158
- Vacancy / Maint / Mgmt
- −$467
- Net cashflow
- $-154
Break-even live
UW: 25.0% down · 7.5% · 30yr · 1.5% tax · 5.0% vac · 8.0% maint · 8.0% mgmt
Financing live
Cash to close
- Down payment
- $54,998
- Closing costs
- $6,600
- Reserves months
- —
- Total cash needed
- —
Loan-product check · same deal, 3 products live
Conventional
25% down · 7.5% · 30yr
- Down + closing
- —
- Monthly P&I
- —
- Monthly cashflow
- —
- DSCR
- —
- Eligible?
- —
Personal DTI + credit; lowest rate.
DSCR
20% down · 8.5% · 30yr
- Down + closing
- —
- Monthly P&I
- —
- Monthly cashflow
- —
- DSCR
- —
- Eligible?
- —
No personal income docs; deal must DSCR.
Hard money
10% down · 12.0% · 12mo
- Down + closing
- —
- Monthly P&I
- —
- Monthly cashflow
- —
- DSCR
- —
- Eligible?
- —
Short-term bridge; refi at stabilization.
Rent comps 3 comps
| Address | Beds | Baths | Sqft | Rent | $/sqft | DOM | Units | Dist |
|---|---|---|---|---|---|---|---|---|
| 502 Townsford Ln Moncks Corner, SC | 3.0 | 2.5 | 1386 | $2,095 | $1.51 | 2d | 1 | 0.04mi |
| 480 Colchester Ct Moncks Corner, SC | 3.0 | 2.5 | 1386 | $1,975 | $1.42 | 14d | 1 | 0.05mi |
| 1226 State Road S-8-806 Unit Back Moncks Corner, SC | 2.0 | 1.5 | 1250 | $1,750 | $1.40 | 23d | 1 | 1.33mi |
HOA detail
- Monthly dues
- $158 · $1,896/yr
Listing history 5 events
-
2026-05-18price $219,990
-
2026-05-11price $229,990
-
2026-05-05price $239,990
-
2026-04-10price $249,990
-
2026-04-01$259,990 Active
ⓘ Source: listings_history table (triggers on properties + properties_extension) + one-shot
backfill from property_details.listing_events for pre-trigger history.
Tax reassessment forecast SC · Resets to sale price
- Current annual tax
- $980 · $82/mo
- Projected year-2 tax
- $1,254 · $104/mo
- Expected delta
- +$274/yr (+$23/mo · 28.0%)
ⓘ Screening estimate from a state-policy table — verify with the county assessor before closing.
Climate risk First Street
- Flood 7/10 Severe FEMA zone AE · 99% chance over 30 yrs
- Wildfire 5/10 Major
- Heat 8/10 Severe 7 d/yr ≥109°F today · 16 d/yr by 30 yrs out
- Wind 8/10 Severe 95% chance of damaging wind over 30 yrs
- Air quality 2/10 Low 2 unhealthy d/yr today · 2 by 30 yrs out
Nearby sold comps map
Loading sold comps map…
Walkable amenities ~0.75 mi
Loading nearby amenities…
Taxation est. · year 1
- Rental income
- $26,701
- − Mortgage interest
- −$12,323
- − Property taxes
- −$980
- − Insurance
- −$6,218
- − Repairs & maintenance
- −$2,136
- − Management
- −$2,136
- − HOA
- −$1,896
- − Depreciation
- −$6,400
- Taxable loss
- −$5,388
- Est. tax savings @ 24.0%
- +$1,293
- After-tax cash flow
- $-551/yr
For passive investors: Depreciation is non-cash, so a rental often shows a tax loss while cash-flowing — sheltering income. Rental losses are passive: they offset passive income freely, and up to $25,000/yr can offset ordinary (W-2) income if you actively participate and your MAGI is under $100k (phasing out to $0 by $150k); unused losses carry forward. On sale, claimed depreciation is recaptured at up to 25%, and gains may owe capital-gains tax (a 1031 exchange can defer both). Figures are a year-1 estimate at your 24.0% rate — not tax advice; consult a CPA.
Schools (NCES district)
- District
- Berkeley 01
- NCES district ID
- 4501170
- Math proficiency
- 35% ▼ -8.00%
- Reading proficiency
- 48% ▼ -2.00%
- Median HH income
- $52,724
- Composite
- 35.95/100
- National rank
- #4799
- State rank
- #30 of 80 in SC
Livability — Moncks Corner
- Score
- 67/100
- State rank
- #99
- US rank
- #10812
Category grades
Schools grade is shown separately in the Schools card above.
Census & demographics
- Census place
- Moncks Corner, SC
- County
- Berkeley County · 198,768 people
- City population
- 43,816
- Metro
- Charleston-North Charleston, SC
- Population (ZIP)
- 43,816
- Household income
- $82,666
- Rent vs Own
- Severe rent burden
- 815.0
Population outlook (Berkeley County) Hauer SSP2
- Today (2025)
- 254,184 people
- By 2030
- 279,677 · +10.0%
- By 2040
- 329,379 · +29.6%
- By 2050
- 375,557 · +47.8%
- By 2075
- 476,740 · +87.6%
- By 2100
- 535,945 · +110.8%
Race, ethnicity, and origin ACS 2023
- Neighborhood character
- Majority White (61%)
- Race & ethnicity
- White 61% Black 29% Hispanic / Latino 6% Two or more races 5%
- Hispanic origin (detail)
- Mexican 2% Puerto Rican 2%
- Common ancestry
- Lithuanian 1% Slovak 1% Romanian 1%
- Foreign-born
- 3% · Canada
- Languages at home
- 96% English-only · Spanish 3%
Political lean MEDSL · Berkeley
- 2024 margin
- R (+16.3) · D 41.1% · R 57.4% · Other 1.4%
- 2008→2024 swing
- -3.2pp toward R · 2008: -13.1pp · 2024: -16.3pp
- All cycles
- 2024: R+16.3 2020: R+11.7 2016: R+17.4 2012: R+18.9 2008: R+13.1
Not yet ingested
- Civics
- —
Market trends
- HPI YoY
- ▼ -52.95%
- Current HPI
- 328.7212
- Rent YoY
- ▲ 2.77%
- Metro
- Charleston-North Charleston, SC
- State GDP YoY
- ▲ 4.51%
- F500 in state
- 2
Industry mix (Fortune 500 HQ in SC)
| Industry | F500 HQs | Revenue |
|---|---|---|
| Packaging | 1 | $7B |
|
||
Price history
-15.4% since first listed5 events — show timeline
- 2026-05-18 Price Changed $219,990 Charleston Trident MLS
- 2026-05-11 Price Changed $229,990 Charleston Trident MLS
- 2026-05-05 Price Changed $239,990 Charleston Trident MLS
- 2026-04-10 Price Changed $249,990 Charleston Trident MLS
- 2026-04-01 Listed $259,990 Charleston Trident MLS
Cash-flow waterfall
monthlySold comps — $/sqft
last 12 mo · ≤1 miLoading sold comps…