 🏷️ Likely Rental
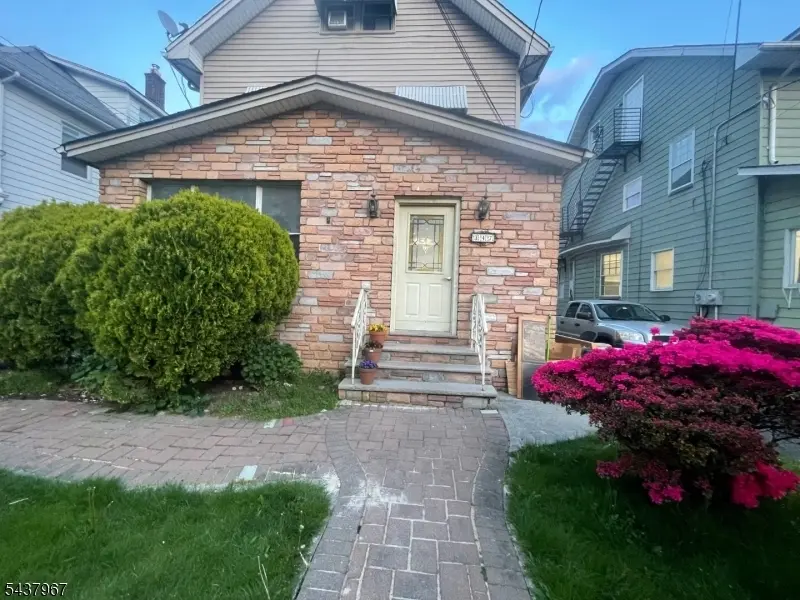
347 Elmora Ave · Elizabeth, NJ
Flood risk 1/10 · Minimal
- FEMA flood zone
- X (unshaded)
- Chance of flooding over 30 yrs
- 0.0%
- Est. flood insurance / yr
- $507 – $1,088
Fire risk 1/10 · Minimal
- Est. fire insurance / yr
- $526 – $976
Heat risk 7/10 · Major
- Hot days now (above 101°F)
- 7 days/yr
- Hot days in 30 yrs
- 15 days/yr
Wind risk 6/10 · Moderate
- Chance of severe wind over 30 yrs
- 27.0%
Air-quality risk 4/10 · Minor
- Unhealthy air days now
- 4 days/yr
- Unhealthy air days in 30 yrs
- 5 days/yr
Risk factors via First Street. Map © Google.
Why this score? — see what drove the D grade
The composite is a weighted blend of 9 inputs, each scored 0–100. Each bar is that input's sub-score; the figure is the points it added to the 100-point composite (weight × sub-score).
- Cash flow +15.0/30.0
- ARV discount +7.5/15.0
- 1% rule +5.0/10.0
- DSCR +5.0/10.0
- Livability +3.5/5.0
- Rent growth +2.5/5.0
- Condition / age +2.5/5.0
- Schools +1.8/10.0
- Appreciation +0.0/10.0
$2,400
🖨 Deal sheet 📄 Offer letter ✓ Due diligence
Multi-family units
County records classify this as Multi-Family (2-4 Unit). Listing-text estimate: 1 unit. estimate disagrees with records
Listing remarks
Great and bright 2nd floor unitl, 3 oversized rooms with closet space, 1 full bath, living room. eat in kitchen, utilities separated, not parking space, washer & dryer machines in the unit. Owner requires NTN Report, proof of Income, credit verification & tenant application.
Key facts
- 3,920 sq ft lot
Property features AI
Finance
- Other: Unit 1: tenant pays water; Unit 2: owner pays water; tenant pays electric, gas, and heat; Unit 2 security deposit listed as $2,400
- Financial info: Two-unit property; Reported net operating income, gross operating income, and operating expenses listed as $0
Exterior
- Parking: Off-street parking; No garage
- Utilities: Public water; Public sewer; All utilities are underground
- Home design: Two-story unit style
- Construction: Aluminum siding construction; Asphalt shingle roof
- Exterior features: Aluminum siding; Asphalt shingle roof; All underground utilities
Interior
- Kitchen: Eat-in kitchen (Unit 2); Additional kitchen in Unit 2
- Bedrooms: Unit 2 has 3 bedrooms
- Bathrooms: 1 full bathroom (total)
- Heating & cooling: Three separate heating units; Hot water baseboard heating fueled by natural gas; Window A/C units
- Interior features: Unfinished basement; Has basement; See remarks for additional unit details
- Laundry & utility: Washer and dryer included in Unit 2; Carbon monoxide detector (Unit 2)
Neighborhood map
What this means for you Summary
Snapshot
- This is a 3-bed/1.0-bath multifamily listed at $2k.
Deal economics
- At list price, monthly cash flow is $4k ($45k/yr) — positive.
- The deal already cash-flows at list — no discount required.
- Meets the 1% rule at list price ($5k rent vs $2k).
- Cap rate 1899.9% vs local median 2.4% in Elizabeth — top-decile yield for the area; either an underpriced asset or a hidden risk that comps aren't pricing in. Stress-test before assuming the spread holds.
Location & tenants
- Location reads 69/100 on livability (#277 in NJ) — a middle-class / working-renter tenant base. Strengths: commute A+, health & safety B+; Watch: amenities D+, schools D-, crime D-.
- Elizabeth Public Schools (suburban): math 9% / reading 33% proficiency, ranked #430 of 472 in NJ (top 91%) — low school quality limits family demand, transient renter base, plan for 1-2y turnover; 74% free/reduced lunch — lower-income household profile, screen leases tightly.
- Market conditions: 15 active listings in the ZIP; 40 comparable units currently listed for rent nearby; rentals at typical pace (median 25d on market — plan ~3-4 weeks tenant-placement turnaround); 1,749 units permitted in Union County in 2024 (1,421 in 5+ unit buildings).
Forward outlook
- Local home prices are declining (-3.0%/yr); year-one equity from $17 of loan paydown is wiped out by about $72 of value loss. Plan a longer hold.
- Union County population projected at +17% by 2050 — long-run rental-demand tailwind backs the buy-and-hold thesis.
- At projected returns (-3.0% appreciation + 3.0% rent growth), your $672 cash investment doubles in ~1 year — after that, you're playing with house money.
Negotiation context
- Only 1 days on market — expect competitive offers; lowballing is unlikely to land.
Risks & watch-outs
- Climate carrying-cost: major wind risk, 27% chance of damaging wind over 30y; extreme-heat days projected 7→15/yr by 2055 (HVAC capex compounding) — expect insurance premiums to compound above CPI over the hold.
Questions for the listing agent
- Is there a deadline driving the sale (1031 exchange, divorce, estate, relocation)? That informs how much negotiation room exists.
- Schools are D-rated, which usually means shorter tenancies and higher turnover. Who's the typical renter profile here, and what's been the actual vacancy rate?
- Crime grade is D in this area — have there been break-ins, vandalism, or insurance claims at this property in the last 3 years? What carrier currently insures it and at what premium?
- The area grade is low — what's the realistic commute time and amenity access for the typical tenant pool here? Any planned neighborhood developments (good or bad) we should know about?
- What's the average days-on-market for RENTAL listings here right now (not sales)? A rising rental-DOM trend means longer vacancies and softer asking-rent achievability than the comps imply.
- What's the recent tenant-quality profile in this submarket — average credit score on applications, eviction rate, late-payment / NSF rate, and stable-employment percentage? A property-management company in the area should have these aggregated.
- How much new apartment / multifamily construction is in the pipeline within 1–3 miles? Heavy new supply (>2% of stock underway) typically softens rents 12–24 months out; light construction supports rent growth.
Investment metrics
- 1% rule
- 200.62% ✓
- Cap rate
- 1899.92%
- Cash-on-cash
- 6762.97%
- DSCR
- 301.91
- GRM
- 0.0
CMA / ARV
No comps found within radius.
Show comp detail 1 sale within ~0.75 mi
| Address | Dist | Beds/Ba | Sqft | Sold | Price | $/sf | Match |
|---|---|---|---|---|---|---|---|
| 125 Alton St | 0.45mi | 4/2.0 (+1) | 2,755 | 13mo | $600,000 | $218 | 47 |
Match score weights: distance 35% · size 25% · config 20% · recency 20%. Top-matched comps best support the ARV.
Projected returns pro-forma
-3.0% appreciation · 3.0% rent growth · sell at horizon
- IRR
- —
- Equity multiple
- 359.48×
- Total profit
- $240,897
- Equity at exit
- $358
- IRR
- —
- Equity multiple
- 775.80×
- Total profit
- $520,664
- Equity at exit
- $208
Cash invested: $672 (down + closing). Projections, not guarantees.
Landlord ↔ Tenant lean methodology
- Overall (STATE)
- 21 Tenant-Leaning
- State New Jersey
- 21 Tenant-Leaning · D+6
- County
- — inherits STATE
- City
- — inherits STATE
ZIP-level market 07208
- Active inventory
- 15
- Price-to-rent
- 0.1×
Monthly cashflow live
- Estimated rent
- $4,815 high interval (Pro) →
- Mortgage (P&I)
- −$13
- Tax est. 1.5%
- −$3 /mo · $36/yr
- Insurance
- −$1
- HOA
- −$0
- Vacancy / Maint / Mgmt
- −$1,011
- Net cashflow
- $3,787
Break-even live
2-unit breakdown (identical units grouped — click to expand)
| Units | Beds | Baths | Est. rent |
|---|---|---|---|
| 2× units | 3 | 1 | $4,816 |
| #1 | 3 | 1 | $2,408 |
| #2 | 3 | 1 | $2,408 |
| Total (2 units) | $4,815 | ||
UW: 25.0% down · 7.5% · 30yr · 1.5% tax · 5.0% vac · 8.0% maint · 8.0% mgmt
Financing live
Cash to close
- Down payment
- $600
- Closing costs
- $72
- Reserves months
- —
- Total cash needed
- —
Loan-product check · same deal, 3 products live
Conventional
25% down · 7.5% · 30yr
- Down + closing
- —
- Monthly P&I
- —
- Monthly cashflow
- —
- DSCR
- —
- Eligible?
- —
Personal DTI + credit; lowest rate.
DSCR
20% down · 8.5% · 30yr
- Down + closing
- —
- Monthly P&I
- —
- Monthly cashflow
- —
- DSCR
- —
- Eligible?
- —
No personal income docs; deal must DSCR.
Hard money
10% down · 12.0% · 12mo
- Down + closing
- —
- Monthly P&I
- —
- Monthly cashflow
- —
- DSCR
- —
- Eligible?
- —
Short-term bridge; refi at stabilization.
Rent comps 40 comps
| Address | Beds | Baths | Sqft | Rent | $/sqft | DOM | Units | Dist |
|---|---|---|---|---|---|---|---|---|
| 331 Elmora Ave Elizabeth, NJ | 2.0 | — | — | $2,200 | — | 1d | 2 | 0.04mi |
| 350 Elmora Ave Elizabeth, NJ | 2.0 | 1.0 | — | $2,200 | — | 6d | 1 | 0.06mi |
| 350 Elmora Ave Unit F Elizabeth, NJ | 2.0 | 2.0 | — | $2,200 | — | 20d | 1 | 0.06mi |
| 521 Pennington St Elizabeth, NJ | 3.0 | 1.0 | — | $2,300 | — | 2d | 1 | 0.26mi |
| 710 Westfield Ave Elizabeth, NJ | 3.0 | 1.0 | — | $2,400 | — | 15d | 1 | 0.29mi |
| 720 Westfield Ave Unit CC2 Elizabeth, NJ | 3.0 | 1.0 | — | $2,350 | — | 20d | 1 | 0.31mi |
| 725 Westfield Ave Unit 1 Elizabeth, NJ | 3.0 | 1.5 | 2000 | $4,500 | $2.25 | 1d | 1 | 0.33mi |
| 734 Pennington St Elizabeth, NJ | 3.0 | 1.0 | — | $2,600 | — | 7d | 1 | 0.34mi |
| 160 Elm St Elizabeth, NJ | 3.0 | 1.0 | — | $2,500 | — | 14d | 1 | 0.40mi |
| 212 Westfield Ave Elizabeth, NJ | 3.0 | 1.0 | 900 | $2,998 | $3.33 | 7d | 1 | 0.42mi |
| 125 Alton St Elizabeth, NJ | 3.0 | 1.5 | — | $2,400 | — | 24d | 1 | 0.43mi |
| 854 W Grand St Elizabeth, NJ | 2.0 | 1.0 | 850 | $2,400 | $2.82 | 21d | 1 | 0.43mi |
| 144 Bellevue St Unit 1 Elizabeth, NJ | 3.0 | 1.0 | — | $2,500 | — | 24d | 1 | 0.48mi |
| 854 Pennington St Unit 2L Elizabeth, NJ | 2.0 | 1.0 | — | $2,400 | — | 24d | 1 | 0.48mi |
| 849 Jersey Ave Unit 2 Elizabeth, NJ | 2.0 | 1.0 | 600 | $1,925 | $3.21 | 7d | 1 | 0.50mi |
| 849 Jersey Ave Unit A Elizabeth, NJ | 2.0 | 1.0 | — | $1,925 | — | 24d | 1 | 0.50mi |
| 836 Jersey Ave Unit A Elizabeth, NJ | 2.0 | 1.0 | 800 | $1,800 | $2.25 | 21d | 1 | 0.50mi |
| 148 Chilton St Unit 2 Elizabeth, NJ | 3.0 | 1.0 | — | $2,200 | — | 24d | 1 | 0.50mi |
| 112-114 Stiles St Elizabeth, NJ | 3.0 | 1.0 | 1100 | $1,900 | $1.73 | 2d | 1 | 0.52mi |
| 767 Canton St Unit NA Elizabeth, NJ | 3.0 | 2.0 | 2100 | $3,500 | $1.67 | 24d | 1 | 0.53mi |
| 49 Orchard St Elizabeth, NJ | 2.0 | 1.0 | — | $1,800 | — | 24d | 1 | 0.60mi |
| 312 Vine St Elizabeth, NJ | 3.0 | 2.0 | — | $2,850 | — | 24d | 1 | 0.64mi |
| 530 Vine St Elizabeth, NJ | 2.0 | 1.0 | 660 | $2,150 | $3.26 | 14d | 3 | 0.66mi |
| 501-503 Morris Ave Elizabeth, NJ | 2.0 | 1.0 | — | $2,100 | — | 24d | 1 | 0.68mi |
| 129 Cherry St Elizabeth, NJ | 3.0 | 1.0 | — | $2,250 | — | 24d | 1 | 0.68mi |
| 127 Murray St Unit 2 Elizabeth, NJ | 2.0 | 1.0 | — | $1,900 | — | 24d | 1 | 0.69mi |
| 129-131 Cherry St Unit 131- 1st fl Elizabeth, NJ | 3.0 | 1.0 | 13993 | $2,250 | $0.16 | 20d | 1 | 0.69mi |
| 50 Cherry St Unit B Elizabeth, NJ | 3.0 | 1.0 | 1000 | $2,700 | $2.70 | 24d | 1 | 0.72mi |
| 340 Morris Ave Elizabeth, NJ | 3.0 | 1.0 | — | $2,200 | — | 24d | 1 | 0.75mi |
| 15 Hayes Ave Elizabeth, NJ | 3.0 | 1.5 | — | $2,400 | — | 24d | 1 | 0.78mi |
| 100 Union St Elizabeth, NJ | 1.0–2.0 | 1.0–2.0 | 863 | $3,331 | $3.86 | 1d | 25 | 0.82mi |
| 353 Fay Ave Unit 2 Elizabeth, NJ | 2.0 | 1.0 | — | $2,250 | — | 21d | 1 | 0.83mi |
| 78 Murray St Unit 517 Elizabeth, NJ | 2.0 | 2.0 | 1064 | $2,599 | $2.44 | 7d | 1 | 0.83mi |
| 34 Cedar Ave Elizabeth, NJ | 3.0 | 2.0 | — | $3,100 | — | 24d | 1 | 0.83mi |
| 78 Murray St Unit 201 Elizabeth, NJ | 2.0 | 2.0 | 1012 | $2,649 | $2.62 | 24d | 1 | 0.84mi |
| 78 Murray St Unit 409 Elizabeth, NJ | 2.0 | 2.0 | 1042 | $2,495 | $2.39 | 24d | 1 | 0.84mi |
| 78 Murray St Unit 216 Elizabeth, NJ | 2.0 | 2.0 | 989 | $2,499 | $2.53 | 24d | 1 | 0.84mi |
| 78 Murray St Unit 405 Elizabeth, NJ | 2.0 | 2.0 | 1087 | $2,595 | $2.39 | 24d | 1 | 0.84mi |
| 280 Morris Ave Elizabeth, NJ | 3.0 | 1.0 | 1000 | $2,399 | $2.40 | 24d | 1 | 0.85mi |
| 276 Morris Ave Unit 3 Elizabeth, NJ | 3.0 | 1.0 | — | $2,375 | — | 10d | 1 | 0.85mi |
Listing history 2 events
-
2026-06-08remarks 279-char remark
-
2026-06-08$2,400 Active 1 DOM
ⓘ Source: listings_history table (triggers on properties + properties_extension) + one-shot
backfill from property_details.listing_events for pre-trigger history.
Climate risk First Street
- Flood 1/10 Low FEMA zone X (unshaded) · 0% chance over 30 yrs
- Wildfire 1/10 Low
- Heat 7/10 Severe 7 d/yr ≥101°F today · 15 d/yr by 30 yrs out
- Wind 6/10 Major 27% chance of damaging wind over 30 yrs
- Air quality 4/10 Moderate 4 unhealthy d/yr today · 5 by 30 yrs out
Nearby sold comps map
Loading sold comps map…
Walkable amenities ~0.75 mi
Loading nearby amenities…
Taxation est. · year 1
- Rental income
- $57,780
- − Mortgage interest
- −$134
- − Property taxes
- −$36
- − Insurance
- −$12
- − Repairs & maintenance
- −$4,622
- − Management
- −$4,622
- − Depreciation
- −$70
- Taxable income
- $48,283
- Est. tax owed @ 24.0%
- −$11,588
- After-tax cash flow
- $33,859/yr
For passive investors: Depreciation is non-cash, so a rental often shows a tax loss while cash-flowing — sheltering income. Rental losses are passive: they offset passive income freely, and up to $25,000/yr can offset ordinary (W-2) income if you actively participate and your MAGI is under $100k (phasing out to $0 by $150k); unused losses carry forward. On sale, claimed depreciation is recaptured at up to 25%, and gains may owe capital-gains tax (a 1031 exchange can defer both). Figures are a year-1 estimate at your 24.0% rate — not tax advice; consult a CPA.
Schools (NCES district)
- District
- Elizabeth Public Schools
- NCES district ID
- 3404590
- Math proficiency
- 9% ▼ -17.00%
- Reading proficiency
- 33% ▼ -19.00%
- Median HH income
- $43,785
- Composite
- 18.05/100
- National rank
- #8979
- State rank
- #430 of 472 in NJ
Livability — Elizabeth
- Score
- 69/100
- State rank
- #277
- US rank
- #8270
Category grades
Schools grade is shown separately in the Schools card above.
Census & demographics
- Census place
- Elizabeth, NJ
- City population
- 105,365
- Population (ZIP)
- 32,404
Population outlook (Union County) Hauer SSP2
- Today (2025)
- 596,450 people
- By 2030
- 616,880 · +3.4%
- By 2040
- 658,185 · +10.4%
- By 2050
- 696,707 · +16.8%
- By 2075
- 785,448 · +31.7%
- By 2100
- 836,583 · +40.3%
Race, ethnicity, and origin ACS 2023
- Neighborhood character
- Diverse neighborhood (Simpson 0.56)
- Race & ethnicity
- Hispanic / Latino 61% White 19% Two or more races 17% Black 15% Asian 2% Native American 1%
- Hispanic origin (detail)
- Mexican 3% Puerto Rican 7% Cuban 2% Dominican 9%
- Common ancestry
- Hispanic 3% Russian 3% Estonian 3%
- Foreign-born
- 52% · Canada, Jamaica, Guatemala
- Languages at home
- 25% English-only · Spanish 57% Other Indo-European 8% French/Haitian/Cajun 5%
Political lean MEDSL · Union
- 2024 margin
- Strong D (+24.2) · D 61.2% · R 37.0% · Other 1.8%
- 2008→2024 swing
- -4.0pp toward R · 2008: 28.2pp · 2024: 24.2pp
- All cycles
- 2024: D+24.2 2020: D+35.5 2016: D+35.5 2012: D+33.5 2008: D+28.2
Not yet ingested
- Civics
- —
Market trends
- HPI YoY
- ▼ -412.86%
- Current HPI
- 425.8788
- Rent YoY
- —
- Metro
- —
- State GDP YoY
- ▲ 2.05%
- F500 in state
- 34
Industry mix (Fortune 500 HQ in NJ)
| Industry | F500 HQs | Revenue |
|---|---|---|
| Consumer Goods | 3 | $31B |
|
||
| Pharmaceuticals | 2 | $153B |
|
||
| Technology | 2 | $21B |
|
||
| Insurance | 2 | $20B |
|
||
| Healthcare | 2 | $19B |
|
||
| Financial Services | 1 | $70B |
|
||
Price history
1 event — show timeline
- 2026-06-08 Listed $2,400 GSMLS
Cash-flow waterfall
monthlySold comps — $/sqft
last 12 mo · ≤1 miLoading sold comps…