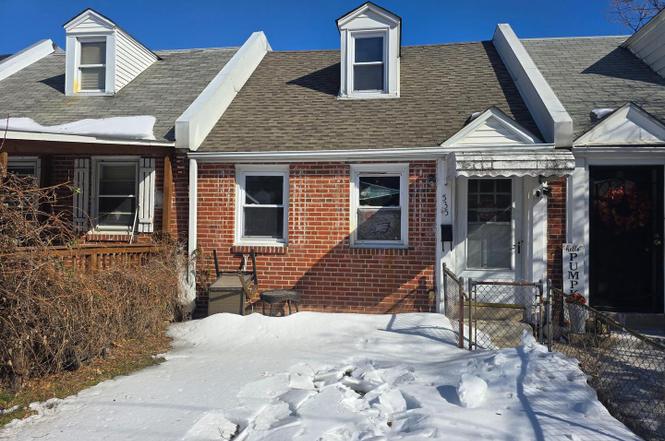
535 Wiltshire Rd · Philadelphia, PA
Flood risk 3/10 · Minor
- FEMA flood zone
- X (unshaded)
- Chance of flooding over 30 yrs
- 0.2%
- Est. flood insurance / yr
- $473 – $860
Fire risk 1/10 · Minimal
- Est. fire insurance / yr
- $511 – $949
Heat risk 6/10 · Moderate
- Hot days now (above 103°F)
- 7 days/yr
- Hot days in 30 yrs
- 15 days/yr
Wind risk 6/10 · Moderate
- Chance of severe wind over 30 yrs
- 27.0%
Air-quality risk 4/10 · Minor
- Unhealthy air days now
- 3 days/yr
- Unhealthy air days in 30 yrs
- 6 days/yr
Risk factors via First Street. Map © Google.
Why this score? — see what drove the B- grade
The composite is a weighted blend of 9 inputs, each scored 0–100. Each bar is that input's sub-score; the figure is the points it added to the 100-point composite (weight × sub-score).
- Cash flow +25.0/30.0
- ARV discount +15.0/15.0
- DSCR +8.2/10.0
- 1% rule +7.6/10.0
- Livability +3.9/5.0
- Rent growth +2.9/5.0
- Condition / age +2.5/5.0
- Schools +2.4/10.0
- Appreciation +0.0/10.0
$130,000
🖨 Deal sheet 📄 Offer letter ✓ Due diligence
Listing remarks
Fixer Upper. This Cape cod home is designed for a primarily one floor lifestyle. This home is located on a quiet street right off of 69th St. First floor layout has you entering into living room with kitchen and dining areas off to the side. Travel back further to the 1st bathroom and 2 bedrooms. Back door leads to rear yard and basement laundry (could be moved upstairs as well). 2nd floor has 3rd bedroom and ahalf bathroom. Exterior areas include a fenced in front and fenced in rear yard. Parking on street. Close to shopping center and public transportation. Home needs cosmetics throughout)
Key facts
- Quiet street
- Cape cod home
- Fenced in rear yard
Tags
Neighborhood map
What this means for you Summary
Snapshot
- This is a 3-bed/1.0-bath townhouse listed at $130k.
Deal economics
- At list price, monthly cash flow is $284 ($3k/yr) — positive.
- The deal already cash-flows at list — no discount required.
- Meets the 1% rule at list price ($2k rent vs $130k).
- Recommended offer: $126k (3.0% below list) — sets the bar for market timing.
- Cap rate 8.9% vs local median 3.5% in Philadelphia — top-decile yield for the area; either an underpriced asset or a hidden risk that comps aren't pricing in. Stress-test before assuming the spread holds.
Location & tenants
- Location reads 77/100 on livability (#348 in PA, #3,054 nationally) — a middle-class / working-renter tenant base. Strengths: amenities A+, commute A+, cost of living A+; Watch: employment C-, schools D+, crime F.
- Upper Darby SD (suburban): math 18% / reading 36% proficiency, ranked #453 of 539 in PA (top 84%) — low school quality limits family demand, transient renter base, plan for 1-2y turnover.
- Market conditions: Rents rising (+1.6%/yr); 129 active listings in the ZIP; 40 comparable units currently listed for rent nearby; rentals at typical pace (median 24d on market — plan ~3-4 weeks tenant-placement turnaround); 299 units permitted in Delaware County in 2024 (5 in 5+ unit buildings).
- This rent runs 34% of the median local income ($57k/yr) — at the standard rent-burdened threshold; future hikes will face affordability resistance.
Forward outlook
- Local home prices are declining (-3.0%/yr); year-one equity from $899 of loan paydown is wiped out by about $4k of value loss. Plan a longer hold.
Negotiation context
- It's been on market 36 days — a 3% lower offer ($126k) is reasonable based on typical stale-listing flexibility.
- 2 sale attempts with the ask held roughly flat each time — persistent listings suggest the price (not the market) is what's stuck; bring a comps-based counter.
Risks & watch-outs
- Watch-outs: property tax is 2.5% of price; built in 1940 — expect roof / HVAC / electrical / plumbing capex.
- Climate carrying-cost: major wind risk, 27% chance of damaging wind over 30y; extreme-heat days projected 7→15/yr by 2055 (HVAC capex compounding) — expect insurance premiums to compound above CPI over the hold.
Questions for the listing agent
- It's been on market 36 days. Have you received any prior offers? Is the seller open to a 3% concession, seller financing, or rate buy-down credit?
- Built in 1940 — when were the roof, HVAC, electrical panel, plumbing, and water heater last replaced?
- Property tax is high relative to price — has the assessment been appealed recently, and will the sale trigger a re-assessment?
- Is there a deadline driving the sale (1031 exchange, divorce, estate, relocation)? That informs how much negotiation room exists.
- Schools are D-rated, which usually means shorter tenancies and higher turnover. Who's the typical renter profile here, and what's been the actual vacancy rate?
- Crime grade is F in this area — have there been break-ins, vandalism, or insurance claims at this property in the last 3 years? What carrier currently insures it and at what premium?
- What's the average days-on-market for RENTAL listings here right now (not sales)? A rising rental-DOM trend means longer vacancies and softer asking-rent achievability than the comps imply.
- What's the recent tenant-quality profile in this submarket — average credit score on applications, eviction rate, late-payment / NSF rate, and stable-employment percentage? A property-management company in the area should have these aggregated.
- How much new for-sale + rental construction is in the pipeline within 1–3 miles? Heavy new supply typically softens prices + rents 12–24 months out; constrained supply supports both.
Investment metrics
- 1% rule
- 1.26% ✓
- Cap rate
- 8.91%
- Cash-on-cash
- 9.36%
- DSCR
- 1.42
- GRM
- 6.6
CMA / ARV
- ARV (on-the-fly)
- $187,929
- Comps found
- 12
Show comp detail 12 sales within ~0.75 mi
| Address | Dist | Beds/Ba | Sqft | Sold | Price | $/sf | Match |
|---|---|---|---|---|---|---|---|
| 222 Barrington Rd | 0.32mi | 3/1.0 | 1,258 (+5%) | 0mo | $180,000 | $143 | 76 |
| 7136 Pine St | 0.41mi | 3/— | 1,152 (-4%) | 1mo | $227,000 | $197 | 74 |
| 236 Hampden Rd | 0.43mi | 4/1.0 (+1) | 1,224 (+2%) | 0mo | $235,000 | $192 | 71 |
| 232 Le Carra Dr | 0.56mi | 3/1.5 | 1,278 (+7%) | 0mo | $231,000 | $181 | 60 |
| 40 Lamport Rd | 0.47mi | 3/2.0 | 1,327 (+11%) | 0mo | $174,000 | $131 | 56 |
| 225 Wingate Rd | 0.68mi | 4/2.0 (+1) | 1,170 (-2%) | 0mo | $205,000 | $175 | 55 |
| 54 Springton Rd | 0.51mi | 3/1.0 | 1,040 (-13%) | 0mo | $180,000 | $173 | 54 |
| 6038 Osage Ave | 0.72mi | 3/1.0 | 1,308 (+9%) | 0mo | $165,000 | $126 | 51 |
| 7281 Walnut St | 0.71mi | 3/1.0 | 1,328 (+11%) | 1mo | $145,000 | $109 | 47 |
| 212 Huntley Rd | 0.59mi | 3/1.5 | 1,370 (+14%) | 1mo | $210,000 | $153 | 46 |
| 309 Sanford Rd | 0.74mi | 3/1.0 | 1,348 (+13%) | 1mo | $170,000 | $126 | 43 |
| 5929 Christian St | 0.75mi | 4/1.0 (+1) | 1,316 (+10%) | 1mo | $206,000 | $157 | 43 |
Match score weights: distance 35% · size 25% · config 20% · recency 20%. Top-matched comps best support the ARV.
Projected returns pro-forma
-3.0% appreciation · 1.62% rent growth · sell at horizon
- IRR
- -3.8%
- Equity multiple
- 0.86×
- Total profit
- $-5,134
- Equity at exit
- $19,383
- IRR
- 4.1%
- Equity multiple
- 1.28×
- Total profit
- $10,240
- Equity at exit
- $11,240
Cash invested: $36,400 (down + closing). Projections, not guarantees.
Landlord ↔ Tenant lean methodology
- Overall (STATE)
- 62 Landlord-Friendly
- State Pennsylvania
- 62 Landlord-Friendly · EVEN
- County
- — inherits STATE
- City
- — inherits STATE
ZIP-level market 19082
- Home prices YoY
- -32.1%
- Rents YoY
- 1.6%
- Active inventory
- 129
- Price-to-rent
- 6.6×
Monthly cashflow live
- Estimated rent
- $1,638 high interval (Pro) →
- Mortgage (P&I)
- −$682
- Tax from tax record
- −$274 /mo · $3,286/yr
- Insurance
- −$54
- HOA
- −$0
- Vacancy / Maint / Mgmt
- −$344
- Net cashflow
- $284
Break-even live
UW: 25.0% down · 7.5% · 30yr · 1.5% tax · 5.0% vac · 8.0% maint · 8.0% mgmt
Financing live
Cash to close
- Down payment
- $32,500
- Closing costs
- $3,900
- Reserves months
- —
- Total cash needed
- —
Loan-product check · same deal, 3 products live
Conventional
25% down · 7.5% · 30yr
- Down + closing
- —
- Monthly P&I
- —
- Monthly cashflow
- —
- DSCR
- —
- Eligible?
- —
Personal DTI + credit; lowest rate.
DSCR
20% down · 8.5% · 30yr
- Down + closing
- —
- Monthly P&I
- —
- Monthly cashflow
- —
- DSCR
- —
- Eligible?
- —
No personal income docs; deal must DSCR.
Hard money
10% down · 12.0% · 12mo
- Down + closing
- —
- Monthly P&I
- —
- Monthly cashflow
- —
- DSCR
- —
- Eligible?
- —
Short-term bridge; refi at stabilization.
Rent comps 40 comps
| Address | Beds | Baths | Sqft | Rent | $/sqft | DOM | Units | Dist |
|---|---|---|---|---|---|---|---|---|
| 6927 Guilford Rd Upper Darby, PA | 2.0 | 1.0 | 1182 | $1,495 | $1.26 | 2d | 1 | 0.09mi |
| 6965 Clinton Rd Upper Darby, PA | 2.0 | 1.0 | 986 | $1,675 | $1.70 | 43d | 1 | 0.13mi |
| 624 Briarcliff Rd Unit MAIN UNIT Upper Darby Township, PA | 3.0 | 1.0 | 1307 | $1,700 | $1.30 | 24d | 1 | 0.17mi |
| 624 Briarcliff Rd Upper Darby, PA | 3.0 | 1.0 | 1307 | $1,700 | $1.30 | 43d | 1 | 0.17mi |
| 444 Timberlake Rd Upper Darby, PA | 2.0 | 1.0 | 864 | $1,400 | $1.62 | 5d | 1 | 0.18mi |
| 7026 Clinton Rd Upper Darby, PA | 2.0 | 1.5 | 902 | $1,650 | $1.83 | 43d | 1 | 0.19mi |
| 6839 Radbourne Rd Upper Darby, PA | 3.0 | 1.5 | 1242 | $1,750 | $1.41 | 24d | 1 | 0.19mi |
| 411 Timberlake Rd Upper Darby, PA | 2.0 | 1.0 | 864 | $1,400 | $1.62 | 20d | 1 | 0.21mi |
| 7050 Clinton Rd Upper Darby, PA | 2.0 | 1.0 | 977 | $1,550 | $1.59 | 43d | 1 | 0.22mi |
| 7111 Greenwood Ave Upper Darby, PA | 3.0 | 1.5 | 1064 | $1,800 | $1.69 | 43d | 1 | 0.26mi |
| 7139 Greenwood Ave Upper Darby, PA | 3.0 | 1.0 | 1064 | $1,600 | $1.50 | 24d | 1 | 0.28mi |
| 702 Copley Rd Upper Darby, PA | 3.0 | 1.0 | 1044 | $1,750 | $1.68 | 24d | 1 | 0.29mi |
| 671 Long Ln Unit B Upper Darby Township, PA | 2.0 | 1.5 | 850 | $1,300 | $1.53 | 24d | 1 | 0.30mi |
| 430 Glendale Rd Upper Darby, PA | 3.0 | 1.0 | 1090 | $1,650 | $1.51 | 21d | 1 | 0.32mi |
| 7216 Clinton Rd Upper Darby, PA | 3.0 | 1.0 | 1170 | $1,815 | $1.55 | 1d | 1 | 0.33mi |
| 7116 Seaford Rd Upper Darby, PA | 2.0 | 1.0 | 996 | $1,600 | $1.61 | 43d | 1 | 0.34mi |
| 31 Lamport Rd Upper Darby, PA | 3.0 | 1.0 | 1244 | $1,800 | $1.45 | 5d | 1 | 0.46mi |
| 177 Wellington Rd Upper Darby, PA | 3.0 | 2.0 | 1236 | $2,000 | $1.62 | 24d | 1 | 0.48mi |
| 124 Lexington Ave Unit 2 Lansdowne, PA | 2.0 | 1.0 | 1000 | $1,500 | $1.50 | 2d | 1 | 0.59mi |
| 7147 Radbourne Rd Upper Darby, PA | 3.0 | 1.0 | 1096 | $1,850 | $1.69 | 12d | 1 | 0.64mi |
| 292 N Wycombe Ave Lansdowne, PA | 2.0 | 1.0 | 1162 | $1,600 | $1.38 | 43d | 1 | 0.66mi |
| 217 Sansom St Upper Darby, PA | 2.0 | 1.0 | 1342 | $1,000 | $0.75 | 24d | 1 | 0.72mi |
| 130 Garrett Rd Upper Darby, PA | 2.0 | 1.0 | 675 | $999 | $1.48 | 5d | 2 | 0.73mi |
| 293 Wabash Ave Lansdowne, PA | 3.0 | 1.0 | 1377 | $1,900 | $1.38 | 18d | 1 | 0.76mi |
| 7100 W Chester Pike Upper Darby Township, PA | 1.0–2.0 | 1.0 | 770 | $1,315 | $1.71 | 24d | 5 | 0.89mi |
| 55 N Keystone Ave Upper Darby, PA | 3.0 | 1.0 | 1258 | $1,700 | $1.35 | 43d | 1 | 0.93mi |
| 619 Baily Rd Lansdowne, PA | 3.0 | 1.0 | 1288 | $1,850 | $1.44 | 18d | 1 | 1.05mi |
| 608 Yeadon Ave Unit 2nd Floor Yeadon, PA | 2.0 | 1.0 | 1000 | $1,400 | $1.40 | 12d | 1 | 1.06mi |
| 608 Yeadon Ave Unit 1st Floor Yeadon, PA | 2.0 | 1.0 | 1000 | $1,400 | $1.40 | 17d | 1 | 1.06mi |
| 44 Sunshine Rd Upper Darby, PA | 4.0 | 1.0 | 1481 | $1,795 | $1.21 | 21d | 1 | 1.15mi |
| 51 N State Rd Upper Darby, PA | 3.0 | 1.0 | 1244 | $1,595 | $1.28 | 43d | 1 | 1.17mi |
| 5 W Plumstead Ave Unit 1 Lansdowne, PA | 2.0 | 1.0 | 1100 | $1,550 | $1.41 | 24d | 1 | 1.18mi |
| 83 S State Rd Unit B502 Upper Darby Township, PA | 2.0 | 1.0 | 800 | $1,289 | $1.61 | 1d | 1 | 1.18mi |
| 35 Elberon Ave Unit 2 Lansdowne, PA | 2.0 | 1.0 | 900 | $1,695 | $1.88 | 24d | 1 | 1.23mi |
| 826 Guenther Ave Lansdowne, PA | 2.0 | 1.0–2.0 | 800 | $1,699 | $2.12 | 24d | 1 | 1.25mi |
| 139 S State Rd Apt B2 Upper Darby Township, PA | 2.0 | 1.0 | 800 | $1,300 | $1.62 | 4d | 1 | 1.33mi |
| 10 Oakley Rd Upper Darby, PA | 3.0 | 1.0 | 1476 | $1,895 | $1.28 | 24d | 1 | 1.36mi |
| 810 Rundale Ave Lansdowne, PA | 2.0 | 1.0 | 868 | $1,500 | $1.73 | 24d | 1 | 1.38mi |
| 233 S State Rd Unit 2ND Upper Darby Township, PA | 3.0 | 2.0 | 950 | $2,000 | $2.11 | 43d | 1 | 1.43mi |
| 101 W Baltimore Ave Unit H4 Lansdowne, PA | 2.0 | 1.0 | 925 | $1,449 | $1.57 | 21d | 1 | 1.47mi |
Listing history 8 events
-
2026-05-06soldstatus $130,000
-
2026-03-30status Pending
-
2026-02-28status Active
-
2026-02-17status Pending
-
2026-02-11$130,000 Active
-
2003-06-18soldstatus $47,496
-
1988-03-10soldstatus $47,000
-
1982-12-01soldstatus $24,000
ⓘ Source: listings_history table (triggers on properties + properties_extension) + one-shot
backfill from property_details.listing_events for pre-trigger history.
Tax reassessment forecast PA · Partial reset (capped growth)
- Current annual tax
- $3,286 · $274/mo
- Projected year-2 tax
- $3,286 · $274/mo
- Expected delta
- $0/yr ($0/mo · 0.0%)
ⓘ Screening estimate from a state-policy table — verify with the county assessor before closing.
Climate risk First Street
- Flood 3/10 Moderate FEMA zone X (unshaded) · 20% chance over 30 yrs
- Wildfire 1/10 Low
- Heat 6/10 Major 7 d/yr ≥103°F today · 15 d/yr by 30 yrs out
- Wind 6/10 Major 27% chance of damaging wind over 30 yrs
- Air quality 4/10 Moderate 3 unhealthy d/yr today · 6 by 30 yrs out
Nearby sold comps map
Loading sold comps map…
Walkable amenities ~0.75 mi
Loading nearby amenities…
Taxation est. · year 1
- Rental income
- $19,650
- − Mortgage interest
- −$7,282
- − Property taxes
- −$3,286
- − Insurance
- −$650
- − Repairs & maintenance
- −$1,572
- − Management
- −$1,572
- − Depreciation
- −$3,782
- Taxable income
- $1,506
- Est. tax owed @ 24.0%
- −$362
- After-tax cash flow
- $3,045/yr
For passive investors: Depreciation is non-cash, so a rental often shows a tax loss while cash-flowing — sheltering income. Rental losses are passive: they offset passive income freely, and up to $25,000/yr can offset ordinary (W-2) income if you actively participate and your MAGI is under $100k (phasing out to $0 by $150k); unused losses carry forward. On sale, claimed depreciation is recaptured at up to 25%, and gains may owe capital-gains tax (a 1031 exchange can defer both). Figures are a year-1 estimate at your 24.0% rate — not tax advice; consult a CPA.
Schools (NCES district)
- District
- Upper Darby SD
- NCES district ID
- 4224320
- Math proficiency
- 18% ▼ -8.00%
- Reading proficiency
- 36% ▼ -10.00%
- Median HH income
- $50,341
- Composite
- 23.68/100
- National rank
- #7837
- State rank
- #453 of 539 in PA
Livability — Philadelphia
- Score
- 77/100
- State rank
- #348
- US rank
- #3054
Category grades
Schools grade is shown separately in the Schools card above.
Census & demographics
- County
- Delaware County · 399,863 people
- City population
- 1,559,001
- Metro
- Philadelphia-Camden-Wilmington, PA-NJ-DE-MD
- Population (ZIP)
- 41,541
- Household income
- $57,108
- Rent vs Own
- Severe rent burden
- 2416.0
Population outlook (Delaware County) Hauer SSP2
- Today (2025)
- 577,490 people
- By 2030
- 581,243 · +0.6%
- By 2040
- 584,700 · +1.2%
- By 2050
- 586,581 · +1.6%
- By 2075
- 598,706 · +3.7%
- By 2100
- 590,823 · +2.3%
Race, ethnicity, and origin ACS 2023
- Neighborhood character
- Highly diverse neighborhood (Simpson 0.71)
- Race & ethnicity
- Black 44% White 21% Asian 17% Hispanic / Latino 13% Two or more races 5%
- Hispanic origin (detail)
- Mexican 3% Puerto Rican 2%
- Common ancestry
- Hispanic 2% Swiss 2% Romanian 1%
- Foreign-born
- 34% · Canada, Vietnam, South Korea
- Languages at home
- 62% English-only · Spanish 11% Other Indo-European 10% French/Haitian/Cajun 5%
Political lean MEDSL · Delaware
- 2024 margin
- Strong D (+23.7) · D 61.4% · R 37.6% · Other 1.0%
- 2008→2024 swing
- +2.3pp toward D · 2008: 21.4pp · 2024: 23.7pp
- All cycles
- 2024: D+23.7 2020: D+26.7 2016: D+22.0 2012: D+21.8 2008: D+21.4
Not yet ingested
- Civics
- —
Market trends
- HPI YoY
- ▼ -161.05%
- Current HPI
- 341.2957
- Rent YoY
- ▲ 1.62%
- Metro
- Philadelphia-Camden-Wilmington, PA-NJ-DE-MD
- State GDP YoY
- ▲ 1.68%
- F500 in state
- 34
Industry mix (Fortune 500 HQ in PA)
| Industry | F500 HQs | Revenue |
|---|---|---|
| Healthcare | 2 | $309B |
|
||
| Insurance | 2 | $27B |
|
||
| Telecommunications / Media | 1 | $124B |
|
||
| Industrial Distribution | 1 | $22B |
|
||
| Financial Services | 1 | $20B |
|
||
| Chemicals / Materials | 1 | $18B |
|
||
Price history
+441.7% since first listed8 events — show timeline
- 2026-05-06 Sold (Public Records) $130,000 Public Records
- 2026-03-30 Pending — BRIGHT MLS
- 2026-02-28 Relisted — BRIGHT MLS
- 2026-02-17 Pending — BRIGHT MLS
- 2026-02-11 Listed $130,000 BRIGHT MLS
- 2003-06-18 Sold (Public Records) $47,496 Public Records
- 1988-03-10 Sold (Public Records) $47,000 Public Records
- 1982-12-01 Sold (Public Records) $24,000 Public Records
Property tax history
+2.5%/yrLatest (2026): $3,286 · +7.7% YoY. Source: county tax records.
Cash-flow waterfall
monthlySold comps — $/sqft
last 12 mo · ≤1 miLoading sold comps…