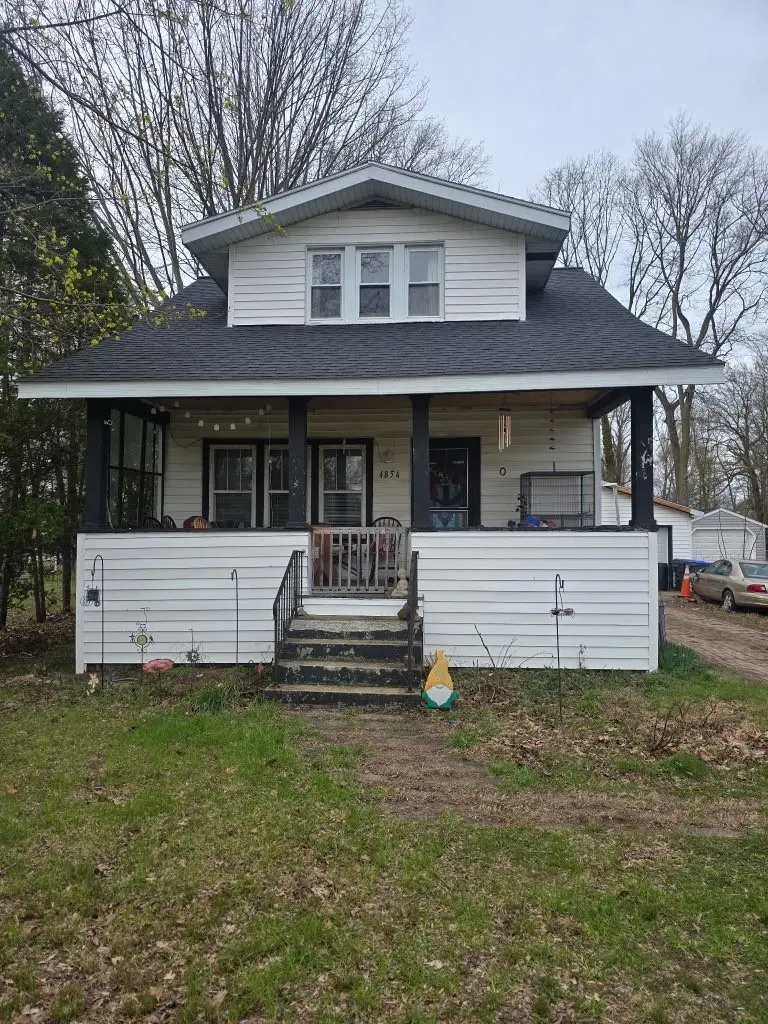
4854 Old West Lake Rd · Fairview, PA
Flood risk 1/10 · Minimal
- FEMA flood zone
- X (unshaded)
- Chance of flooding over 30 yrs
- 0.0%
- Est. flood insurance / yr
- $473 – $860
Fire risk 1/10 · Minimal
- Est. fire insurance / yr
- $511 – $949
Heat risk 2/10 · Minimal
- Hot days now (above 90°F)
- 7 days/yr
- Hot days in 30 yrs
- 17 days/yr
Wind risk 1/10 · Minimal
- Chance of severe wind over 30 yrs
- —
Air-quality risk 3/10 · Minor
- Unhealthy air days now
- 3 days/yr
- Unhealthy air days in 30 yrs
- 3 days/yr
Risk factors via First Street. Map © Google.
Why this score? — see what drove the C grade
The composite is a weighted blend of 9 inputs, each scored 0–100. Each bar is that input's sub-score; the figure is the points it added to the 100-point composite (weight × sub-score).
- Cash flow +17.2/30.0
- ARV discount +15.0/15.0
- DSCR +5.4/10.0
- 1% rule +5.1/10.0
- Schools +4.8/10.0
- Livability +4.2/5.0
- Rent growth +2.5/5.0
- Condition / age +2.5/5.0
- Appreciation +0.0/10.0
$139,000
🖨 Deal sheet (PDF) 📄 Offer letter ✓ Due diligence
Listing remarks MLS
Investment Opportunity In Northwest Millcreek! This 1.5 Story Home Offers 2 Bedrooms, 1 Bathroom, And A 2 Car Garage. Property Presents A Great Opportunity For Buyers Looking To Add Their Personal Touch And Build Equity. With Some Vision And Updates, This Home Has Strong Potential To Shine. Sold As-Is.
Key facts
- 0.29 acre lot
- 2 garage spots
- Built 1930
Neighborhood map
What this means for you Summary
Snapshot
- This is a 2-bed/1.0-bath single-family listed at $139k.
Deal economics
- At list price, monthly cash flow is $99 ($1k/yr) — positive.
- The deal already cash-flows at list — no discount required.
- Meets the 1% rule at list price ($1k rent vs $139k).
- Recommended offer: $135k (3.0% below list) — sets the bar for market timing.
- Cap rate 7.1% vs local median 2.0% in Fairview — top-decile yield for the area; either an underpriced asset or a hidden risk that comps aren't pricing in. Stress-test before assuming the spread holds.
Location & tenants
- Location reads 83/100 on livability (#123 in PA, #963 nationally) — a professional / high-income tenant draw. Strengths: schools A+, crime A+, employment A+; Watch: amenities F, commute F.
- Millcreek Township SD (suburban): math 46% / reading 65% proficiency, ranked #105 of 539 in PA (top 20%) — acceptable for families but not a draw, mixed tenant base, ~2y average lease.
- Market conditions: 71 active listings in the ZIP; 2 comparable units currently listed for rent nearby; 364 units permitted in Erie County in 2024 (188 in 5+ unit buildings).
Forward outlook
- Local home prices are declining (-3.0%/yr); year-one equity from $961 of loan paydown is wiped out by about $4k of value loss. Plan a longer hold.
- Erie County population projected at -14% by 2050 — secular population decline; favor cash flow + early exit over multi-decade hold.
Negotiation context
- It's been on market 37 days — a 3% lower offer ($135k) is reasonable based on typical stale-listing flexibility.
- 2 sale attempts since 12y ago with the ask held roughly flat each time — persistent listings suggest the price (not the market) is what's stuck; bring a comps-based counter.
- Current owner paid $98k; 42% above their basis — modest negotiation headroom, anchor on the comps not their cost.
Risks & watch-outs
- Watch-outs: built in 1930 — expect roof / HVAC / electrical / plumbing capex.
Questions for the listing agent
- It's been on market 37 days. Have you received any prior offers? Is the seller open to a 3% concession, seller financing, or rate buy-down credit?
- Built in 1930 — when were the roof, HVAC, electrical panel, plumbing, and water heater last replaced?
- Is there a deadline driving the sale (1031 exchange, divorce, estate, relocation)? That informs how much negotiation room exists.
- Schools are A-rated — typically a magnet for longer-tenancy family renters. What's the average tenant stay here, and is there a school-zone premium baked into asking?
- What's the average days-on-market for RENTAL listings here right now (not sales)? A rising rental-DOM trend means longer vacancies and softer asking-rent achievability than the comps imply.
- What's the recent tenant-quality profile in this submarket — average credit score on applications, eviction rate, late-payment / NSF rate, and stable-employment percentage? A property-management company in the area should have these aggregated.
- How much new for-sale + rental construction is in the pipeline within 1–3 miles? Heavy new supply typically softens prices + rents 12–24 months out; constrained supply supports both.
Investment metrics
- 1% rule
- 1.01% ✓
- Cap rate
- 7.14%
- Cash-on-cash
- 3.04%
- DSCR
- 1.14
- GRM
- 8.3
CMA / ARV
- ARV (median comp)
- $198,530
- List price
- $139,000
- Delta
- -29.99%
- Verdict
- UNDERPRICED
- Comps
- 20 within 1.0 mi
Show comp detail 8 sales within ~0.75 mi
| Address | Dist | Beds/Ba | Sqft | Sold | Price | $/sf | Match |
|---|---|---|---|---|---|---|---|
| 1621 Garloch Dr | 0.58mi | 2/1.0 | 1,002 (-7%) | 11mo | $66,000 | $66 | 51 |
| 5354 Windward Dr | 0.63mi | 3/1.0 (+1) | 1,132 (+5%) | 8mo | $239,900 | $212 | 51 |
| 1135 Candy Ln | 0.56mi | 3/1.0 (+1) | 1,144 (+6%) | 11mo | $242,000 | $212 | 50 |
| 1547 Garloch Dr | 0.58mi | 1/1.0 (-1) | 1,154 (+7%) | 14mo | $136,000 | $118 | 45 |
| 5430 Edward St | 0.63mi | 2/1.0 | 952 (-12%) | 9mo | $67,900 | $71 | 43 |
| 1112 Western Ln | 0.65mi | 3/1.0 (+1) | 1,240 (+15%) | 2mo | $237,770 | $192 | 39 |
| 1717 Garloch Dr | 0.58mi | 3/1.5 (+1) | 1,200 (+11%) | 13mo | $218,000 | $182 | 36 |
| 5220 Deepwood Ln | 0.41mi | 3/2.0 (+1) | 938 (-13%) | 18mo | $29,000 | $31 | 34 |
Match score weights: distance 35% · size 25% · config 20% · recency 20%. Top-matched comps best support the ARV.
Projected returns pro-forma
-3.0% appreciation · 3.0% rent growth · sell at horizon
- IRR
- -11.5%
- Equity multiple
- 0.58×
- Total profit
- $-16,197
- Equity at exit
- $20,725
- IRR
- -2.2%
- Equity multiple
- 0.85×
- Total profit
- $-5,818
- Equity at exit
- $12,018
Cash invested: $38,920 (down + closing). Projections, not guarantees.
Landlord ↔ Tenant lean methodology
- Overall (STATE)
- 62 Landlord-Friendly
- State Pennsylvania
- 62 Landlord-Friendly · EVEN
- County
- — inherits STATE
- City
- — inherits STATE
ZIP-level market 16505
- Home prices YoY
- -33.5%
- Active inventory
- 71
- Price-to-rent
- 8.3×
Monthly cashflow live
- Estimated rent
- $1,400 medium interval (Pro) →
- Mortgage (P&I)
- −$729
- Tax from tax record
- −$221 /mo · $2,647/yr
- Insurance
- −$58
- HOA
- −$0
- Vacancy / Maint / Mgmt
- −$294
- Net cashflow
- $99
Break-even live
Sensitivity live
| Price | -10% $177 | -5% $138 | +0% $99 | +5% $59 | +10% $20 |
|---|---|---|---|---|---|
| Rent | -10% $-12 | -5% $43 | +0% $99 | +5% $154 | +10% $209 |
| Rate | -1.0pp $169 | -0.5pp $134 | base $99 | +0.5pp $63 | +1.0pp $26 |
UW: 25.0% down · 7.5% · 30yr · 1.5% tax · 5.0% vac · 8.0% maint · 8.0% mgmt
Financing live
Cash to close
- Down payment
- $34,750
- Closing costs
- $4,170
- Reserves months
- —
- Total cash needed
- —
Loan-product check · same deal, 3 products live
Conventional
25% down · 7.5% · 30yr
- Down + closing
- —
- Monthly P&I
- —
- Monthly cashflow
- —
- DSCR
- —
- Eligible?
- —
Personal DTI + credit; lowest rate.
DSCR
20% down · 8.5% · 30yr
- Down + closing
- —
- Monthly P&I
- —
- Monthly cashflow
- —
- DSCR
- —
- Eligible?
- —
No personal income docs; deal must DSCR.
Hard money
10% down · 12.0% · 12mo
- Down + closing
- —
- Monthly P&I
- —
- Monthly cashflow
- —
- DSCR
- —
- Eligible?
- —
Short-term bridge; refi at stabilization.
Rent comps 2 comps
| Address | Beds | Baths | Sqft | Rent | $/sqft | DOM | Units | Dist |
|---|---|---|---|---|---|---|---|---|
| 1046 Grace St Erie, PA | 2.0 | 1.0 | 850 | $1,400 | $1.65 | 44d | 1 | 0.76mi |
| 4060 Chilton Ct Unit 2 Erie, PA | 2.0 | 1.0 | 768 | $1,400 | $1.82 | 44d | 1 | 1.23mi |
Listing history 3 events
-
2026-04-14$139,000 Active 303-char remark
Show marketing remark (303 chars)
Investment Opportunity In Northwest Millcreek! This 1.5 Story Home Offers 2 Bedrooms, 1 Bathroom, And A 2 Car Garage. Property Presents A Great Opportunity For Buyers Looking To Add Their Personal Touch And Build Equity. With Some Vision And Updates, This Home Has Strong Potential To Shine. Sold As-Is.
-
2014-09-09$99,900
-
2005-12-30soldstatus $97,900
ⓘ Source: listings_history table (triggers on properties + properties_extension) + one-shot
backfill from property_details.listing_events for pre-trigger history.
Tax reassessment forecast PA · Partial reset (capped growth)
- Current annual tax
- $2,647 · $221/mo
- Projected year-2 tax
- $2,647 · $221/mo
- Expected delta
- $0/yr ($0/mo · 0.0%)
ⓘ Screening estimate from a state-policy table — verify with the county assessor before closing.
Climate risk First Street
- Flood 1/10 Low FEMA zone X (unshaded) · 0% chance over 30 yrs
- Wildfire 1/10 Low
- Heat 2/10 Low 7 d/yr ≥90°F today · 17 d/yr by 30 yrs out
- Wind 1/10 Low
- Air quality 3/10 Moderate 3 unhealthy d/yr today · 3 by 30 yrs out
Nearby sold comps map
Loading sold comps map…
Walkable amenities ~0.75 mi
Loading nearby amenities…
Taxation est. · year 1
- Rental income
- $16,800
- − Mortgage interest
- −$7,786
- − Property taxes
- −$2,647
- − Insurance
- −$695
- − Repairs & maintenance
- −$1,344
- − Management
- −$1,344
- − Depreciation
- −$4,044
- Taxable loss
- −$1,060
- Est. tax savings @ 24.0%
- +$254
- After-tax cash flow
- $1,437/yr
For passive investors: Depreciation is non-cash, so a rental often shows a tax loss while cash-flowing — sheltering income. Rental losses are passive: they offset passive income freely, and up to $25,000/yr can offset ordinary (W-2) income if you actively participate and your MAGI is under $100k (phasing out to $0 by $150k); unused losses carry forward. On sale, claimed depreciation is recaptured at up to 25%, and gains may owe capital-gains tax (a 1031 exchange can defer both). Figures are a year-1 estimate at your 24.0% rate — not tax advice; consult a CPA.
Schools (NCES district)
- District
- Millcreek Township SD
- NCES district ID
- 4215330
- Math proficiency
- 46% ▼ -13.00%
- Reading proficiency
- 65% ▼ -9.00%
- Median HH income
- $55,734
- Composite
- 47.82/100
- National rank
- #2224
- State rank
- #105 of 539 in PA
Livability — Fairview
- Score
- 83/100
- State rank
- #123
- US rank
- #963
Category grades
Schools grade is shown separately in the Schools card above.
Census & demographics
- Population (ZIP)
- 15,631
Population outlook (Erie County) Hauer SSP2
- Today (2025)
- 272,159 people
- By 2030
- 266,299 · -2.2%
- By 2040
- 250,987 · -7.8%
- By 2050
- 234,925 · -13.7%
- By 2075
- 199,164 · -26.8%
- By 2100
- 162,985 · -40.1%
Race, ethnicity, and origin ACS 2023
- Neighborhood character
- Predominantly White (93%)
- Race & ethnicity
- White 93% Hispanic / Latino 3% Two or more races 3% Asian 2% Black 1%
- Common ancestry
- Romanian 12% Slovak 3% Italian 2%
- Foreign-born
- 3% · Canada
- Languages at home
- 94% English-only · Other Indo-European 1% French/Haitian/Cajun 1% Spanish 1%
Political lean MEDSL · Erie
- 2024 margin
- Toss-up / Even · D 49.0% · R 50.0%
- 2008→2024 swing
- -20.9pp toward R · 2008: 19.9pp · 2024: -1.0pp
- All cycles
- 2024: R+1.0 2020: D+1.0 2016: R+2.0 2012: D+16.9 2008: D+19.9
Not yet ingested
- Civics
- —
Market trends
- HPI YoY
- ▼ -121.22%
- Current HPI
- 240.6976
- Rent YoY
- —
- Metro
- —
- State GDP YoY
- ▲ 1.68%
- F500 in state
- 34
Industry mix (Fortune 500 HQ in PA)
| Industry | F500 HQs | Revenue |
|---|---|---|
| Healthcare | 2 | $309B |
|
||
| Insurance | 2 | $27B |
|
||
| Telecommunications / Media | 1 | $124B |
|
||
| Industrial Distribution | 1 | $22B |
|
||
| Financial Services | 1 | $20B |
|
||
| Chemicals / Materials | 1 | $18B |
|
||
Price history
+42.0% since first listed3 events — show timeline
- 2026-04-14 Listed $139,000 GEBOR
- 2014-09-09 Listed $99,900 GEBOR
- 2005-12-30 Sold (Public Records) $97,900 Public Records
Property tax history
+2.5%/yrLatest (2026): $2,647 · +3.6% YoY. Source: county tax records.
Cash-flow waterfall
monthlySold comps — $/sqft
last 12 mo · ≤1 miLoading sold comps…