35 Perry St · Pittsburgh, PA
Flood risk 1/10 · Minimal
- FEMA flood zone
- X (unshaded)
- Chance of flooding over 30 yrs
- 0.0%
- Est. flood insurance / yr
- $473 – $860
Fire risk 1/10 · Minimal
- Est. fire insurance / yr
- $511 – $949
Heat risk 4/10 · Minor
- Hot days now (above 98°F)
- 7 days/yr
- Hot days in 30 yrs
- 17 days/yr
Wind risk 2/10 · Minimal
- Chance of severe wind over 30 yrs
- —
Air-quality risk 4/10 · Minor
- Unhealthy air days now
- 4 days/yr
- Unhealthy air days in 30 yrs
- 5 days/yr
Risk factors via First Street. Map © Google.
Why this score? — see what drove the B+ grade
The composite is a weighted blend of 9 inputs, each scored 0–100. Each bar is that input's sub-score; the figure is the points it added to the 100-point composite (weight × sub-score).
- Cash flow +30.0/30.0
- ARV discount +15.0/15.0
- 1% rule +10.0/10.0
- DSCR +10.0/10.0
- Livability +4.2/5.0
- Schools +4.1/10.0
- Rent growth +3.8/5.0
- Condition / age +2.5/5.0
- Appreciation +0.0/10.0
$159,900
🖨 Deal sheet 📄 Offer letter ✓ Due diligence
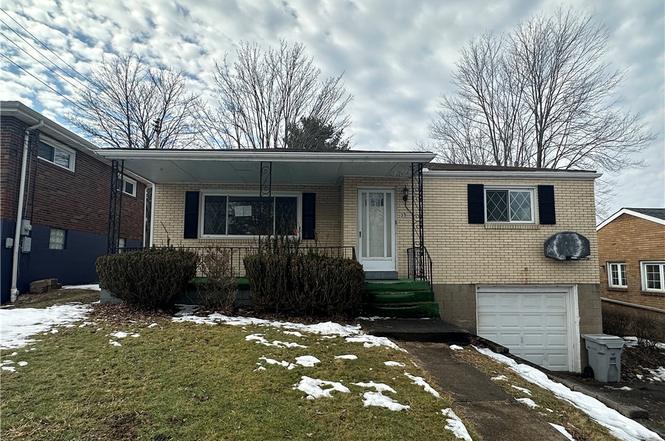
Listing remarks
Welcome to 35 Perry St, Pittsburgh, PA 15209 – a charming brick ranch offering comfortable one-level living in a convenient North Hills location! This well-maintained 3-bedroom home features 1,190 square feet of thoughtfully designed space, perfect for anyone seeking easy living with classic appeal. The solid brick exterior provides timeless character and low-maintenance durability, while the covered front porch creates a warm and inviting first impression — the perfect spot to enjoy your morning coffee or unwind in the evening. Inside, you’ll find a bright and spacious living area filled with natural light and a functional layout that flows effortlessly into the eat-in ki
Key facts
- North hills location
- Covered front porch
- Bright living area
Tags
Neighborhood map
What this means for you Summary
Snapshot
- This is a 3-bed/2.0-bath single-family listed at $160k.
Deal economics
- At list price, monthly cash flow is $1k ($14k/yr) — positive.
- The deal already cash-flows at list — no discount required.
- Meets the 1% rule at list price ($3k rent vs $160k).
Location & tenants
- Location reads 85/100 on livability (#76 in PA, #546 nationally) — a professional / high-income tenant draw. Strengths: amenities A+, commute A+, cost of living A+; Watch: crime D-.
- Shaler Area SD (suburban): math 36% / reading 59% proficiency, ranked #208 of 539 in PA (top 39%) — families likely to look elsewhere, expect single-tenant / working-renter base with shorter leases.
- Market conditions: Rents rising fast (+5.3%/yr); 26 active listings in the ZIP; 9 comparable units currently listed for rent nearby; rentals leasing fast (median 8d on market — plan ~1-2 weeks tenant-placement turnaround); solid renter incomes; 2,996 units permitted in Allegheny County in 2024 (1,588 in 5+ unit buildings).
- This rent runs 42% of the median local income ($86k/yr) — at the standard rent-burdened threshold; future hikes will face affordability resistance.
Forward outlook
- Local home prices are declining (-3.0%/yr); year-one equity from $1k of loan paydown is wiped out by about $5k of value loss. Plan a longer hold.
- At projected returns (-3.0% appreciation + 5.3% rent growth), your $45k cash investment doubles in ~4 years — after that, you're playing with house money.
Negotiation context
- Only 11 days on market — expect competitive offers; lowballing is unlikely to land.
Risks & watch-outs
- Watch-outs: built in 1957 — expect roof / HVAC / electrical / plumbing capex.
Questions for the listing agent
- Built in 1957 — when were the roof, HVAC, electrical panel, plumbing, and water heater last replaced?
- Is there a deadline driving the sale (1031 exchange, divorce, estate, relocation)? That informs how much negotiation room exists.
- Schools are B-rated — typically a magnet for longer-tenancy family renters. What's the average tenant stay here, and is there a school-zone premium baked into asking?
- Crime grade is D in this area — have there been break-ins, vandalism, or insurance claims at this property in the last 3 years? What carrier currently insures it and at what premium?
- What's the average days-on-market for RENTAL listings here right now (not sales)? A rising rental-DOM trend means longer vacancies and softer asking-rent achievability than the comps imply.
- What's the recent tenant-quality profile in this submarket — average credit score on applications, eviction rate, late-payment / NSF rate, and stable-employment percentage? A property-management company in the area should have these aggregated.
- How much new for-sale + rental construction is in the pipeline within 1–3 miles? Heavy new supply typically softens prices + rents 12–24 months out; constrained supply supports both.
Investment metrics
- 1% rule
- 1.87% ✓
- Cap rate
- 14.77%
- Cash-on-cash
- 30.28%
- DSCR
- 2.35
- GRM
- 4.5
CMA / ARV
- ARV (on-the-fly)
- $227,290
- Comps found
- 12
Show comp detail 12 sales within ~0.75 mi
| Address | Dist | Beds/Ba | Sqft | Sold | Price | $/sf | Match |
|---|---|---|---|---|---|---|---|
| 146 Buckeye Way | 0.54mi | 3/2.0 | 1,188 (-0%) | 3mo | $232,000 | $195 | 72 |
| 5322 Kent Way | 0.69mi | 2/1.5 (-1) | 1,200 (+1%) | 2mo | $400,000 | $333 | 58 |
| 5204 Carnegie St | 0.60mi | 2/1.5 (-1) | 1,222 (+3%) | 7mo | $188,718 | $154 | 54 |
| 201 Friday Rd | 0.40mi | 2/1.0 (-1) | 1,061 (-11%) | 2mo | $193,500 | $182 | 52 |
| 5237 Carnegie St | 0.57mi | 2/1.0 (-1) | 1,122 (-6%) | 4mo | $328,000 | $292 | 52 |
| 15 Old Soose Rd Unit A | 0.61mi | 3/1.5 | 1,344 (+13%) | 1mo | $83,000 | $62 | 47 |
| 5335 Carnegie St | 0.60mi | 3/2.0 | 1,326 (+11%) | 8mo | $360,000 | $271 | 46 |
| 4833 Hatfield St | 0.65mi | 2/1.5 (-1) | 1,088 (-9%) | 5mo | $220,000 | $202 | 44 |
| 5309 1/2 Keystone St | 0.64mi | 3/1.0 | 1,313 (+10%) | 7mo | $234,950 | $179 | 43 |
| 80 Parker St | 0.72mi | 4/2.5 (+1) | 1,080 (-9%) | 2mo | $206,250 | $191 | 42 |
| 498 Seavey Rd | 0.66mi | 3/1.5 | 1,353 (+14%) | 3mo | $257,000 | $190 | 42 |
| 137 Vista St | 0.55mi | 2/1.0 (-1) | 1,366 (+15%) | 5mo | $195,000 | $143 | 37 |
Match score weights: distance 35% · size 25% · config 20% · recency 20%. Top-matched comps best support the ARV.
Projected returns pro-forma
-3.0% appreciation · 5.31% rent growth · sell at horizon
- IRR
- 27.7%
- Equity multiple
- 2.19×
- Total profit
- $53,284
- Equity at exit
- $23,842
- IRR
- 36.6%
- Equity multiple
- 4.80×
- Total profit
- $170,150
- Equity at exit
- $13,825
Cash invested: $44,772 (down + closing). Projections, not guarantees.
Landlord ↔ Tenant lean methodology
- Overall (STATE)
- 62 Landlord-Friendly
- State Pennsylvania
- 62 Landlord-Friendly · EVEN
- County
- — inherits STATE
- City
- — inherits STATE
ZIP-level market 15209
- Home prices YoY
- -27.7%
- Rents YoY
- 5.3%
- Active inventory
- 26
- Price-to-rent
- 4.5×
Monthly cashflow live
- Estimated rent
- $2,990 high interval (Pro) →
- Mortgage (P&I)
- −$839
- Tax from tax record
- −$327 /mo · $3,927/yr
- Insurance
- −$67
- HOA
- −$0
- Vacancy / Maint / Mgmt
- −$628
- Net cashflow
- $1,130
Break-even live
UW: 25.0% down · 7.5% · 30yr · 1.5% tax · 5.0% vac · 8.0% maint · 8.0% mgmt
Financing live
Cash to close
- Down payment
- $39,975
- Closing costs
- $4,797
- Reserves months
- —
- Total cash needed
- —
Loan-product check · same deal, 3 products live
Conventional
25% down · 7.5% · 30yr
- Down + closing
- —
- Monthly P&I
- —
- Monthly cashflow
- —
- DSCR
- —
- Eligible?
- —
Personal DTI + credit; lowest rate.
DSCR
20% down · 8.5% · 30yr
- Down + closing
- —
- Monthly P&I
- —
- Monthly cashflow
- —
- DSCR
- —
- Eligible?
- —
No personal income docs; deal must DSCR.
Hard money
10% down · 12.0% · 12mo
- Down + closing
- —
- Monthly P&I
- —
- Monthly cashflow
- —
- DSCR
- —
- Eligible?
- —
Short-term bridge; refi at stabilization.
Rent comps 9 comps
| Address | Beds | Baths | Sqft | Rent | $/sqft | DOM | Units | Dist |
|---|---|---|---|---|---|---|---|---|
| 212 Hugel Dr Unit 1 Pittsburgh, PA | 2.0 | 1.0 | 1200 | $1,450 | $1.21 | 23d | 1 | 0.45mi |
| 5275 Butler St Pittsburgh, PA | 2.0 | 1.0–2.0 | 885 | $4,076 | $4.61 | 1d | 130 | 0.53mi |
| 404 Reetz St Pittsburgh, PA | 4.0 | 1.0 | 1500 | $2,050 | $1.37 | 16d | 1 | 0.61mi |
| 39 Prospect St Pittsburgh, PA | 2.0 | 1.0 | 1056 | $1,200 | $1.14 | 7d | 1 | 1.00mi |
| 4107 Willow St Pittsburgh, PA | 2.0 | 1.0–2.0 | 917 | $3,334 | $3.63 | 1d | 28 | 1.04mi |
| 265 46th St Pittsburgh, PA | 1.0–3.0 | 1.0–1.5 | 883 | $2,745 | $3.11 | 4d | 10 | 1.07mi |
| 147 39th St Pittsburgh, PA | 3.0 | 1.0–2.0 | 934 | $3,463 | $3.71 | 1d | 44 | 1.22mi |
| 621 Butler St Unit BS Pittsburgh, PA | 2.0 | 1.0 | 1000 | $995 | $0.99 | 43d | 1 | 1.31mi |
| 3725 Butler St Pittsburgh, PA | 2.0 | 2.0 | 1236 | $3,899 | $3.15 | 14d | 1 | 1.41mi |
Listing history 2 events
-
2026-03-02status Pending
-
2026-02-18$159,900 Active
ⓘ Source: listings_history table (triggers on properties + properties_extension) + one-shot
backfill from property_details.listing_events for pre-trigger history.
Tax reassessment forecast PA · Partial reset (capped growth)
- Current annual tax
- $3,927 · $327/mo
- Projected year-2 tax
- $3,927 · $327/mo
- Expected delta
- $0/yr ($0/mo · 0.0%)
ⓘ Screening estimate from a state-policy table — verify with the county assessor before closing.
Climate risk First Street
- Flood 1/10 Low FEMA zone X (unshaded) · 0% chance over 30 yrs
- Wildfire 1/10 Low
- Heat 4/10 Moderate 7 d/yr ≥98°F today · 17 d/yr by 30 yrs out
- Wind 2/10 Low
- Air quality 4/10 Moderate 4 unhealthy d/yr today · 5 by 30 yrs out
Nearby sold comps map
Loading sold comps map…
Walkable amenities ~0.75 mi
Loading nearby amenities…
Taxation est. · year 1
- Rental income
- $35,882
- − Mortgage interest
- −$8,957
- − Property taxes
- −$3,927
- − Insurance
- −$800
- − Repairs & maintenance
- −$2,871
- − Management
- −$2,871
- − Depreciation
- −$4,652
- Taxable income
- $11,806
- Est. tax owed @ 24.0%
- −$2,833
- After-tax cash flow
- $10,725/yr
For passive investors: Depreciation is non-cash, so a rental often shows a tax loss while cash-flowing — sheltering income. Rental losses are passive: they offset passive income freely, and up to $25,000/yr can offset ordinary (W-2) income if you actively participate and your MAGI is under $100k (phasing out to $0 by $150k); unused losses carry forward. On sale, claimed depreciation is recaptured at up to 25%, and gains may owe capital-gains tax (a 1031 exchange can defer both). Figures are a year-1 estimate at your 24.0% rate — not tax advice; consult a CPA.
Schools (NCES district)
- District
- Shaler Area SD
- NCES district ID
- 4221200
- Math proficiency
- 36% ▼ -16.00%
- Reading proficiency
- 59% ▼ -15.00%
- Median HH income
- $57,411
- Composite
- 41.33/100
- National rank
- #3506
- State rank
- #208 of 539 in PA
Livability — Pittsburgh
- Score
- 85/100
- State rank
- #76
- US rank
- #546
Category grades
Schools grade is shown separately in the Schools card above.
Census & demographics
- County
- Allegheny County · 1,022,028 people
- City population
- 564,884
- Metro
- Pittsburgh, PA
- Population (ZIP)
- 12,328
- Household income
- $85,542
- Rent vs Own
- Severe rent burden
- 356.0
Population outlook (Allegheny County) Hauer SSP2
- Today (2025)
- 1,250,282 people
- By 2030
- 1,256,482 · +0.5%
- By 2040
- 1,256,318 · +0.5%
- By 2050
- 1,244,169 · -0.5%
- By 2075
- 1,197,693 · -4.2%
- By 2100
- 1,093,187 · -12.6%
Race, ethnicity, and origin ACS 2023
- Neighborhood character
- Predominantly White (90%)
- Race & ethnicity
- White 90% Hispanic / Latino 3% Black 3% Two or more races 2% Asian 1%
- Common ancestry
- Romanian 13% Serbian 2% Italian 2%
- Foreign-born
- 3% · Canada
- Languages at home
- 96% English-only · Spanish 2% Other Indo-European 1% Arabic 1%
Political lean MEDSL · Allegheny
- 2024 margin
- Strong D (+20.3) · D 59.7% · R 39.4%
- 2008→2024 swing
- +4.8pp toward D · 2008: 15.5pp · 2024: 20.3pp
- All cycles
- 2024: D+20.3 2020: D+20.4 2016: D+16.4 2012: D+14.4 2008: D+15.5
Not yet ingested
- Civics
- —
Market trends
- HPI YoY
- ▼ -117.81%
- Current HPI
- 307.7796
- Rent YoY
- ▲ 5.31%
- Metro
- Pittsburgh, PA
- State GDP YoY
- ▲ 1.68%
- F500 in state
- 34
Industry mix (Fortune 500 HQ in PA)
| Industry | F500 HQs | Revenue |
|---|---|---|
| Healthcare | 2 | $309B |
|
||
| Insurance | 2 | $27B |
|
||
| Telecommunications / Media | 1 | $124B |
|
||
| Industrial Distribution | 1 | $22B |
|
||
| Financial Services | 1 | $20B |
|
||
| Chemicals / Materials | 1 | $18B |
|
||
Price history
2 events — show timeline
- 2026-03-02 Pending — West Penn MLS
- 2026-02-18 Listed $159,900 West Penn MLS
Property tax history
+2.1%/yrLatest (2026): $3,927 · +0.0% YoY. Source: county tax records.
Cash-flow waterfall
monthlySold comps — $/sqft
last 12 mo · ≤1 miLoading sold comps…