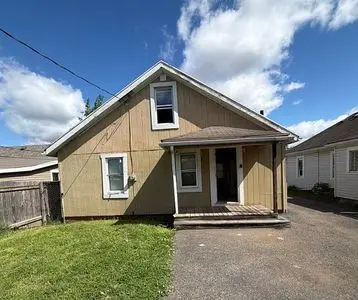
3120 Illinois Ave · Middletown, OH
Flood risk 1/10 · Minimal
- FEMA flood zone
- X (unshaded)
- Chance of flooding over 30 yrs
- 0.0%
- Est. flood insurance / yr
- $473 – $860
Fire risk 1/10 · Minimal
- Est. fire insurance / yr
- $713 – $1,323
Heat risk 4/10 · Minor
- Hot days now (above 102°F)
- 7 days/yr
- Hot days in 30 yrs
- 19 days/yr
Wind risk 2/10 · Minimal
- Chance of severe wind over 30 yrs
- 1.0%
Air-quality risk 3/10 · Minor
- Unhealthy air days now
- 2 days/yr
- Unhealthy air days in 30 yrs
- 3 days/yr
Risk factors via First Street. Map © Google.
Why this score? — see what drove the F grade
The composite is a weighted blend of 9 inputs, each scored 0–100. Each bar is that input's sub-score; the figure is the points it added to the 100-point composite (weight × sub-score).
- ARV discount +10.6/15.0
- Cash flow +7.0/30.0
- Livability +3.6/5.0
- Rent growth +2.5/5.0
- Condition / age +2.5/5.0
- 1% rule +2.1/10.0
- Schools +2.0/10.0
- DSCR +1.2/10.0
- Appreciation +0.0/10.0
$189,000
🖨 Deal sheet (PDF) 📄 Offer letter ✓ Due diligence
Listing remarks
This unique property features two separate single-family homes on a single parcel - perfect for investors or house hackers looking for immediate cash flow or owner-occupant income. One 3-bedroom, 1-bath home and One 1-bedroom, 1-bath home. Both units are separately metered for utilities, making management simple and allowing each tenant to cover their own costs. Live in one unit and rent the other to significantly offset your mortgage, or rent both for strong rental income in a solid Middletown location. Excellent potential for value-add improvements. Whether you're building your real estate portfolio or seeking an affordable way to own while earning income, this turnkey setup delivers fle
Key facts
- Turnkey setup
- 7,845 sq ft lot
- 2 parking spots
Tags
Neighborhood map
What this means for you Summary
Snapshot
- This is a 3-bed/1.0-bath single-family listed at $189k.
Deal economics
- At list price, monthly cash flow is $-276 ($-3k/yr) — negative.
- To cash-flow at today's rent, offer at most $140k (25.8% below list).
- To meet the 1% rule (rent ≥ 1% of price), the offer needs to be $134k (29.1% below list).
- Recommended offer: $134k (29.1% below list) — sets the bar for 1% rule.
Location & tenants
- Location reads 72/100 on livability (#389 in OH) — a middle-class / working-renter tenant base. Strengths: cost of living A+, housing A+, health & safety A+; Watch: crime D+, amenities D+, commute F.
- Middletown City (suburban): math 21% / reading 28% proficiency, ranked #610 of 656 in OH (top 93%) — low school quality limits family demand, transient renter base, plan for 1-2y turnover; 69% free/reduced lunch — lower-income household profile, screen leases tightly.
- Zoned schools: Miller Ridge Elementary School (math 42% / reading 42%, grade F, #1,030 of 1,584 statewide, top 66%, 406 students, 0% FRL); Middletown Middle School (math 24% / reading 33%, grade F, #580 of 654 statewide, top 89%, 941 students, 0% FRL); Middletown High School (math 18% / reading 19%, grade F, #683 of 781 statewide, top 88%, 1,753 students, 0% FRL) — zoned schools average 0% FRL vs 69% district-wide (69 pts lower); this property's tenant base skews higher-income than the district average.
- Market conditions: 72 active listings in the ZIP; 9 comparable units currently listed for rent nearby; rentals at typical pace (median 22d on market — plan ~3-4 weeks tenant-placement turnaround); 1,163 units permitted in Butler County in 2024 (356 in 5+ unit buildings).
Forward outlook
- Local home prices are declining (-3.0%/yr); year-one equity from $1k of loan paydown is wiped out by about $6k of value loss. Plan a longer hold.
Negotiation context
- It's been on market 25 days — a 2% lower offer ($186k) is reasonable based on typical stale-listing flexibility.
- 11 sale attempts since 21y ago with the ask held roughly flat each time — persistent listings suggest the price (not the market) is what's stuck; bring a comps-based counter.
- Current owner paid $46k; list at $189k implies a 306% gain — meaningful room to come down on a strong offer.
Risks & watch-outs
- Watch-outs: built in 1940 — expect roof / HVAC / electrical / plumbing capex.
Questions for the listing agent
- What do current leases actually rent for vs. the listed asking? Can we see a recent rent roll and the last 12 months of T-12 income?
- Built in 1940 — when were the roof, HVAC, electrical panel, plumbing, and water heater last replaced?
- Is there a deadline driving the sale (1031 exchange, divorce, estate, relocation)? That informs how much negotiation room exists.
- Schools are D-rated, which usually means shorter tenancies and higher turnover. Who's the typical renter profile here, and what's been the actual vacancy rate?
- Crime grade is D in this area — have there been break-ins, vandalism, or insurance claims at this property in the last 3 years? What carrier currently insures it and at what premium?
- The area grade is low — what's the realistic commute time and amenity access for the typical tenant pool here? Any planned neighborhood developments (good or bad) we should know about?
- What's the average days-on-market for RENTAL listings here right now (not sales)? A rising rental-DOM trend means longer vacancies and softer asking-rent achievability than the comps imply.
- What's the recent tenant-quality profile in this submarket — average credit score on applications, eviction rate, late-payment / NSF rate, and stable-employment percentage? A property-management company in the area should have these aggregated.
- How much new for-sale + rental construction is in the pipeline within 1–3 miles? Heavy new supply typically softens prices + rents 12–24 months out; constrained supply supports both.
Investment metrics
- 1% rule
- 0.71% ✗
- Cap rate
- 4.54%
- Cash-on-cash
- -6.26%
- DSCR
- 0.72
- GRM
- 11.8
CMA / ARV
- ARV (on-the-fly)
- $203,148
- Comps found
- 12
Show comp detail 12 sales within ~0.75 mi
| Address | Dist | Beds/Ba | Sqft | Sold | Price | $/sf | Match |
|---|---|---|---|---|---|---|---|
| 3201 Bexley Dr | 0.18mi | 3/1.0 | 1,128 (-10%) | 1mo | $235,000 | $208 | 74 |
| 3108 Buttercup Ct | 0.42mi | 3/2.0 | 1,278 (+2%) | 3mo | $235,000 | $184 | 71 |
| 1213 Ellen Dr | 0.30mi | 3/1.0 | 1,164 (-7%) | 5mo | $183,800 | $158 | 70 |
| 1007 Sorg Pl | 0.43mi | 3/1.0 | 1,308 (+4%) | 5mo | $189,000 | $144 | 68 |
| 3109 Bexley Dr | 0.22mi | 4/1.0 (+1) | 1,128 (-10%) | 2mo | $159,900 | $142 | 66 |
| 3101 Wildwood Rd | 0.32mi | 4/1.0 (+1) | 1,128 (-10%) | 0mo | $215,000 | $191 | 63 |
| 2314 Wilbraham Rd | 0.70mi | 3/1.0 | 1,193 (-5%) | 1mo | $192,000 | $161 | 58 |
| 3910 Riverview Ave | 0.63mi | 3/2.0 | 1,170 (-7%) | 2mo | $199,000 | $170 | 54 |
| 1721 Oberon Dr | 0.41mi | 3/1.0 | 1,065 (-15%) | 2mo | $91,000 | $85 | 54 |
| 2818 Shartle St | 0.59mi | 3/2.0 | 1,392 (+11%) | 3mo | $225,000 | $162 | 48 |
| 2817 Moorman Pl | 0.71mi | 3/1.5 | 1,439 (+15%) | 2mo | $232,500 | $162 | 38 |
| 1000 Jackson St | 0.63mi | 2/2.0 (-1) | 1,411 (+12%) | 7mo | $237,000 | $168 | 35 |
Match score weights: distance 35% · size 25% · config 20% · recency 20%. Top-matched comps best support the ARV.
Projected returns pro-forma
-3.0% appreciation · 3.0% rent growth · sell at horizon
- IRR
- -27.1%
- Equity multiple
- 0.09×
- Total profit
- $-48,176
- Equity at exit
- $28,181
- IRR
- -24.7%
- Equity multiple
- -0.22×
- Total profit
- $-64,445
- Equity at exit
- $16,341
Cash invested: $52,920 (down + closing). Projections, not guarantees.
Landlord ↔ Tenant lean methodology
- Overall (STATE)
- 73 Landlord-Friendly
- State Ohio
- 73 Landlord-Friendly · R+6
- County
- — inherits STATE
- City
- — inherits STATE
ZIP-level market 45042
- Active inventory
- 72
- Price-to-rent
- 11.8×
Monthly cashflow live
- Estimated rent
- $1,340 high interval (Pro) →
- Mortgage (P&I)
- −$991
- Tax from tax record
- −$264 /mo · $3,174/yr
- Insurance
- −$79
- HOA
- −$0
- Vacancy / Maint / Mgmt
- −$281
- Net cashflow
- $-276
Break-even live
Sensitivity live
| Price | -10% $-169 | -5% $-223 | +0% $-276 | +5% $-330 | +10% $-383 |
|---|---|---|---|---|---|
| Rent | -10% $-382 | -5% $-329 | +0% $-276 | +5% $-223 | +10% $-170 |
| Rate | -1.0pp $-181 | -0.5pp $-228 | base $-276 | +0.5pp $-325 | +1.0pp $-375 |
UW: 25.0% down · 7.5% · 30yr · 1.5% tax · 5.0% vac · 8.0% maint · 8.0% mgmt
Financing live
Cash to close
- Down payment
- $47,250
- Closing costs
- $5,670
- Reserves months
- —
- Total cash needed
- —
Loan-product check · same deal, 3 products live
Conventional
25% down · 7.5% · 30yr
- Down + closing
- —
- Monthly P&I
- —
- Monthly cashflow
- —
- DSCR
- —
- Eligible?
- —
Personal DTI + credit; lowest rate.
DSCR
20% down · 8.5% · 30yr
- Down + closing
- —
- Monthly P&I
- —
- Monthly cashflow
- —
- DSCR
- —
- Eligible?
- —
No personal income docs; deal must DSCR.
Hard money
10% down · 12.0% · 12mo
- Down + closing
- —
- Monthly P&I
- —
- Monthly cashflow
- —
- DSCR
- —
- Eligible?
- —
Short-term bridge; refi at stabilization.
Rent comps 9 comps
| Address | Beds | Baths | Sqft | Rent | $/sqft | DOM | Units | Dist |
|---|---|---|---|---|---|---|---|---|
| 2002 Huntington St Unit 2002H Middletown, OH | 3.0 | 2.0 | 1216 | $1,200 | $0.99 | 21d | 1 | 0.51mi |
| 2513 Aspen St Unit 2513A Middletown, OH | 3.0 | 2.0 | 1056 | $1,150 | $1.09 | 16d | 1 | 0.73mi |
| 2201 Wilbraham Rd Middletown, OH | 3.0 | 1.0 | 1300 | $1,549 | $1.19 | 19d | 1 | 0.92mi |
| 108 Shafor St Middletown, OH | 2.0 | 1.0 | 1110 | $925 | $0.83 | 13d | 1 | 1.29mi |
| 108 Shafor St Middletown, OH | 2.0 | 1.0 | 1110 | $925 | $0.83 | 22d | 1 | 1.29mi |
| 1820 Clarendon Ave Middletown, OH | 2.0 | 1.0 | 1040 | $1,200 | $1.15 | 45d | 1 | 1.30mi |
| 11 Redbud Dr Middletown, OH | 4.0 | 3.0 | 1562 | $2,175 | $1.39 | 23d | 1 | 1.33mi |
| 202 Harrison St Middletown, OH | 2.0 | 1.0 | 1015 | $895 | $0.88 | 45d | 1 | 1.35mi |
| 206 N Sutphin St Middletown, OH | 2.0 | 1.0 | 900 | $1,400 | $1.56 | 45d | 1 | 1.39mi |
Listing history 35 events
-
2026-06-21days on market $189,000 Active 25 DOM
-
2026-06-18days on market $189,000 Active 22 DOM
-
2026-06-17days on market $189,000 Active 21 DOM
-
2026-06-16days on market $189,000 Active 20 DOM
-
2026-06-15days on market $189,000 Active 19 DOM
-
2026-06-13pricedays on market $189,000 Active 17 DOM
-
2026-06-09days on market $199,000 Active 13 DOM
-
2026-06-08days on market $199,000 Active 12 DOM
-
2026-06-07days on market $199,000 Active 11 DOM
-
2026-06-03days on market $199,000 Active 7 DOM
-
2026-06-02days on market $199,000 Active 6 DOM
-
2026-06-01days on market $199,000 Active 5 DOM
-
2026-05-31days on market $199,000 Active 4 DOM
-
2026-05-17$184,900 Active
-
2011-05-30historical
-
2011-03-11$69,900
-
2011-02-10historical
-
2011-02-10historical
-
2010-11-17$69,900
-
2010-11-16$69,900
-
2010-09-04historical
-
2010-09-04historical
-
2009-12-04$69,900
-
2009-12-04$69,900
-
2009-05-01historical
-
2009-01-27$64,900
-
2009-01-01historical
-
2008-10-14$69,900
-
2006-06-29historical
-
2006-03-22$79,900
-
2006-03-22historical
-
2006-01-17$79,900
-
2006-01-01historical
-
2005-09-01$75,000
-
1993-10-11soldstatus $46,500
ⓘ Source: listings_history table (triggers on properties + properties_extension) + one-shot
backfill from property_details.listing_events for pre-trigger history.
Tax reassessment forecast OH · Partial reset (capped growth)
- Current annual tax
- $3,174 · $264/mo
- Projected year-2 tax
- $3,174 · $264/mo
- Expected delta
- $0/yr ($0/mo · 0.0%)
ⓘ Screening estimate from a state-policy table — verify with the county assessor before closing.
Climate risk First Street
- Flood 1/10 Low FEMA zone X (unshaded) · 0% chance over 30 yrs
- Wildfire 1/10 Low
- Heat 4/10 Moderate 7 d/yr ≥102°F today · 19 d/yr by 30 yrs out
- Wind 2/10 Low 100% chance of damaging wind over 30 yrs
- Air quality 3/10 Moderate 2 unhealthy d/yr today · 3 by 30 yrs out
Nearby sold comps map
Loading sold comps map…
Walkable amenities ~0.75 mi
Loading nearby amenities…
Taxation est. · year 1
- Rental income
- $16,074
- − Mortgage interest
- −$10,587
- − Property taxes
- −$3,174
- − Insurance
- −$945
- − Repairs & maintenance
- −$1,286
- − Management
- −$1,286
- − Depreciation
- −$5,498
- Taxable loss
- −$6,701
- Est. tax savings @ 24.0%
- +$1,608
- After-tax cash flow
- $-1,705/yr
For passive investors: Depreciation is non-cash, so a rental often shows a tax loss while cash-flowing — sheltering income. Rental losses are passive: they offset passive income freely, and up to $25,000/yr can offset ordinary (W-2) income if you actively participate and your MAGI is under $100k (phasing out to $0 by $150k); unused losses carry forward. On sale, claimed depreciation is recaptured at up to 25%, and gains may owe capital-gains tax (a 1031 exchange can defer both). Figures are a year-1 estimate at your 24.0% rate — not tax advice; consult a CPA.
Schools (NCES district)
- District
- Middletown City
- NCES district ID
- 3904440
- Math proficiency
- 21% ▼ -17.00%
- Reading proficiency
- 28% ▼ -15.00%
- Median HH income
- $36,650
- Composite
- 20.35/100
- National rank
- #8605
- State rank
- #610 of 656 in OH
Livability — Middletown
- Score
- 72/100
- State rank
- #389
- US rank
- #6338
Category grades
Schools grade is shown separately in the Schools card above.
Census & demographics
- Census place
- Middletown, OH
- County
- Butler County · 381,674 people
- City population
- 96,117
- Metro
- Cincinnati, OH-KY-IN
- Population (ZIP)
- 27,652
- Household income
- $69,520
- Rent vs Own
- Severe rent burden
- 751.0
Population outlook (Butler County) Hauer SSP2
- Today (2025)
- 387,706 people
- By 2030
- 392,028 · +1.1%
- By 2040
- 395,307 · +2.0%
- By 2050
- 391,116 · +0.9%
- By 2075
- 378,642 · -2.3%
- By 2100
- 343,248 · -11.5%
Race, ethnicity, and origin ACS 2023
- Neighborhood character
- Predominantly White (88%)
- Race & ethnicity
- White 88% Two or more races 5% Black 4% Hispanic / Latino 3%
- Common ancestry
- Slovak 2% Lithuanian 2% Italian 1%
- Foreign-born
- 2% · Canada, Jamaica, China
- Languages at home
- 96% English-only · Spanish 2%
Political lean MEDSL · Butler
- 2024 margin
- Strong R (+26.3) · D 36.4% · R 62.7%
- 2008→2024 swing
- -3.6pp toward R · 2008: -22.6pp · 2024: -26.3pp
- All cycles
- 2024: R+26.3 2020: R+24.0 2016: R+28.3 2012: R+26.2 2008: R+22.6
Not yet ingested
- Civics
- —
Market trends
- HPI YoY
- ▼ -169.01%
- Current HPI
- 217.3827
- Rent YoY
- —
- Metro
- Cincinnati, OH-KY-IN
- State GDP YoY
- ▲ 1.98%
- F500 in state
- 48
Industry mix (Fortune 500 HQ in OH)
| Industry | F500 HQs | Revenue |
|---|---|---|
| Insurance | 3 | $145B |
|
||
| Industrial Machinery | 3 | $49B |
|
||
| Financial Services | 3 | $24B |
|
||
| Consumer Goods | 2 | $93B |
|
||
| Aerospace / Defense | 2 | $47B |
|
||
| Utilities | 2 | $33B |
|
||
Price history
+297.6% since first listed22 events — show timeline
- 2026-05-17 Listed $184,900 FSBO.com
- 2011-05-30 Listing Removed — Cincy MLS
- 2011-03-11 Listed $69,900 Cincy MLS
- 2011-02-10 Listing Removed — Cincy MLS
- 2011-02-10 Listing Removed — Dayton MLS
- 2010-11-17 Listed $69,900 Dayton MLS
- 2010-11-16 Listed $69,900 Cincy MLS
- 2010-09-04 Listing Removed — Cincy MLS
- 2010-09-04 Listing Removed — Dayton MLS
- 2009-12-04 Listed $69,900 Cincy MLS
- 2009-12-04 Listed $69,900 Dayton MLS
- 2009-05-01 Listing Removed — Cincy MLS
- 2009-01-27 Listed $64,900 Cincy MLS
- 2009-01-01 Listing Removed — Cincy MLS
- 2008-10-14 Listed $69,900 Cincy MLS
- 2006-06-29 Listing Removed — Cincy MLS
- 2006-03-22 Listing Removed — Cincy MLS
- 2006-03-22 Listed $79,900 Cincy MLS
- 2006-01-17 Listed $79,900 Cincy MLS
- 2006-01-01 Listing Removed — Cincy MLS
- 2005-09-01 Listed $75,000 Cincy MLS
- 1993-10-11 Sold (Public Records) $46,500 Public Records
Property tax history
+6.0%/yrLatest (2025): $3,174 · +2.7% YoY. Source: county tax records.
Cash-flow waterfall
monthlySold comps — $/sqft
last 12 mo · ≤1 miLoading sold comps…