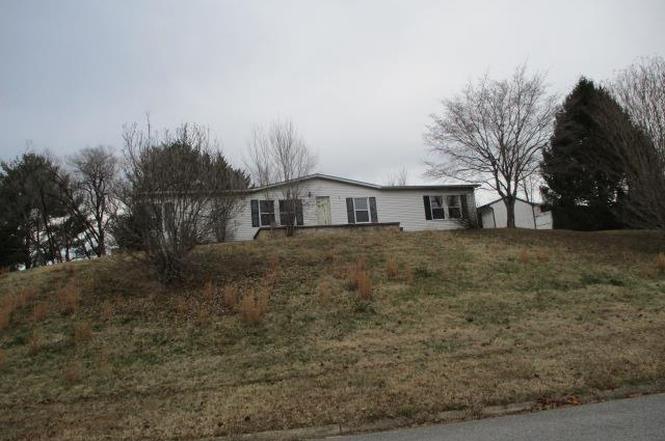
274 Hillside Dr · Buena Vista, VA
Flood risk 1/10 · Minimal
- FEMA flood zone
- X (unshaded)
- Chance of flooding over 30 yrs
- 0.0%
- Est. flood insurance / yr
- $507 – $1,088
Fire risk 2/10 · Minimal
- Est. fire insurance / yr
- $666 – $1,236
Heat risk 5/10 · Moderate
- Hot days now (above 102°F)
- 7 days/yr
- Hot days in 30 yrs
- 18 days/yr
Wind risk 2/10 · Minimal
- Chance of severe wind over 30 yrs
- 1.0%
Air-quality risk 2/10 · Minimal
- Unhealthy air days now
- 0 days/yr
- Unhealthy air days in 30 yrs
- 1 days/yr
Risk factors via First Street. Map © Google.
Why this score? — see what drove the B- grade
The composite is a weighted blend of 9 inputs, each scored 0–100. Each bar is that input's sub-score; the figure is the points it added to the 100-point composite (weight × sub-score).
- Cash flow +27.8/30.0
- DSCR +9.8/10.0
- ARV discount +7.5/15.0
- 1% rule +7.2/10.0
- Schools +5.0/10.0
- Livability +3.6/5.0
- Rent growth +2.5/5.0
- Condition / age +2.5/5.0
- Appreciation +0.0/10.0
$111,150
🖨 Deal sheet 📄 Offer letter ✓ Due diligence
Listing remarks MLS
Great views! Irregular lot, see plat.
Key facts
- 0.63 acre lot
- Built 1990
- Listed 125 days
Property features AI
Finance
- Other: Lot is approximately 0.63 acre; Zoning: R2
Exterior
- Parking: Attached parking
- Security: Smoke detector(s)
- Utilities: Public water; Public sewer
- Home design: Mobile home; Residential property; One story (above-grade finished area reported)
- Construction: Vinyl siding; Composition roof
- Exterior features: Front porch
Interior
- Bedrooms: 3 main-level bedrooms
- Flooring: Vinyl flooring; Carpet
- Bathrooms: 2 full bathrooms (2 on the main level)
- Heating & cooling: Oil and electric heating; Ceiling fan(s)
- Interior features: Smoke detector(s); Crawl space basement
Neighborhood map
What this means for you Summary
Snapshot
- This is a 3-bed/2.0-bath manufactured listed at $111k.
Deal economics
- At list price, monthly cash flow is $338 ($4k/yr) — positive.
- The deal already cash-flows at list — no discount required.
- Meets the 1% rule at list price ($1k rent vs $111k).
- Recommended offer: $98k (12.0% below list) — sets the bar for market timing.
- Cap rate 9.9% vs local median 3.4% in Buena Vista — top-decile yield for the area; either an underpriced asset or a hidden risk that comps aren't pricing in. Stress-test before assuming the spread holds.
Location & tenants
- Location reads 71/100 on livability (#217 in VA) — a middle-class / working-renter tenant base. Strengths: crime A+, cost of living A+, housing A; Watch: health & safety C-, amenities F, commute F.
- Buena Vista City Public School District (rural): math 54% / reading 68% proficiency, ranked #61 of 131 in VA (top 47%) — acceptable for families but not a draw, mixed tenant base, ~2y average lease.
- Zoned schools: Enderly Heights Elementary (math 52% / reading 62%, grade C+, #597 of 1,108 statewide, top 57%, 191 students, 86% FRL); Parry Mccluer Middle (math 72% / reading 77%, grade A, #50 of 342 statewide, top 16%, 119 students, 87% FRL); Parry Mccluer High (math 37% / reading 67%, grade D+, #295 of 319 statewide, top 93%, 330 students, 86% FRL) — zoned schools average 86% FRL vs 44% district-wide (42 pts higher); higher-poverty schools than district average — tighter screening recommended.
- Market conditions: 56 active listings in the ZIP; 18 units permitted in Buena Vista city in 2024 (0 in 5+ unit buildings).
Forward outlook
- Local home prices are declining (-3.0%/yr); year-one equity from $768 of loan paydown is wiped out by about $3k of value loss. Plan a longer hold.
- Buena Vista County population projected to shrink 4% by 2050 — rents likely to lag national; underwrite the cash flow, not the appreciation.
- At projected returns (-3.0% appreciation + 3.0% rent growth), your $31k cash investment doubles in ~9 years — after that, you're playing with house money.
Negotiation context
- It's been on market 125 days — a 12% lower offer ($98k) is reasonable based on typical stale-listing flexibility.
- 4 sale attempts since 21y ago; this cycle's ask has dropped $41k (27%) from the opening price — seller is motivated, your offer sets the floor, not the list.
- Current owner paid $95k; 17% above their basis — modest negotiation headroom, anchor on the comps not their cost.
Risks & watch-outs
- Climate carrying-cost: extreme-heat days projected 7→18/yr by 2055 (HVAC capex compounding) — expect insurance premiums to compound above CPI over the hold.
Questions for the listing agent
- It's been on market 125 days. Have you received any prior offers? Is the seller open to a 12% concession, seller financing, or rate buy-down credit?
- Why hasn't it sold? Are there any deal-killer items the seller is aware of (foundation, flood, title, zoning, code violations)?
- Is there a deadline driving the sale (1031 exchange, divorce, estate, relocation)? That informs how much negotiation room exists.
- Schools are B-rated — typically a magnet for longer-tenancy family renters. What's the average tenant stay here, and is there a school-zone premium baked into asking?
- What's the average days-on-market for RENTAL listings here right now (not sales)? A rising rental-DOM trend means longer vacancies and softer asking-rent achievability than the comps imply.
- What's the recent tenant-quality profile in this submarket — average credit score on applications, eviction rate, late-payment / NSF rate, and stable-employment percentage? A property-management company in the area should have these aggregated.
- How much new for-sale + rental construction is in the pipeline within 1–3 miles? Heavy new supply typically softens prices + rents 12–24 months out; constrained supply supports both.
Investment metrics
- 1% rule
- 1.22% ✓
- Cap rate
- 9.94%
- Cash-on-cash
- 13.02%
- DSCR
- 1.58
- GRM
- 6.9
CMA / ARV
No comps found within radius.
Projected returns pro-forma
-3.0% appreciation · 3.0% rent growth · sell at horizon
- IRR
- 2.9%
- Equity multiple
- 1.11×
- Total profit
- $3,490
- Equity at exit
- $16,573
- IRR
- 12.5%
- Equity multiple
- 1.99×
- Total profit
- $30,716
- Equity at exit
- $9,610
Cash invested: $31,122 (down + closing). Projections, not guarantees.
Landlord ↔ Tenant lean methodology
- Overall (STATE)
- 55 Moderately Landlord-Leaning
- State Virginia
- 55 Moderately Landlord-Leaning · D+2
- County
- — inherits STATE
- City
- — inherits STATE
ZIP-level market 24416
- Home prices YoY
- -33.8%
- Active inventory
- 56
- Price-to-rent
- 6.9×
Monthly cashflow live
- Estimated rent
- $1,351 medium interval (Pro) →
- Mortgage (P&I)
- −$583
- Tax from tax record
- −$100 /mo · $1,205/yr
- Insurance
- −$46
- HOA
- −$0
- Vacancy / Maint / Mgmt
- −$284
- Net cashflow
- $338
Break-even live
UW: 25.0% down · 7.5% · 30yr · 1.5% tax · 5.0% vac · 8.0% maint · 8.0% mgmt
Financing live
Cash to close
- Down payment
- $27,788
- Closing costs
- $3,334
- Reserves months
- —
- Total cash needed
- —
Loan-product check · same deal, 3 products live
Conventional
25% down · 7.5% · 30yr
- Down + closing
- —
- Monthly P&I
- —
- Monthly cashflow
- —
- DSCR
- —
- Eligible?
- —
Personal DTI + credit; lowest rate.
DSCR
20% down · 8.5% · 30yr
- Down + closing
- —
- Monthly P&I
- —
- Monthly cashflow
- —
- DSCR
- —
- Eligible?
- —
No personal income docs; deal must DSCR.
Hard money
10% down · 12.0% · 12mo
- Down + closing
- —
- Monthly P&I
- —
- Monthly cashflow
- —
- DSCR
- —
- Eligible?
- —
Short-term bridge; refi at stabilization.
Listing history 7 events
-
2026-06-18days on market $111,150 Active 125 DOM
-
2026-06-17days on market $111,150 Active 124 DOM
-
2026-06-16days on market $111,150 Active 123 DOM
-
2026-06-15days on market $111,150 Active 122 DOM
-
2026-06-14days on market $111,150 Active 120 DOM
-
2026-06-13remarks 544-char remark
-
2026-06-13$111,150 Active 119 DOM
ⓘ Source: listings_history table (triggers on properties + properties_extension) + one-shot
backfill from property_details.listing_events for pre-trigger history.
Tax reassessment forecast VA · Resets to sale price
- Current annual tax
- $1,205 · $100/mo
- Projected year-2 tax
- $1,205 · $100/mo
- Expected delta
- $0/yr ($0/mo · 0.0%)
ⓘ Screening estimate from a state-policy table — verify with the county assessor before closing.
Climate risk First Street
- Flood 1/10 Low FEMA zone X (unshaded) · 0% chance over 30 yrs
- Wildfire 2/10 Low
- Heat 5/10 Major 7 d/yr ≥102°F today · 18 d/yr by 30 yrs out
- Wind 2/10 Low 100% chance of damaging wind over 30 yrs
- Air quality 2/10 Low 0 unhealthy d/yr today · 1 by 30 yrs out
Nearby sold comps map
Loading sold comps map…
Walkable amenities ~0.75 mi
Loading nearby amenities…
Taxation est. · year 1
- Rental income
- $16,212
- − Mortgage interest
- −$6,226
- − Property taxes
- −$1,205
- − Insurance
- −$556
- − Repairs & maintenance
- −$1,297
- − Management
- −$1,297
- − Depreciation
- −$3,233
- Taxable income
- $2,397
- Est. tax owed @ 24.0%
- −$575
- After-tax cash flow
- $3,476/yr
For passive investors: Depreciation is non-cash, so a rental often shows a tax loss while cash-flowing — sheltering income. Rental losses are passive: they offset passive income freely, and up to $25,000/yr can offset ordinary (W-2) income if you actively participate and your MAGI is under $100k (phasing out to $0 by $150k); unused losses carry forward. On sale, claimed depreciation is recaptured at up to 25%, and gains may owe capital-gains tax (a 1031 exchange can defer both). Figures are a year-1 estimate at your 24.0% rate — not tax advice; consult a CPA.
Schools (NCES district)
- District
- Buena Vista City Public School District
- NCES district ID
- 5100560
- Math proficiency
- 54% ▼ -29.00%
- Reading proficiency
- 68% ▼ -5.00%
- Median HH income
- $35,243
- Composite
- 50.44/100
- National rank
- #1866
- State rank
- #61 of 131 in VA
Livability — Buena Vista
- Score
- 71/100
- State rank
- #217
- US rank
- #7146
Category grades
Schools grade is shown separately in the Schools card above.
Census & demographics
- Census place
- Buena Vista, VA
- County
- Buena Vista City · 9,082 people
- City population
- 9,082
- Metro
- nan
- Population (ZIP)
- 9,082
- Household income
- $54,882
- Rent vs Own
- Severe rent burden
- 239.0
Population outlook (Buena Vista County) Hauer SSP2
- Today (2025)
- 6,454 people
- By 2030
- 6,395 · -0.9%
- By 2040
- 6,271 · -2.8%
- By 2050
- 6,166 · -4.5%
- By 2075
- 6,287 · -2.6%
- By 2100
- 6,282 · -2.7%
Race, ethnicity, and origin ACS 2023
- Neighborhood character
- Predominantly White (85%)
- Race & ethnicity
- White 85% Two or more races 9% Hispanic / Latino 4% Black 2%
- Common ancestry
- Serbian 3% Slovak 3% Lithuanian 2%
- Foreign-born
- 1% · Canada
Political lean MEDSL · Buena Vista
- 2024 margin
- Solid R (+44.5) · D 26.9% · R 71.3% · Other 1.8%
- 2008→2024 swing
- -37.3pp toward R · 2008: -7.2pp · 2024: -44.5pp
- All cycles
- 2024: R+44.5 2020: R+37.4 2016: R+30.9 2012: R+25.5 2008: R+7.2
Not yet ingested
- Civics
- —
Market trends
- HPI YoY
- ▼ -73.06%
- Current HPI
- 143.115
- Rent YoY
- —
- Metro
- nan
- State GDP YoY
- ▲ 2.40%
- F500 in state
- 50
Industry mix (Fortune 500 HQ in VA)
| Industry | F500 HQs | Revenue |
|---|---|---|
| Aerospace / Defense | 4 | $236B |
|
||
| Technology / Defense | 3 | $32B |
|
||
| Financial Services | 2 | $176B |
|
||
| Utilities | 2 | $27B |
|
||
| Insurance | 2 | $25B |
|
||
| Technology | 2 | $15B |
|
||
Price history
+17.0% since first listed9 events — show timeline
- 2026-06-11 Relisted — DRRAR
- 2026-06-11 Price Changed $111,150 DRRAR
- 2026-04-07 Price Changed $123,500 DRRAR
- 2026-03-23 Relisted — DRRAR
- 2026-02-06 Price Changed $136,800 DRRAR
- 2025-12-24 Listed $152,000 DRRAR
- 2006-06-21 Sold (Public Records) $95,000 Public Records
- 2006-06-21 Sold (MLS) $95,000 GAAR
- 2005-08-30 Listed $95,000 GAAR
Property tax history
+5.6%/yrLatest (2025): $1,205 · +120.8% YoY. Source: county tax records.
Cash-flow waterfall
monthlySold comps — $/sqft
last 12 mo · ≤1 miLoading sold comps…