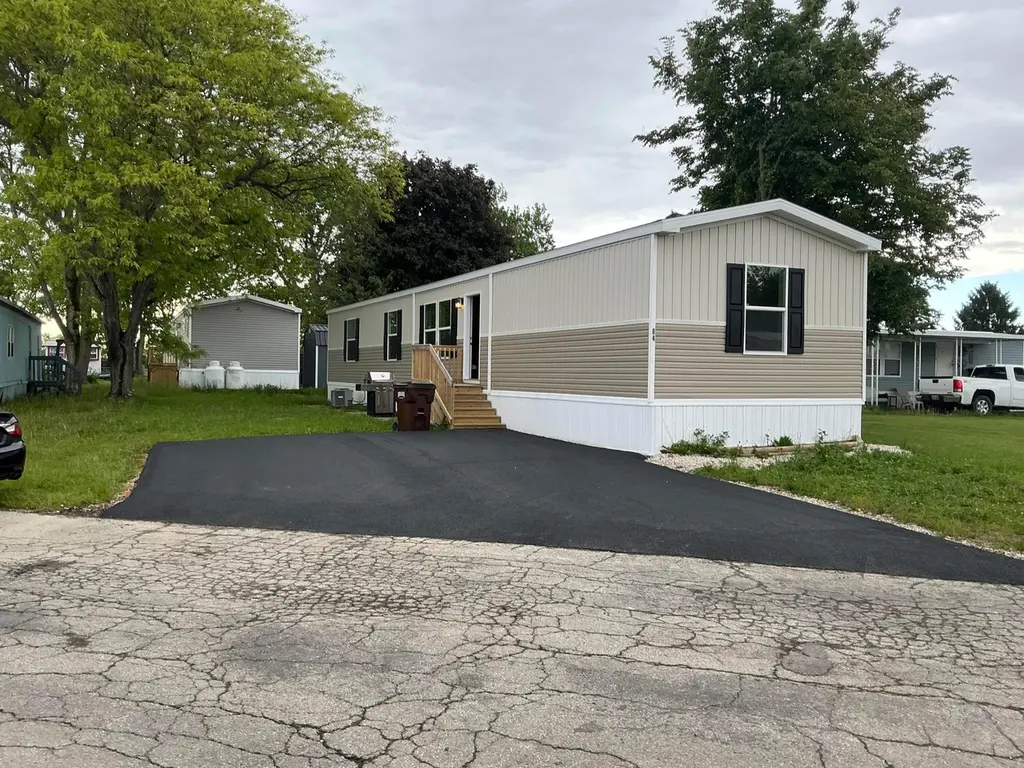
8565 Smith Calhoun Rd #84 · Plain City, OH
Flood risk 1/10 · Minimal
- FEMA flood zone
- X (unshaded)
- Chance of flooding over 30 yrs
- 0.0%
- Est. flood insurance / yr
- $473 – $860
Fire risk 1/10 · Minimal
- Est. fire insurance / yr
- $713 – $1,323
Heat risk 3/10 · Minor
- Hot days now (above 100°F)
- 7 days/yr
- Hot days in 30 yrs
- 18 days/yr
Wind risk 2/10 · Minimal
- Chance of severe wind over 30 yrs
- 1.0%
Air-quality risk 3/10 · Minor
- Unhealthy air days now
- 3 days/yr
- Unhealthy air days in 30 yrs
- 4 days/yr
Risk factors via First Street. Map © Google.
Why this score? — see what drove the B grade
The composite is a weighted blend of 9 inputs, each scored 0–100. Each bar is that input's sub-score; the figure is the points it added to the 100-point composite (weight × sub-score).
- Cash flow +30.0/30.0
- 1% rule +10.0/10.0
- DSCR +10.0/10.0
- ARV discount +7.5/15.0
- Schools +6.2/10.0
- Livability +4.0/5.0
- Condition / age +4.0/5.0
- Rent growth +2.5/5.0
- Appreciation +0.0/10.0
$94,900
🖨 Deal sheet 📄 Offer letter ✓ Due diligence
Listing remarks
This practically brand new Clayton Clark model is clean and ready for a new owner. The modern flare this home offers will blow you away! The unit offers 3 bedrooms 2 full baths. Oversized corner lot with a paved drive way for convenience. Suburban mobile home park is located just 7 minutes from Plain City, Dublin, and Hilliard which makes the location convenient for anyone. Call to set up your showing. All buyers must obtain park approval before possession can take place.
Key facts
- Oversized corner lot
- Paved drive way
- Convenient location
Tags
Property features AI
Finance
- Other: Located in Suburban Clearview Mobile Home Park
- HOA & community: Homeowners association with a $625 monthly fee; Association fee includes snow removal
Exterior
- Utilities: Public water; Public sewer
- Home design: One-story mobile home; Other residential without deeded land; No common walls; Built in 2024
- Construction: Other foundation
- Exterior features: 66 ft by 16 ft mobile home
Interior
- Bedrooms: Three main-level bedrooms
- Flooring: Vinyl flooring
- Bathrooms: Two full bathrooms
- Heating & cooling: Central air conditioning
- Interior features: Insulated windows throughout
Neighborhood map
What this means for you Summary
Snapshot
- This is a 3-bed/2.0-bath single-family listed at $95k. Condition is rated good.
Deal economics
- At list price, monthly cash flow is $498 ($6k/yr) — positive.
- The deal already cash-flows at list — no discount required.
- Meets the 1% rule at list price ($2k rent vs $95k).
- Recommended offer: $92k (3.0% below list) — sets the bar for market timing.
- Cap rate 12.6% vs local median 3.2% in Plain City — top-decile yield for the area; either an underpriced asset or a hidden risk that comps aren't pricing in. Stress-test before assuming the spread holds.
Location & tenants
- Location reads 79/100 on livability (#146 in OH, #2,254 nationally) — a middle-class / working-renter tenant base. Strengths: crime A+, cost of living A+, housing A+; Watch: amenities F, commute F.
- Jonathan Alder Local (rural): math 68% / reading 74% proficiency, ranked #121 of 656 in OH (top 18%) — strong family-tenant draw, lease renewals of 3-5y typical.
- Market conditions: 414 active listings in the ZIP; high-income renter base; 530 units permitted in Madison County in 2024 (120 in 5+ unit buildings).
Forward outlook
- Local home prices are declining (-3.0%/yr); year-one equity from $656 of loan paydown is wiped out by about $3k of value loss. Plan a longer hold.
- Madison County population projected at +4% by 2050 — modest demand growth; plan on rents tracking national, not racing it.
- At projected returns (-3.0% appreciation + 3.0% rent growth), your $27k cash investment doubles in ~6 years — after that, you're playing with house money.
Negotiation context
- It's been on market 40 days — a 3% lower offer ($92k) is reasonable based on typical stale-listing flexibility.
Risks & watch-outs
- Watch-outs: HOA is 28% of rent.
Questions for the listing agent
- It's been on market 40 days. Have you received any prior offers? Is the seller open to a 3% concession, seller financing, or rate buy-down credit?
- What does the HOA fee cover, when was the last increase, and are there any pending special assessments or reserve-fund shortfalls?
- Is there a deadline driving the sale (1031 exchange, divorce, estate, relocation)? That informs how much negotiation room exists.
- Schools are A-rated — typically a magnet for longer-tenancy family renters. What's the average tenant stay here, and is there a school-zone premium baked into asking?
- What's the average days-on-market for RENTAL listings here right now (not sales)? A rising rental-DOM trend means longer vacancies and softer asking-rent achievability than the comps imply.
- What's the recent tenant-quality profile in this submarket — average credit score on applications, eviction rate, late-payment / NSF rate, and stable-employment percentage? A property-management company in the area should have these aggregated.
- How much new for-sale + rental construction is in the pipeline within 1–3 miles? Heavy new supply typically softens prices + rents 12–24 months out; constrained supply supports both.
Investment metrics
- 1% rule
- 2.37% ✓
- Cap rate
- 12.58%
- Cash-on-cash
- 22.47%
- DSCR
- 2.00
- GRM
- 3.5
CMA / ARV
- ARV (median comp)
- $55,297
- List price
- $94,900
- Delta
- 71.62%
- Verdict
- OVERPRICED
- Comps
- 20 within 1.0 mi
Show comp detail 12 sales within ~0.75 mi
| Address | Dist | Beds/Ba | Sqft | Sold | Price | $/sf | Match |
|---|---|---|---|---|---|---|---|
| 8565 Smith Calhoun Rd Unit 53-0 | 0.08mi | 3/2.0 | 1,190 (+13%) | 3mo | $105,800 | $89 | 72 |
| 8565 Smith Calhoun Rd Unit 71-0 | 0.26mi | 3/2.0 | 1,050 (-1%) | 22mo | $84,900 | $81 | 68 |
| 8565 Smith Calhoun Rd Lot 55 | 0.11mi | 2/2.0 (-1) | 924 (-12%) | 2mo | $37,000 | $40 | 67 |
| 9030 Amity Pike | 0.41mi | 3/1.0 | 1,128 (+7%) | 1mo | $340,000 | $301 | 65 |
| 8565 Smith Calhoun Rd #5 | 0.11mi | 3/2.0 | 1,190 (+13%) | 11mo | $80,000 | $67 | 65 |
| 8565 Smith-calhoun Rd #114 | 0.26mi | 3/2.0 | 1,080 (+2%) | 24mo | $62,000 | $57 | 64 |
| 8565 Smith Calhoun Rd #127 | 0.26mi | 2/2.0 (-1) | 1,050 (-1%) | 23mo | $52,500 | $50 | 63 |
| 8565 Smith Calhoun Rd Unit 78-R | 0.26mi | 3/2.0 | 990 (-6%) | 22mo | $79,900 | $81 | 59 |
| 8565 Smith Calhoun Rd #163 | 0.26mi | 2/1.0 (-1) | 980 (-7%) | 10mo | $39,000 | $40 | 59 |
| 8565 Smith Calhoun Rd #50 | 0.26mi | 3/1.0 | 1,120 (+6%) | 18mo | $50,000 | $45 | 59 |
| 8565 Smith Calhoun Rd #137 | 0.26mi | 3/1.0 | 1,120 (+6%) | 19mo | $22,500 | $20 | 58 |
| 8565 Smith Calhoun Rd #171 | 0.17mi | 2/1.0 (-1) | 980 (-7%) | 22mo | $56,500 | $58 | 53 |
Match score weights: distance 35% · size 25% · config 20% · recency 20%. Top-matched comps best support the ARV.
Projected returns pro-forma
-3.0% appreciation · 3.0% rent growth · sell at horizon
- IRR
- 15.6%
- Equity multiple
- 1.63×
- Total profit
- $16,727
- Equity at exit
- $14,150
- IRR
- 24.5%
- Equity multiple
- 3.15×
- Total profit
- $57,065
- Equity at exit
- $8,205
Cash invested: $26,572 (down + closing). Projections, not guarantees.
Landlord ↔ Tenant lean methodology
- Overall (STATE)
- 73 Landlord-Friendly
- State Ohio
- 73 Landlord-Friendly · R+6
- County
- — inherits STATE
- City
- — inherits STATE
ZIP-level market 43064
- Active inventory
- 414
- Price-to-rent
- 3.5×
Monthly cashflow live
- Estimated rent
- $2,251 medium interval (Pro) →
- Mortgage (P&I)
- −$498
- Tax est. 1.5%
- −$119 /mo · $1,424/yr
- Insurance
- −$40
- HOA
- −$625
- Vacancy / Maint / Mgmt
- −$473
- Net cashflow
- $498
Break-even live
UW: 25.0% down · 7.5% · 30yr · 1.5% tax · 5.0% vac · 8.0% maint · 8.0% mgmt
Financing live
Cash to close
- Down payment
- $23,725
- Closing costs
- $2,847
- Reserves months
- —
- Total cash needed
- —
Loan-product check · same deal, 3 products live
Conventional
25% down · 7.5% · 30yr
- Down + closing
- —
- Monthly P&I
- —
- Monthly cashflow
- —
- DSCR
- —
- Eligible?
- —
Personal DTI + credit; lowest rate.
DSCR
20% down · 8.5% · 30yr
- Down + closing
- —
- Monthly P&I
- —
- Monthly cashflow
- —
- DSCR
- —
- Eligible?
- —
No personal income docs; deal must DSCR.
Hard money
10% down · 12.0% · 12mo
- Down + closing
- —
- Monthly P&I
- —
- Monthly cashflow
- —
- DSCR
- —
- Eligible?
- —
Short-term bridge; refi at stabilization.
HOA detail
- Monthly dues
- $625 · $7,500/yr
Listing history 13 events
-
2026-06-18days on market $94,900 Active 40 DOM
-
2026-06-17days on market $94,900 Active 39 DOM
-
2026-06-16days on market $94,900 Active 38 DOM
-
2026-06-15days on market $94,900 Active 37 DOM
-
2026-06-13days on market $94,900 Active 35 DOM
-
2026-06-09days on market $94,900 Active 31 DOM
-
2026-06-08days on market $94,900 Active 30 DOM
-
2026-06-07days on market $94,900 Active 29 DOM
-
2026-06-03days on market $94,900 Active 25 DOM
-
2026-06-02days on market $94,900 Active 24 DOM
-
2026-06-01days on market $94,900 Active 23 DOM
-
2026-05-31days on market $94,900 Active 22 DOM
-
2026-05-09$94,900 Active 476-char remark
ⓘ Source: listings_history table (triggers on properties + properties_extension) + one-shot
backfill from property_details.listing_events for pre-trigger history.
Climate risk First Street
- Flood 1/10 Low FEMA zone X (unshaded) · 0% chance over 30 yrs
- Wildfire 1/10 Low
- Heat 3/10 Moderate 7 d/yr ≥100°F today · 18 d/yr by 30 yrs out
- Wind 2/10 Low 100% chance of damaging wind over 30 yrs
- Air quality 3/10 Moderate 3 unhealthy d/yr today · 4 by 30 yrs out
Nearby sold comps map
Loading sold comps map…
Walkable amenities ~0.75 mi
Loading nearby amenities…
Taxation est. · year 1
- Rental income
- $27,013
- − Mortgage interest
- −$5,316
- − Property taxes
- −$1,424
- − Insurance
- −$474
- − Repairs & maintenance
- −$2,161
- − Management
- −$2,161
- − HOA
- −$7,500
- − Depreciation
- −$2,761
- Taxable income
- $5,216
- Est. tax owed @ 24.0%
- −$1,252
- After-tax cash flow
- $4,718/yr
For passive investors: Depreciation is non-cash, so a rental often shows a tax loss while cash-flowing — sheltering income. Rental losses are passive: they offset passive income freely, and up to $25,000/yr can offset ordinary (W-2) income if you actively participate and your MAGI is under $100k (phasing out to $0 by $150k); unused losses carry forward. On sale, claimed depreciation is recaptured at up to 25%, and gains may owe capital-gains tax (a 1031 exchange can defer both). Figures are a year-1 estimate at your 24.0% rate — not tax advice; consult a CPA.
Condition & rehab AI · 17 photos
This nearly new Clayton Clark model is move-in ready with modern finishes and a convenient location.
Value-add opportunities
- Both Paint the exterior siding — Enhances curb appeal and value
- Resale Replace the kitchen faucet — Modernizes the kitchen and adds value
- Both Install new window treatments — Improves energy efficiency and aesthetics
Renovation cost estimate screening
Value-add ROI direction
- Both Paint the exterior siding — Enhances curb appeal and value ↑
- Resale Replace the kitchen faucet — Modernizes the kitchen and adds value ↑
- Both Install new window treatments — Improves energy efficiency and aesthetics ↑
ⓘ Cost ranges are severity-bucket heuristics (US national rule-of-thumb). Get contractor quotes + a written scope before underwriting a rehab budget.
Schools (NCES district)
- District
- Jonathan Alder Local
- NCES district ID
- 3904826
- Math proficiency
- 68% ▼ -12.00%
- Reading proficiency
- 74% ▼ -6.00%
- Median HH income
- $67,345
- Composite
- 61.84/100
- National rank
- #729
- State rank
- #121 of 656 in OH
Livability — Plain City
- Score
- 79/100
- State rank
- #146
- US rank
- #2254
Category grades
Schools grade is shown separately in the Schools card above.
Census & demographics
- County
- Union County · 57,133 people
- City population
- 18,143
- Metro
- Columbus, OH
- Population (ZIP)
- 18,143
- Household income
- $139,591
- Rent vs Own
- Severe rent burden
- 103.0
Population outlook (Madison County) Hauer SSP2
- Today (2025)
- 46,050 people
- By 2030
- 46,826 · +1.7%
- By 2040
- 47,941 · +4.1%
- By 2050
- 47,919 · +4.1%
- By 2075
- 46,160 · +0.2%
- By 2100
- 38,584 · -16.2%
Race, ethnicity, and origin ACS 2023
- Neighborhood character
- Predominantly White (82%)
- Race & ethnicity
- White 82% Asian 10% Two or more races 4% Hispanic / Latino 4% Black 2%
- Common ancestry
- Slovak 3% Polish 2% Romanian 2%
- Foreign-born
- 8% · Canada
- Languages at home
- 86% English-only · Other Asian/Pacific 6% German/W. Germanic 2% Spanish 2%
Political lean MEDSL · Madison
- 2024 margin
- Solid R (+43.7) · D 27.6% · R 71.3% · Other 1.1%
- 2008→2024 swing
- -20.3pp toward R · 2008: -23.4pp · 2024: -43.7pp
- All cycles
- 2024: R+43.7 2020: R+41.0 2016: R+39.7 2012: R+20.4 2008: R+23.4
Not yet ingested
- Civics
- —
Market trends
- HPI YoY
- ▼ -132.74%
- Current HPI
- 235.171
- Rent YoY
- —
- Metro
- Columbus, OH
- State GDP YoY
- ▲ 1.98%
- F500 in state
- 48
Industry mix (Fortune 500 HQ in OH)
| Industry | F500 HQs | Revenue |
|---|---|---|
| Insurance | 3 | $145B |
|
||
| Industrial Machinery | 3 | $49B |
|
||
| Financial Services | 3 | $24B |
|
||
| Consumer Goods | 2 | $93B |
|
||
| Aerospace / Defense | 2 | $47B |
|
||
| Utilities | 2 | $33B |
|
||
Price history
1 event — show timeline
- 2026-05-09 Listed $94,900 CBRMLS
Cash-flow waterfall
monthlySold comps — $/sqft
last 12 mo · ≤1 miLoading sold comps…