5900 21st St N · Lealman, FL
Flood risk 4/10 · Minor
- FEMA flood zone
- X (unshaded)
- Chance of flooding over 30 yrs
- 0.13%
- Est. flood insurance / yr
- $507 – $1,088
Fire risk 1/10 · Minimal
- Est. fire insurance / yr
- $947 – $1,759
Heat risk 10/10 · Severe
- Hot days now (above 106°F)
- 7 days/yr
- Hot days in 30 yrs
- 28 days/yr
Wind risk 10/10 · Severe
- Chance of severe wind over 30 yrs
- 99.0%
Air-quality risk 4/10 · Minor
- Unhealthy air days now
- 4 days/yr
- Unhealthy air days in 30 yrs
- 4 days/yr
Risk factors via First Street. Map © Google.
Why this score? — see what drove the B grade
The composite is a weighted blend of 9 inputs, each scored 0–100. Each bar is that input's sub-score; the figure is the points it added to the 100-point composite (weight × sub-score).
- Cash flow +30.0/30.0
- 1% rule +10.0/10.0
- DSCR +10.0/10.0
- ARV discount +7.5/15.0
- Schools +4.3/10.0
- Livability +4.0/5.0
- Condition / age +3.8/5.0
- Rent growth +2.0/5.0
- Appreciation +0.0/10.0
$85,000
🖨 Deal sheet 📄 Offer letter ✓ Due diligence
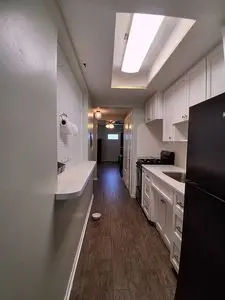
Listing remarks
Seasonal Pricing Through July & acirc; & euro; & rdquo; Now Offered at $85,000 Enjoy the comfort and convenience of first-floor living in this thoughtfully updated condo in Town Apartments North, a friendly and well-maintained 55+ community in St. Petersburg. This move-in-ready home features impact-resistant windows for peace of mind, a newer HVAC system for year-round comfort, and an updated kitchen that & acirc; & euro; & trade; s easy to use and maintain. The bright Florida room provides a quiet space for morning coffee, reading, or relaxing with friends. The insulated carport is a rare bonus that keeps your vehicle protected from the Florida sun. To make your t
Key facts
- First-floor living
- Florida room
- Updated kitchen
Tags
Neighborhood map
What this means for you Summary
Snapshot
- This is a 1-bed/1.0-bath other listed at $85k. Condition is rated good.
Deal economics
- At list price, monthly cash flow is $503 ($6k/yr) — positive.
- The deal already cash-flows at list — no discount required.
- Meets the 1% rule at list price ($1k rent vs $85k).
- Recommended offer: $82k (3.0% below list) — sets the bar for market timing.
- Cap rate 13.4% vs local median 4.7% in Lealman — top-decile yield for the area; either an underpriced asset or a hidden risk that comps aren't pricing in. Stress-test before assuming the spread holds.
Location & tenants
- Location reads 81/100 on livability (#83 in FL, #1,394 nationally) — a professional / high-income tenant draw. Strengths: commute A+, cost of living A+, housing A+; Watch: crime D+, schools F, employment F.
- Pinellas (suburban): math 51% / reading 51% proficiency, ranked #31 of 73 in FL (top 42%) — acceptable for families but not a draw, mixed tenant base, ~2y average lease.
- Market conditions: Rents soft (-2.1%/yr); 165 active listings in the ZIP; 16 comparable units currently listed for rent nearby; rentals at typical pace (median 18d on market — plan ~3-4 weeks tenant-placement turnaround); 2,676 units permitted in Pinellas County in 2024 (1,422 in 5+ unit buildings).
- This rent runs 35% of the median local income ($47k/yr) — at the standard rent-burdened threshold; future hikes will face affordability resistance.
Forward outlook
- Local home prices are declining (-3.0%/yr); year-one equity from $588 of loan paydown is wiped out by about $3k of value loss. Plan a longer hold.
- Pinellas County population projected at +14% by 2050 — modest demand growth; plan on rents tracking national, not racing it.
- At projected returns (-3.0% appreciation + 0.0% rent growth), your $24k cash investment doubles in ~6 years — after that, you're playing with house money.
Negotiation context
- It's been on market 34 days — a 3% lower offer ($82k) is reasonable based on typical stale-listing flexibility.
Risks & watch-outs
- Climate carrying-cost: severe wind risk, 99% chance of damaging wind over 30y; extreme-heat days projected 7→28/yr by 2055 (HVAC capex compounding) — expect insurance premiums to compound above CPI over the hold.
Questions for the listing agent
- It's been on market 34 days. Have you received any prior offers? Is the seller open to a 3% concession, seller financing, or rate buy-down credit?
- Built in 1966 — when were the roof, HVAC, electrical panel, plumbing, and water heater last replaced?
- Is there a deadline driving the sale (1031 exchange, divorce, estate, relocation)? That informs how much negotiation room exists.
- Schools are F-rated, which usually means shorter tenancies and higher turnover. Who's the typical renter profile here, and what's been the actual vacancy rate?
- Crime grade is D in this area — have there been break-ins, vandalism, or insurance claims at this property in the last 3 years? What carrier currently insures it and at what premium?
- What's the average days-on-market for RENTAL listings here right now (not sales)? A rising rental-DOM trend means longer vacancies and softer asking-rent achievability than the comps imply.
- What's the recent tenant-quality profile in this submarket — average credit score on applications, eviction rate, late-payment / NSF rate, and stable-employment percentage? A property-management company in the area should have these aggregated.
- How much new for-sale + rental construction is in the pipeline within 1–3 miles? Heavy new supply typically softens prices + rents 12–24 months out; constrained supply supports both.
Investment metrics
- 1% rule
- 1.62% ✓
- Cap rate
- 13.39%
- Cash-on-cash
- 25.36%
- DSCR
- 2.13
- GRM
- 5.1
CMA / ARV
No comps found within radius.
Projected returns pro-forma
-3.0% appreciation · 0.0% rent growth · sell at horizon
- IRR
- 15.5%
- Equity multiple
- 1.60×
- Total profit
- $14,234
- Equity at exit
- $12,674
- IRR
- 21.8%
- Equity multiple
- 2.60×
- Total profit
- $38,093
- Equity at exit
- $7,349
Cash invested: $23,800 (down + closing). Projections, not guarantees.
Landlord ↔ Tenant lean methodology
- Overall (STATE)
- 87 Strongly Landlord-Friendly
- State Florida
- 87 Strongly Landlord-Friendly · R+3
- County
- — inherits STATE
- City
- — inherits STATE
ZIP-level market 33714
- Home prices YoY
- -30.9%
- Rents YoY
- -2.1%
- Active inventory
- 165
- Price-to-rent
- 5.1×
Monthly cashflow live
- Estimated rent
- $1,380 high interval (Pro) →
- Mortgage (P&I)
- −$446
- Tax est. 1.5%
- −$106 /mo · $1,275/yr
- Insurance
- −$35
- HOA
- −$0
- Vacancy / Maint / Mgmt
- −$290
- Net cashflow
- $503
Break-even live
UW: 25.0% down · 7.5% · 30yr · 1.5% tax · 5.0% vac · 8.0% maint · 8.0% mgmt
Financing live
Cash to close
- Down payment
- $21,250
- Closing costs
- $2,550
- Reserves months
- —
- Total cash needed
- —
Loan-product check · same deal, 3 products live
Conventional
25% down · 7.5% · 30yr
- Down + closing
- —
- Monthly P&I
- —
- Monthly cashflow
- —
- DSCR
- —
- Eligible?
- —
Personal DTI + credit; lowest rate.
DSCR
20% down · 8.5% · 30yr
- Down + closing
- —
- Monthly P&I
- —
- Monthly cashflow
- —
- DSCR
- —
- Eligible?
- —
No personal income docs; deal must DSCR.
Hard money
10% down · 12.0% · 12mo
- Down + closing
- —
- Monthly P&I
- —
- Monthly cashflow
- —
- DSCR
- —
- Eligible?
- —
Short-term bridge; refi at stabilization.
Rent comps 16 comps
| Address | Beds | Baths | Sqft | Rent | $/sqft | DOM | Units | Dist |
|---|---|---|---|---|---|---|---|---|
| 5850 18th St N St Petersburg, FL | 1.0–2.0 | 1.0–2.0 | 727 | $1,300 | $1.79 | 24d | 2 | 0.19mi |
| 3109 54th Ave N Unit 1/2 St. Petersburg, FL | 1.0 | 1.0 | 400 | $1,025 | $2.56 | 17d | 1 | 0.91mi |
| 3109 54th Ave N Saint Petersburg, FL | 1.0 | 1.0 | 400 | $1,025 | $2.56 | 21d | 1 | 0.91mi |
| 4481 Crestwood Dr N Saint Petersburg, FL | 2.0 | 1.0 | 720 | $1,950 | $2.71 | 3d | 1 | 0.97mi |
| 660 62nd Ave N #1204 Saint Petersburg, FL | 1.0 | 1.0 | 656 | $1,400 | $2.13 | 23d | 1 | 1.17mi |
| 2807 41st Ave N Unit 3 St. Petersburg, FL | 1.0 | 1.0 | 450 | $1,600 | $3.56 | 24d | 1 | 1.29mi |
| 209 NW Jefferson Cir N Unit JEFFERSON209-15 St. Petersburg, FL | 2.0 | 1.0 | 740 | $1,275 | $1.72 | 2d | 1 | 1.33mi |
| 209 NW Jefferson Cir N Unit 15 St. Petersburg, FL | 2.0 | 1.0 | 740 | $1,275 | $1.72 | 24d | 1 | 1.33mi |
| 3600 49th Ave N Saint Petersburg, FL | 1.0–2.0 | 1.0 | 680 | $1,150 | $1.69 | 3d | 8 | 1.37mi |
| 4163 31st St N unit Unit D Saint Petersburg, FL | 1.0 | 1.0 | 600 | $1,490 | $2.48 | 13d | 1 | 1.37mi |
| 3725 18th St N Saint Petersburg, FL | 2.0 | 1.0 | 700 | $1,795 | $2.56 | 16d | 1 | 1.39mi |
| 550 50th Ave N Saint Petersburg, FL | 2.0 | 1.0 | 765 | $1,700 | $2.22 | 7d | 2 | 1.39mi |
| 5364 4th St N St. Petersburg, FL | 1.0 | 1.0 | 570 | $1,150 | $2.02 | 24d | 1 | 1.40mi |
| 3791 58th Ave N Unit 3 St. Petersburg, FL | 1.0 | 1.0 | 500 | $1,430 | $2.86 | 17d | 1 | 1.40mi |
| 3715 66th Ave N Unit B Pinellas Park, FL | 2.0 | 1.0 | 750 | $1,475 | $1.97 | 21d | 1 | 1.42mi |
| 1001 77th Ave N #308 Saint Petersburg, FL | 1.0 | 1.0 | 650 | $1,325 | $2.04 | 4d | 1 | 1.48mi |
Listing history 10 events
-
2026-06-15days on market $85,000 Active 34 DOM
-
2026-06-13days on market $85,000 Active 32 DOM
-
2026-06-09days on market $85,000 Active 28 DOM
-
2026-06-08days on market $85,000 Active 27 DOM
-
2026-06-07days on market $85,000 Active 26 DOM
-
2026-06-04days on market $85,000 Active 23 DOM
-
2026-06-03days on market $85,000 Active 22 DOM
-
2026-06-01days on market $85,000 Active 20 DOM
-
2026-05-31days on market $85,000 Active 19 DOM
-
2026-05-12$85,000 Active
ⓘ Source: listings_history table (triggers on properties + properties_extension) + one-shot
backfill from property_details.listing_events for pre-trigger history.
Climate risk First Street
- Flood 4/10 Moderate FEMA zone X (unshaded) · 13% chance over 30 yrs
- Wildfire 1/10 Low
- Heat 10/10 Extreme 7 d/yr ≥106°F today · 28 d/yr by 30 yrs out
- Wind 10/10 Extreme 99% chance of damaging wind over 30 yrs
- Air quality 4/10 Moderate 4 unhealthy d/yr today · 4 by 30 yrs out
Nearby sold comps map
Loading sold comps map…
Walkable amenities ~0.75 mi
Loading nearby amenities…
Taxation est. · year 1
- Rental income
- $16,562
- − Mortgage interest
- −$4,761
- − Property taxes
- −$1,275
- − Insurance
- −$425
- − Repairs & maintenance
- −$1,325
- − Management
- −$1,325
- − Depreciation
- −$2,473
- Taxable income
- $4,978
- Est. tax owed @ 24.0%
- −$1,195
- After-tax cash flow
- $4,840/yr
For passive investors: Depreciation is non-cash, so a rental often shows a tax loss while cash-flowing — sheltering income. Rental losses are passive: they offset passive income freely, and up to $25,000/yr can offset ordinary (W-2) income if you actively participate and your MAGI is under $100k (phasing out to $0 by $150k); unused losses carry forward. On sale, claimed depreciation is recaptured at up to 25%, and gains may owe capital-gains tax (a 1031 exchange can defer both). Figures are a year-1 estimate at your 24.0% rate — not tax advice; consult a CPA.
Condition & rehab AI · 1 photo
This move-in-ready condo in Town Apartments North features updated kitchen and HVAC, impact-resistant windows, and an insulated carport. Minor repairs and maintenance are needed to enhance its curb appeal and value.
Repairs flagged
- Minor kitchen backsplash — Slight discoloration visible on backsplash tiles.
Value-add opportunities
- Both paint interior walls — Fresh paint enhances curb appeal and interior aesthetics.
- Both replace kitchen backsplash tiles — New backsplash improves kitchen functionality and appearance.
- Rental landscaping — Landscaping enhances curb appeal and attracts tenants.
- Resale exterior paint — Fresh exterior paint improves home's curb appeal and resale value.
- Both replace carpet — New carpet improves comfort and appearance, benefiting both resale and rental value.
Renovation cost estimate screening
| Repair item | Severity | Est. cost |
|---|---|---|
| kitchen backsplash · Slight discoloration visible on backsplash tiles. | Minor | $500–3,000 |
| Total estimated repair cost · 1 items | $500–3,000 |
Value-add ROI direction
- Both paint interior walls — Fresh paint enhances curb appeal and interior aesthetics. ↑
- Both replace kitchen backsplash tiles — New backsplash improves kitchen functionality and appearance. ↑
- Rental landscaping — Landscaping enhances curb appeal and attracts tenants. ↑
- Resale exterior paint — Fresh exterior paint improves home's curb appeal and resale value. ↑
- Both replace carpet — New carpet improves comfort and appearance, benefiting both resale and rental value. ↑
ⓘ Cost ranges are severity-bucket heuristics (US national rule-of-thumb). Get contractor quotes + a written scope before underwriting a rehab budget.
Schools (NCES district)
- District
- Pinellas
- NCES district ID
- 1201560
- Math proficiency
- 51% ▼ -5.00%
- Reading proficiency
- 51% ▼ -3.00%
- Median HH income
- $46,270
- Composite
- 43.27/100
- National rank
- #3046
- State rank
- #31 of 73 in FL
Livability — Lealman
- Score
- 81/100
- State rank
- #83
- US rank
- #1394
Category grades
Schools grade is shown separately in the Schools card above.
Census & demographics
- Census place
- Lealman, FL
- County
- Pinellas County · 939,478 people
- City population
- 20,103
- Metro
- Tampa-St. Petersburg-Clearwater, FL
- Population (ZIP)
- 19,227
- Household income
- $47,487
- Rent vs Own
- Severe rent burden
- 915.0
Population outlook (Pinellas County) Hauer SSP2
- Today (2025)
- 1,027,532 people
- By 2030
- 1,063,586 · +3.5%
- By 2040
- 1,125,020 · +9.5%
- By 2050
- 1,168,637 · +13.7%
- By 2075
- 1,265,188 · +23.1%
- By 2100
- 1,260,357 · +22.7%
Race, ethnicity, and origin ACS 2023
- Neighborhood character
- Diverse neighborhood (Simpson 0.55)
- Race & ethnicity
- White 64% Hispanic / Latino 13% Two or more races 12% Black 10% Asian 6%
- Hispanic origin (detail)
- Mexican 2% Puerto Rican 2% Cuban 6% Dominican 1%
- Common ancestry
- Slovak 2% Italian 2% Romanian 2%
- Foreign-born
- 16% · Canada, Vietnam
- Languages at home
- 79% English-only · Spanish 11% Russian/Polish/Slavic 4% Vietnamese 3%
Political lean MEDSL · Pinellas
- 2024 margin
- Lean R (+5.2) · D 46.9% · R 52.1%
- 2008→2024 swing
- -13.5pp toward R · 2008: 8.3pp · 2024: -5.2pp
- All cycles
- 2024: R+5.2 2020: D+0.2 2016: R+1.1 2012: D+5.6 2008: D+8.3
Not yet ingested
- Civics
- —
Market trends
- HPI YoY
- ▼ -179.12%
- Current HPI
- 399.6253
- Rent YoY
- ▼ -2.08%
- Metro
- Tampa-St. Petersburg-Clearwater, FL
- State GDP YoY
- ▲ 3.28%
- F500 in state
- 36
Industry mix (Fortune 500 HQ in FL)
| Industry | F500 HQs | Revenue |
|---|---|---|
| Industrial Technology | 2 | $29B |
|
||
| Insurance | 2 | $17B |
|
||
| Retail | 1 | $60B |
|
||
| Technology Distribution | 1 | $58B |
|
||
| Homebuilding | 1 | $35B |
|
||
| Technology Manufacturing | 1 | $35B |
|
||
Price history
1 event — show timeline
- 2026-05-12 Listed $85,000 FSBO.com
Cash-flow waterfall
monthlySold comps — $/sqft
last 12 mo · ≤1 miLoading sold comps…