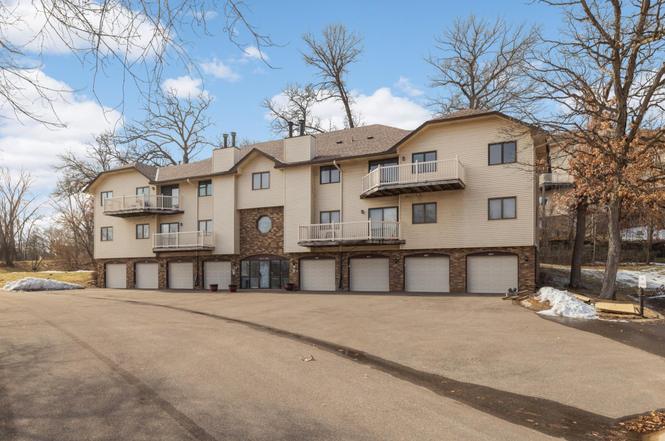
4185 Hilltop Pt · Eagan, MN
Flood risk 1/10 · Minimal
- FEMA flood zone
- X (unshaded)
- Chance of flooding over 30 yrs
- 0.0%
- Est. flood insurance / yr
- $507 – $1,088
Fire risk 1/10 · Minimal
- Est. fire insurance / yr
- $888 – $1,650
Heat risk 2/10 · Minimal
- Hot days now (above 100°F)
- 7 days/yr
- Hot days in 30 yrs
- 14 days/yr
Wind risk 2/10 · Minimal
- Chance of severe wind over 30 yrs
- —
Air-quality risk 2/10 · Minimal
- Unhealthy air days now
- 1 days/yr
- Unhealthy air days in 30 yrs
- 1 days/yr
Risk factors via First Street. Map © Google.
Why this score? — see what drove the C+ grade
The composite is a weighted blend of 9 inputs, each scored 0–100. Each bar is that input's sub-score; the figure is the points it added to the 100-point composite (weight × sub-score).
- Cash flow +21.2/30.0
- 1% rule +10.0/10.0
- ARV discount +7.5/15.0
- DSCR +6.7/10.0
- Schools +4.9/10.0
- Livability +4.3/5.0
- Rent growth +3.3/5.0
- Condition / age +2.5/5.0
- Appreciation +0.0/10.0
$89,990
🖨 Deal sheet (PDF) 📄 Offer letter ✓ Due diligence
Listing remarks MLS
YOUR HM IS NEW FROM THE SIDING & ROOF THROUGHOUT THE INTERIOR WITH NEW FLOORING, PAINT, WASHER & MOST LIGHT FIXTURES. HUGE GREAT RM, WALK IN CLOSET, LRG KITCHEN & DINING. WONDERFUL BRICK FRPLC & TERRIFIC PATIO AREA. COME ON OVER, YOU'LL BE GLAD YOU DID!
Key facts
- Private deck
- Scenic pond
- Private garage
Tags
Property features AI
Finance
- HOA & community: HOA managed by Cmmon Properties Management; Monthly association fee of $454; HOA covers hazard insurance, lawn care, grounds maintenance, sewer, snow removal, and water
Exterior
- Parking: Attached garage with garage door opener (1-car)
- Utilities: City water connected; City sewer connected; Natural gas
- Home design: Residential attached property; One story; Entry level: Main; Built with pitched asphalt roof (age 8 years or less)
- Construction: Foundation area approximately 1,100; Asphalt pitched roof (<= 8 years); Stone and vinyl exterior
- Exterior features: Stone and vinyl exterior; Patio; No pool; No fencing; Public transit within ~6 blocks; Heavy tree coverage; Cul-de-sac frontage; Paved streets; Private road
Interior
- Kitchen: Dishwasher; Range; Refrigerator; Exhaust fan; Disposal
- Bedrooms: 1 bedroom (Main level)
- Bathrooms: 1 full bath (Main floor)
- Heating & cooling: Forced air heating; Central air conditioning
- Interior features: All living facilities on one level; Main floor bedroom; Main floor laundry; Living/Dining room; Natural woodwork; Patio; Living room wood-burning stove fireplace (1)
- Laundry & utility: In-unit washer and dryer
Neighborhood map
What this means for you Summary
Snapshot
- This is a 1-bed/1.0-bath other listed at $90k.
Deal economics
- At list price, monthly cash flow is $129 ($2k/yr) — positive.
- The deal already cash-flows at list — no discount required.
- Meets the 1% rule at list price ($2k rent vs $90k).
- Recommended offer: $85k (6.0% below list) — sets the bar for market timing.
- Cap rate 8.0% vs local median 3.3% in Eagan — top-decile yield for the area; either an underpriced asset or a hidden risk that comps aren't pricing in. Stress-test before assuming the spread holds.
Location & tenants
- Location reads 86/100 on livability (#13 in MN, #418 nationally) — a professional / high-income tenant draw. Strengths: commute A+, employment A+, housing A+; Watch: cost of living D+, amenities F.
- Rosemount-Apple Valley-Eagan (suburban): math 50% / reading 58% proficiency, ranked #58 of 301 in MN (top 19%) — acceptable for families but not a draw, mixed tenant base, ~2y average lease; only 18% free/reduced lunch — higher-income household profile.
- Market conditions: Rents rising (+3.1%/yr); 141 active listings in the ZIP; 2 comparable units currently listed for rent nearby; high-income renter base; 2,134 units permitted in Dakota County in 2024 (898 in 5+ unit buildings).
- This rent is only 13% of the median local income ($139k/yr) — well below the 30% rent-burden line; pricing power to push rent on renewal without tenant pushback.
Forward outlook
- Local home prices are declining (-3.0%/yr); year-one equity from $622 of loan paydown is wiped out by about $3k of value loss. Plan a longer hold.
- Dakota County population projected at +11% by 2050 — modest demand growth; plan on rents tracking national, not racing it.
Negotiation context
- It's been on market 69 days — a 6% lower offer ($85k) is reasonable based on typical stale-listing flexibility.
- 4 sale attempts since 28y ago; this cycle's ask has dropped $10k (10%) from the opening price — seller is motivated, your offer sets the floor, not the list.
Risks & watch-outs
- Watch-outs: HOA is 30% of rent.
Questions for the listing agent
- It's been on market 69 days. Have you received any prior offers? Is the seller open to a 6% concession, seller financing, or rate buy-down credit?
- What does the HOA fee cover, when was the last increase, and are there any pending special assessments or reserve-fund shortfalls?
- Why hasn't it sold? Are there any deal-killer items the seller is aware of (foundation, flood, title, zoning, code violations)?
- Is there a deadline driving the sale (1031 exchange, divorce, estate, relocation)? That informs how much negotiation room exists.
- Schools are A-rated — typically a magnet for longer-tenancy family renters. What's the average tenant stay here, and is there a school-zone premium baked into asking?
- What's the average days-on-market for RENTAL listings here right now (not sales)? A rising rental-DOM trend means longer vacancies and softer asking-rent achievability than the comps imply.
- What's the recent tenant-quality profile in this submarket — average credit score on applications, eviction rate, late-payment / NSF rate, and stable-employment percentage? A property-management company in the area should have these aggregated.
- How much new for-sale + rental construction is in the pipeline within 1–3 miles? Heavy new supply typically softens prices + rents 12–24 months out; constrained supply supports both.
Investment metrics
- 1% rule
- 1.70% ✓
- Cap rate
- 8.02%
- Cash-on-cash
- 6.16%
- DSCR
- 1.27
- GRM
- 4.9
CMA / ARV
No comps found within radius.
Projected returns pro-forma
-3.0% appreciation · 3.08% rent growth · sell at horizon
- IRR
- -6.3%
- Equity multiple
- 0.77×
- Total profit
- $-5,918
- Equity at exit
- $13,418
- IRR
- 3.8%
- Equity multiple
- 1.29×
- Total profit
- $7,189
- Equity at exit
- $7,781
Cash invested: $25,197 (down + closing). Projections, not guarantees.
Landlord ↔ Tenant lean methodology
- Overall (STATE)
- 46 Balanced
- State Minnesota
- 46 Balanced · D+2
- County
- — inherits STATE
- City
- — inherits STATE
ZIP-level market 55123
- Rents YoY
- 3.1%
- Active inventory
- 141
- Price-to-rent
- 4.9×
Monthly cashflow live
- Estimated rent
- $1,526 medium interval (Pro) →
- Mortgage (P&I)
- −$472
- Tax est. 1.5%
- −$112 /mo · $1,350/yr
- Insurance
- −$37
- HOA
- −$454
- Vacancy / Maint / Mgmt
- −$320
- Net cashflow
- $129
Break-even live
Sensitivity live
| Price | -10% $192 | -5% $160 | +0% $129 | +5% $98 | +10% $67 |
|---|---|---|---|---|---|
| Rent | -10% $9 | -5% $69 | +0% $129 | +5% $190 | +10% $250 |
| Rate | -1.0pp $175 | -0.5pp $152 | base $129 | +0.5pp $106 | +1.0pp $82 |
UW: 25.0% down · 7.5% · 30yr · 1.5% tax · 5.0% vac · 8.0% maint · 8.0% mgmt
Financing live
Cash to close
- Down payment
- $22,498
- Closing costs
- $2,700
- Reserves months
- —
- Total cash needed
- —
Loan-product check · same deal, 3 products live
Conventional
25% down · 7.5% · 30yr
- Down + closing
- —
- Monthly P&I
- —
- Monthly cashflow
- —
- DSCR
- —
- Eligible?
- —
Personal DTI + credit; lowest rate.
DSCR
20% down · 8.5% · 30yr
- Down + closing
- —
- Monthly P&I
- —
- Monthly cashflow
- —
- DSCR
- —
- Eligible?
- —
No personal income docs; deal must DSCR.
Hard money
10% down · 12.0% · 12mo
- Down + closing
- —
- Monthly P&I
- —
- Monthly cashflow
- —
- DSCR
- —
- Eligible?
- —
Short-term bridge; refi at stabilization.
Rent comps 2 comps
| Address | Beds | Baths | Sqft | Rent | $/sqft | DOM | Units | Dist |
|---|---|---|---|---|---|---|---|---|
| 1272 Deercliff Ln Unit 1 Eagan, MN | 2.0 | 2.0 | 985 | $1,900 | $1.93 | 0d | 1 | 0.89mi |
| 4116 Lexington Ave S Eagan, MN | 1.0–2.0 | 1.0 | 780 | $1,425 | $1.83 | 0d | 7 | 0.91mi |
HOA detail
- Monthly dues
- $454 · $5,448/yr
Listing history 12 events
-
2026-05-13status Pending
-
2026-05-06historical Contingent - Subject to Statutory Rescission
-
2026-04-02price $89,990
-
2026-03-05$99,990 Active
-
2005-03-31soldstatus $135,000 269-char remark
Show marketing remark (269 chars)
YOUR HM IS NEW FROM THE SIDING & ROOF THROUGHOUT THE INTERIOR WITH NEW FLOORING, PAINT, WASHER & MOST LIGHT FIXTURES. HUGE GREAT RM, WALK IN CLOSET, LRG KITCHEN & DINING. WONDERFUL BRICK FRPLC & TERRIFIC PATIO AREA. COME ON OVER, YOU'LL BE GLAD YOU DID!
-
2005-01-03$135,000 269-char remark
Show marketing remark (269 chars)
YOUR HM IS NEW FROM THE SIDING & ROOF THROUGHOUT THE INTERIOR WITH NEW FLOORING, PAINT, WASHER & MOST LIGHT FIXTURES. HUGE GREAT RM, WALK IN CLOSET, LRG KITCHEN & DINING. WONDERFUL BRICK FRPLC & TERRIFIC PATIO AREA. COME ON OVER, YOU'LL BE GLAD YOU DID!
-
2002-03-29soldstatus $105,900
-
2002-02-15historical
-
2002-02-13$105,900
-
1998-06-30soldstatus $62,900
-
1998-06-17historical
-
1998-06-15$62,900
ⓘ Source: listings_history table (triggers on properties + properties_extension) + one-shot
backfill from property_details.listing_events for pre-trigger history.
Climate risk First Street
- Flood 1/10 Low FEMA zone X (unshaded) · 0% chance over 30 yrs
- Wildfire 1/10 Low
- Heat 2/10 Low 7 d/yr ≥100°F today · 14 d/yr by 30 yrs out
- Wind 2/10 Low
- Air quality 2/10 Low 1 unhealthy d/yr today · 1 by 30 yrs out
Nearby sold comps map
Loading sold comps map…
Walkable amenities ~0.75 mi
Loading nearby amenities…
Taxation est. · year 1
- Rental income
- $18,308
- − Mortgage interest
- −$5,041
- − Property taxes
- −$1,350
- − Insurance
- −$450
- − Repairs & maintenance
- −$1,465
- − Management
- −$1,465
- − HOA
- −$5,448
- − Depreciation
- −$2,618
- Taxable income
- $472
- Est. tax owed @ 24.0%
- −$113
- After-tax cash flow
- $1,439/yr
For passive investors: Depreciation is non-cash, so a rental often shows a tax loss while cash-flowing — sheltering income. Rental losses are passive: they offset passive income freely, and up to $25,000/yr can offset ordinary (W-2) income if you actively participate and your MAGI is under $100k (phasing out to $0 by $150k); unused losses carry forward. On sale, claimed depreciation is recaptured at up to 25%, and gains may owe capital-gains tax (a 1031 exchange can defer both). Figures are a year-1 estimate at your 24.0% rate — not tax advice; consult a CPA.
Schools (NCES district)
- District
- Rosemount-Apple Valley-Eagan
- NCES district ID
- 2732390
- Math proficiency
- 50% ▼ -14.00%
- Reading proficiency
- 58% ▼ -7.00%
- Median HH income
- $85,559
- Composite
- 49.48/100
- National rank
- #2000
- State rank
- #58 of 301 in MN
Livability — Eagan
- Score
- 86/100
- State rank
- #13
- US rank
- #418
Category grades
Schools grade is shown separately in the Schools card above.
Census & demographics
- Census place
- Eagan, MN
- County
- Dakota County · 417,704 people
- City population
- 67,960
- Metro
- Minneapolis-St. Paul-Bloomington, MN-WI
- Population (ZIP)
- 26,501
- Household income
- $139,215
- Rent vs Own
- Severe rent burden
- 376.0
Population outlook (Dakota County) Hauer SSP2
- Today (2025)
- 450,671 people
- By 2030
- 465,068 · +3.2%
- By 2040
- 486,770 · +8.0%
- By 2050
- 498,743 · +10.7%
- By 2075
- 533,865 · +18.5%
- By 2100
- 550,133 · +22.1%
Race, ethnicity, and origin ACS 2023
- Neighborhood character
- Predominantly White (77%)
- Race & ethnicity
- White 77% Asian 10% Hispanic / Latino 6% Two or more races 6% Black 3%
- Hispanic origin (detail)
- Mexican 4%
- Common ancestry
- Portuguese 12% Italian 5% Romanian 4%
- Foreign-born
- 12% · Canada, South Korea, China
- Languages at home
- 86% English-only · Spanish 4% Other Asian/Pacific 4% Other Indo-European 2%
Political lean MEDSL · Dakota
- 2024 margin
- D (+12.9) · D 55.4% · R 42.5% · Other 2.1%
- 2008→2024 swing
- +7.4pp toward D · 2008: 5.5pp · 2024: 12.9pp
- All cycles
- 2024: D+12.9 2020: D+13.9 2016: D+4.7 2012: D+2.9 2008: D+5.5
Not yet ingested
- Civics
- —
Market trends
- HPI YoY
- ▼ -172.93%
- Current HPI
- 214.1028
- Rent YoY
- ▲ 3.08%
- Metro
- Minneapolis-St. Paul-Bloomington, MN-WI
- State GDP YoY
- ▲ 2.41%
- F500 in state
- 34
Industry mix (Fortune 500 HQ in MN)
| Industry | F500 HQs | Revenue |
|---|---|---|
| Healthcare | 2 | $407B |
|
||
| Retail | 2 | $150B |
|
||
| Consumer Goods | 2 | $32B |
|
||
| Industrial Machinery | 2 | $6B |
|
||
| Agriculture | 1 | $40B |
|
||
| Healthcare / Medical Devices | 1 | $32B |
|
||
Price history
+43.1% since first listed12 events — show timeline
- 2026-05-13 Pending — NORTHSTARMLS as Distributed by MLS Grid
- 2026-05-06 Contingent — NORTHSTARMLS as Distributed by MLS Grid
- 2026-04-02 Price Changed $89,990 NORTHSTARMLS as Distributed by MLS Grid
- 2026-03-05 Listed $99,990 NORTHSTARMLS as Distributed by MLS Grid
- 2005-03-31 Sold (MLS) $135,000 NORTHSTARMLS as Distributed by MLS Grid
- 2005-01-03 Listed $135,000 NORTHSTARMLS as Distributed by MLS Grid
- 2002-03-29 Sold (MLS) $105,900 NORTHSTARMLS as Distributed by MLS Grid
- 2002-02-15 Listing Removed — NORTHSTARMLS as Distributed by MLS Grid
- 2002-02-13 Listed $105,900 NORTHSTARMLS as Distributed by MLS Grid
- 1998-06-30 Sold (MLS) $62,900 NORTHSTARMLS as Distributed by MLS Grid
- 1998-06-17 Listing Removed — NORTHSTARMLS as Distributed by MLS Grid
- 1998-06-15 Listed $62,900 NORTHSTARMLS as Distributed by MLS Grid
Cash-flow waterfall
monthlySold comps — $/sqft
last 12 mo · ≤1 miLoading sold comps…