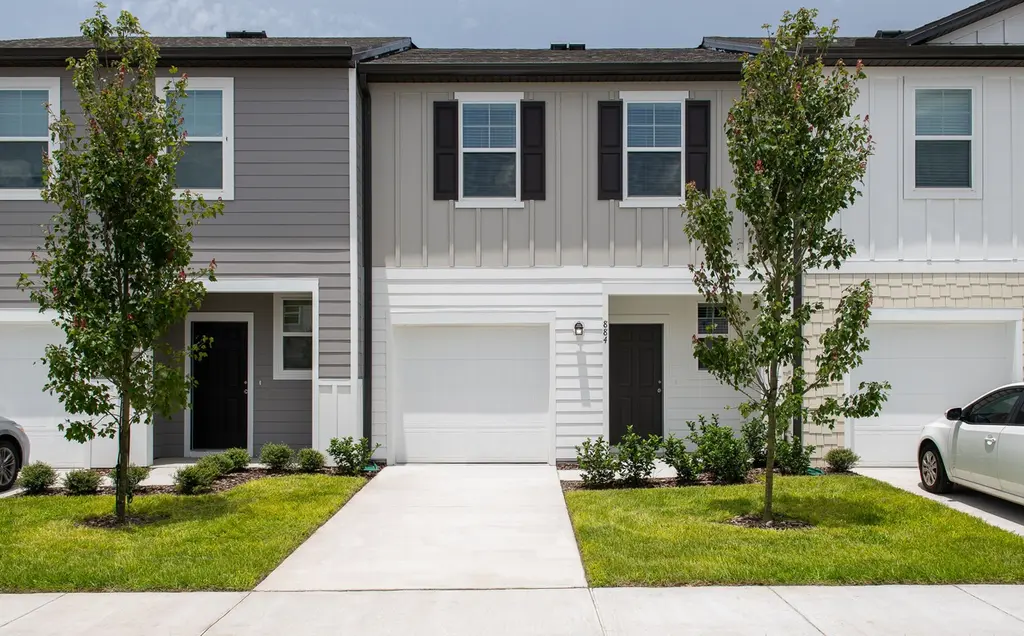
3668 Spire Dr · Davenport, FL
Flood risk No data
- FEMA flood zone
- —
- Chance of flooding over 30 yrs
- —
- Est. flood insurance / yr
- —
Fire risk No data
- Est. fire insurance / yr
- —
Heat risk No data
- Hot days now (above threshold)
- —
- Hot days in 30 yrs
- —
Wind risk No data
- Chance of severe wind over 30 yrs
- —
Air-quality risk No data
- Unhealthy air days now
- —
- Unhealthy air days in 30 yrs
- —
Risk factors via First Street. Map © Google.
Why this score? — see what drove the D- grade
The composite is a weighted blend of 9 inputs, each scored 0–100. Each bar is that input's sub-score; the figure is the points it added to the 100-point composite (weight × sub-score).
- Cash flow +12.4/30.0
- ARV discount +7.5/15.0
- DSCR +3.7/10.0
- 1% rule +3.5/10.0
- Schools +3.5/10.0
- Livability +3.5/5.0
- Condition / age +2.5/5.0
- Rent growth +1.8/5.0
- Appreciation +0.0/10.0
$249,990
🖨 Deal sheet 📄 Offer letter ✓ Due diligence
Listing remarks
You enter through the front covered porch into the foyer, where stairs to the second floor are immediately in view. Just off the foyer are a one-car garage and a convenient powder bath. From there, you step into the open kitchen, dining area, and family room, with access to the back patio located off the dining space. Upstairs, the primary bedroom features a primary bath and a walk-in closet. Two additional bedrooms share a full bath, and a laundry room with a linen closet adds everyday convenience to the second floor.
Key facts
- Covered porch
- Primary bath
- Walk-in closet
Tags
Property features AI
Finance
- Other: Living area approximately 1422; Address: 3668 Spire Dr, Davenport FL 33837; Listing status: Active; List price: 279990
Exterior
- Parking: 1 parking space
- Utilities: Electric power; Central air (cooling)
- Home design: Spec new-construction plan named Cosmos
Interior
- Bedrooms: 3 bedrooms
- Bathrooms: 2 full bathrooms
- Heating & cooling: Electric heating with heat pump; Central air conditioning
- Interior features: Dishwasher; Disposal; Microwave
Neighborhood map
What this means for you Summary
Snapshot
- This is a 3-bed/2.0-bath townhouse listed at $250k.
Deal economics
- At list price, monthly cash flow is $-41 ($-491/yr) — negative.
- To cash-flow at today's rent, offer at most $244k (2.4% below list).
- To meet the 1% rule (rent ≥ 1% of price), the offer needs to be $214k (14.6% below list).
- Recommended offer: $214k (14.6% below list) — sets the bar for 1% rule.
Location & tenants
- Location reads 70/100 on livability (#423 in FL) — a middle-class / working-renter tenant base. Strengths: crime A+, housing A+, health & safety A+; Watch: schools D+, employment D+, amenities F.
- Polk (suburban): math 39% / reading 43% proficiency, ranked #62 of 73 in FL (top 85%) — families likely to look elsewhere, expect single-tenant / working-renter base with shorter leases.
- Market conditions: Rents soft (-2.7%/yr); 1382 active listings in the ZIP; 16 comparable units currently listed for rent nearby; rentals at typical pace (median 24d on market — plan ~3-4 weeks tenant-placement turnaround); solid renter incomes; 10,384 units permitted in Polk County in 2024 (1,716 in 5+ unit buildings).
- This rent runs 32% of the median local income ($81k/yr) — at the standard rent-burdened threshold; future hikes will face affordability resistance.
Forward outlook
- Local home prices are declining (-3.0%/yr); year-one equity from $2k of loan paydown is wiped out by about $8k of value loss. Plan a longer hold.
- Polk County population projected at +33% by 2050 — long-run rental-demand tailwind backs the buy-and-hold thesis.
Negotiation context
- It's been on market 36 days — a 3% lower offer ($242k) is reasonable based on typical stale-listing flexibility.
Questions for the listing agent
- What do current leases actually rent for vs. the listed asking? Can we see a recent rent roll and the last 12 months of T-12 income?
- It's been on market 36 days. Have you received any prior offers? Is the seller open to a 15% concession, seller financing, or rate buy-down credit?
- Is there a deadline driving the sale (1031 exchange, divorce, estate, relocation)? That informs how much negotiation room exists.
- Schools are D-rated, which usually means shorter tenancies and higher turnover. Who's the typical renter profile here, and what's been the actual vacancy rate?
- The area grade is low — what's the realistic commute time and amenity access for the typical tenant pool here? Any planned neighborhood developments (good or bad) we should know about?
- What's the average days-on-market for RENTAL listings here right now (not sales)? A rising rental-DOM trend means longer vacancies and softer asking-rent achievability than the comps imply.
- What's the recent tenant-quality profile in this submarket — average credit score on applications, eviction rate, late-payment / NSF rate, and stable-employment percentage? A property-management company in the area should have these aggregated.
- How much new for-sale + rental construction is in the pipeline within 1–3 miles? Heavy new supply typically softens prices + rents 12–24 months out; constrained supply supports both.
Investment metrics
- 1% rule
- 0.85% ✗
- Cap rate
- 6.10%
- Cash-on-cash
- -0.70%
- DSCR
- 0.97
- GRM
- 9.8
CMA / ARV
No comps found within radius.
Projected returns pro-forma
-3.0% appreciation · 0.0% rent growth · sell at horizon
- IRR
- -20.9%
- Equity multiple
- 0.30×
- Total profit
- $-49,342
- Equity at exit
- $37,274
- IRR
- -23.1%
- Equity multiple
- -0.01×
- Total profit
- $-70,373
- Equity at exit
- $21,615
Cash invested: $69,997 (down + closing). Projections, not guarantees.
Landlord ↔ Tenant lean methodology
- Overall (STATE)
- 87 Strongly Landlord-Friendly
- State Florida
- 87 Strongly Landlord-Friendly · R+3
- County
- — inherits STATE
- City
- — inherits STATE
ZIP-level market 33837
- Home prices YoY
- -33.9%
- Rents YoY
- -2.7%
- Active inventory
- 1382
- Price-to-rent
- 9.8×
Monthly cashflow live
- Estimated rent
- $2,135 high interval (Pro) →
- Mortgage (P&I)
- −$1,311
- Tax est. 1.5%
- −$312 /mo · $3,750/yr
- Insurance
- −$104
- HOA
- −$0
- Vacancy / Maint / Mgmt
- −$448
- Net cashflow
- $-41
Break-even live
UW: 25.0% down · 7.5% · 30yr · 1.5% tax · 5.0% vac · 8.0% maint · 8.0% mgmt
Financing live
Cash to close
- Down payment
- $62,498
- Closing costs
- $7,500
- Reserves months
- —
- Total cash needed
- —
Loan-product check · same deal, 3 products live
Conventional
25% down · 7.5% · 30yr
- Down + closing
- —
- Monthly P&I
- —
- Monthly cashflow
- —
- DSCR
- —
- Eligible?
- —
Personal DTI + credit; lowest rate.
DSCR
20% down · 8.5% · 30yr
- Down + closing
- —
- Monthly P&I
- —
- Monthly cashflow
- —
- DSCR
- —
- Eligible?
- —
No personal income docs; deal must DSCR.
Hard money
10% down · 12.0% · 12mo
- Down + closing
- —
- Monthly P&I
- —
- Monthly cashflow
- —
- DSCR
- —
- Eligible?
- —
Short-term bridge; refi at stabilization.
Rent comps 16 comps
| Address | Beds | Baths | Sqft | Rent | $/sqft | DOM | Units | Dist |
|---|---|---|---|---|---|---|---|---|
| 3628 Spire Dr Davenport, FL | 3.0 | 2.5 | 1421 | $1,950 | $1.37 | 3d | 1 | 0.03mi |
| 3057 Temples Crossing Blvd Davenport, FL | 3.0 | 2.5 | 1480 | $2,050 | $1.39 | 23d | 1 | 0.10mi |
| 241 Gina Ln Davenport, FL | 3.0 | 2.0 | 1700 | $2,250 | $1.32 | 23d | 1 | 0.20mi |
| 754 Chinoy Rd Davenport, FL | 3.0 | 2.0 | 1516 | $2,100 | $1.39 | 23d | 1 | 0.32mi |
| 110 Forest Ave Unit 2 Davenport, FL | 3.0 | 2.0 | 1250 | $1,295 | $1.04 | 3d | 1 | 0.65mi |
| 2624 Penguin Blvd Davenport, FL | 3.0 | 2.0 | 1574 | $2,050 | $1.30 | 23d | 1 | 0.80mi |
| 2612 Penguin Blvd Davenport, FL | 3.0 | 2.5 | 1407 | $1,900 | $1.35 | 23d | 1 | 0.80mi |
| 3057 Canary Ave Davenport, FL | 3.0 | 2.5 | 1515 | $1,850 | $1.22 | 14d | 1 | 0.87mi |
| 3037 Canary Ave Davenport, FL | 3.0 | 2.5 | 1373 | $1,900 | $1.38 | 19d | 1 | 0.88mi |
| 3010 Canary Ave Davenport, FL | 3.0 | 2.5 | 1574 | $2,050 | $1.30 | 23d | 1 | 0.91mi |
| 2966 Canary Ave Davenport, FL | 3.0 | 2.5 | 1574 | $1,850 | $1.18 | 14d | 1 | 0.95mi |
| 2958 Canary Ave Davenport, FL | 3.0 | 2.5 | 1407 | $1,900 | $1.35 | 23d | 1 | 0.96mi |
| 2947 Canary Ave Davenport, FL | 3.0 | 2.5 | 1515 | $1,900 | $1.25 | 23d | 1 | 0.98mi |
| 118 E Pine St Davenport, FL | 3.0 | 2.0 | 1220 | $1,975 | $1.62 | 3d | 1 | 1.01mi |
| 210 E Palm St Davenport, FL | 4.0 | 2.0 | 1126 | $2,250 | $2.00 | 21d | 1 | 1.13mi |
| 2 W Orange St Unit 101 Davenport, FL | 3.0 | 2.0 | 1048 | $1,795 | $1.71 | 3d | 1 | 1.28mi |
Listing history 13 events
-
2026-06-18days on market $249,990 Active 36 DOM
-
2026-06-17days on market $249,990 Active 35 DOM
-
2026-06-16days on market $249,990 Active 34 DOM
-
2026-06-15days on market $249,990 Active 33 DOM
-
2026-06-13pricedays on market $249,990 Active 31 DOM
-
2026-06-10days on market $279,990 Active 28 DOM
-
2026-06-09days on market $279,990 Active 27 DOM
-
2026-06-08days on market $279,990 Active 26 DOM
-
2026-06-07days on market $279,990 Active 25 DOM
-
2026-06-05days on market $279,990 Active 22 DOM
-
2026-06-03days on market $279,990 Active 20 DOM
-
2026-06-01days on market $279,990 Active 19 DOM
-
2026-05-31days on market $279,990 Active 18 DOM
ⓘ Source: listings_history table (triggers on properties + properties_extension) + one-shot
backfill from property_details.listing_events for pre-trigger history.
Nearby sold comps map
Loading sold comps map…
Walkable amenities ~0.75 mi
Loading nearby amenities…
Taxation est. · year 1
- Rental income
- $25,620
- − Mortgage interest
- −$14,003
- − Property taxes
- −$3,750
- − Insurance
- −$1,250
- − Repairs & maintenance
- −$2,050
- − Management
- −$2,050
- − Depreciation
- −$7,272
- Taxable loss
- −$4,754
- Est. tax savings @ 24.0%
- +$1,141
- After-tax cash flow
- $650/yr
For passive investors: Depreciation is non-cash, so a rental often shows a tax loss while cash-flowing — sheltering income. Rental losses are passive: they offset passive income freely, and up to $25,000/yr can offset ordinary (W-2) income if you actively participate and your MAGI is under $100k (phasing out to $0 by $150k); unused losses carry forward. On sale, claimed depreciation is recaptured at up to 25%, and gains may owe capital-gains tax (a 1031 exchange can defer both). Figures are a year-1 estimate at your 24.0% rate — not tax advice; consult a CPA.
Schools (NCES district)
- District
- Polk
- NCES district ID
- 1201590
- Math proficiency
- 39% ▼ -11.00%
- Reading proficiency
- 43% ▼ -4.00%
- Median HH income
- $43,979
- Composite
- 34.74/100
- National rank
- #5132
- State rank
- #62 of 73 in FL
Livability — Davenport
- Score
- 70/100
- State rank
- #423
- US rank
- #7541
Category grades
Schools grade is shown separately in the Schools card above.
Census & demographics
- County
- Polk County · 740,051 people
- City population
- 104,279
- Metro
- Lakeland-Winter Haven, FL
- Population (ZIP)
- 47,389
- Household income
- $81,276
- Rent vs Own
- Severe rent burden
- 424.0
Population outlook (Polk County) Hauer SSP2
- Today (2025)
- 752,975 people
- By 2030
- 804,621 · +6.9%
- By 2040
- 906,117 · +20.3%
- By 2050
- 1,000,476 · +32.9%
- By 2075
- 1,197,520 · +59.0%
- By 2100
- 1,271,518 · +68.9%
Race, ethnicity, and origin ACS 2023
- Neighborhood character
- Diverse neighborhood (Simpson 0.68)
- Race & ethnicity
- Hispanic / Latino 42% White 36% Two or more races 16% Black 15% Asian 2%
- Hispanic origin (detail)
- Mexican 7% Puerto Rican 22% Cuban 2% Dominican 1%
- Common ancestry
- Hispanic 5% Romanian 3% Lithuanian 1%
- Foreign-born
- 18% · Canada, Jamaica
- Languages at home
- 55% English-only · Spanish 35% French/Haitian/Cajun 6% Other Indo-European 2%
Political lean MEDSL · Polk
- 2024 margin
- Strong R (+20.7) · D 39.2% · R 59.9%
- 2008→2024 swing
- -14.6pp toward R · 2008: -6.1pp · 2024: -20.7pp
- All cycles
- 2024: R+20.7 2020: R+14.4 2016: R+14.1 2012: R+6.8 2008: R+6.1
Not yet ingested
- Civics
- —
Market trends
- HPI YoY
- ▼ -131.62%
- Current HPI
- 256.8165
- Rent YoY
- ▼ -2.73%
- Metro
- Lakeland-Winter Haven, FL
- State GDP YoY
- ▲ 3.28%
- F500 in state
- 36
Industry mix (Fortune 500 HQ in FL)
| Industry | F500 HQs | Revenue |
|---|---|---|
| Industrial Technology | 2 | $29B |
|
||
| Insurance | 2 | $17B |
|
||
| Retail | 1 | $60B |
|
||
| Technology Distribution | 1 | $58B |
|
||
| Homebuilding | 1 | $35B |
|
||
| Technology Manufacturing | 1 | $35B |
|
||
Cash-flow waterfall
monthlySold comps — $/sqft
last 12 mo · ≤1 miLoading sold comps…