1700 Manor Gdn · Greenville, TX
Flood risk 1/10 · Minimal
- FEMA flood zone
- X (unshaded)
- Chance of flooding over 30 yrs
- 0.0%
- Est. flood insurance / yr
- $507 – $1,088
Fire risk 6/10 · Moderate
- Est. fire insurance / yr
- $1,222 – $2,270
Heat risk 7/10 · Major
- Hot days now (above 110°F)
- 7 days/yr
- Hot days in 30 yrs
- 23 days/yr
Wind risk 6/10 · Moderate
- Chance of severe wind over 30 yrs
- 27.0%
Air-quality risk 2/10 · Minimal
- Unhealthy air days now
- 1 days/yr
- Unhealthy air days in 30 yrs
- 1 days/yr
Risk factors via First Street. Map © Google.
Why this score? — see what drove the D grade
The composite is a weighted blend of 9 inputs, each scored 0–100. Each bar is that input's sub-score; the figure is the points it added to the 100-point composite (weight × sub-score).
- Cash flow +14.6/30.0
- ARV discount +7.7/15.0
- DSCR +4.5/10.0
- 1% rule +3.9/10.0
- Livability +3.9/5.0
- Rent growth +2.7/5.0
- Condition / age +2.5/5.0
- Schools +2.0/10.0
- Appreciation +0.0/10.0
$194,000
🖨 Deal sheet (PDF) 📄 Offer letter ✓ Due diligence
Listing remarks
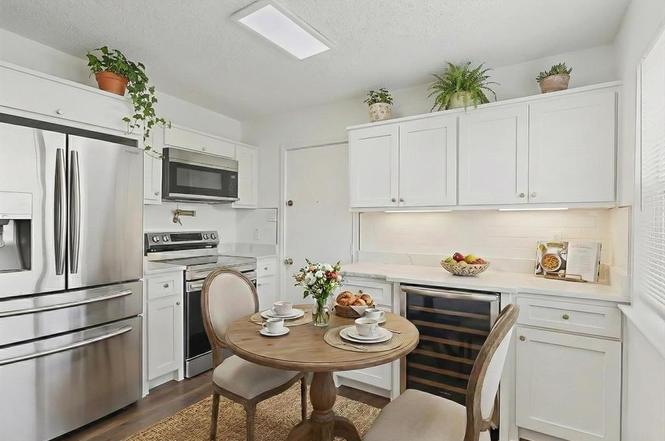
Find your new home and make memories in this beautifully renovated property, perfect for a family! Private entrance, spacious parking, and a modern kitchen with updated cabinets and countertops. This move-in-ready home is complete with brand new appliances!
Key facts
- Brand new appliances
- Updated cabinets
- Private entrance
Tags
Neighborhood map
What this means for you Summary
Snapshot
- This is a 4-bed/2.0-bath single-family listed at $194k.
Deal economics
- At list price, monthly cash flow is $48 ($571/yr) — positive.
- The deal already cash-flows at list — no discount required.
- To meet the 1% rule (rent ≥ 1% of price), the offer needs to be $173k (11.1% below list).
- Recommended offer: $173k (11.1% below list) — sets the bar for 1% rule.
- Cap rate 6.6% vs local median 4.1% in Greenville — top-decile yield for the area; either an underpriced asset or a hidden risk that comps aren't pricing in. Stress-test before assuming the spread holds.
Location & tenants
- Location reads 77/100 on livability (#78 in TX, #2,719 nationally) — a middle-class / working-renter tenant base. Strengths: cost of living A+, housing A+, health & safety A; Watch: employment D, commute F.
- Greenville ISD (town): math 20% / reading 26% proficiency, ranked #743 of 826 in TX (top 90%) — low school quality limits family demand, transient renter base, plan for 1-2y turnover.
- Zoned schools: Carver El (math 18% / reading 15%, grade F, #3,946 of 4,322 statewide, top 92%, 524 students, 93% FRL); Greenville Middle (math 17% / reading 28%, grade F, #1,341 of 1,662 statewide, top 82%, 727 students, 76% FRL); Greenville H S (math 17% / reading 37%, grade F, #1,204 of 1,632 statewide, top 75%, 1,480 students, 66% FRL) — zoned schools average 78% FRL vs 55% district-wide (23 pts higher); higher-poverty schools than district average — tighter screening recommended.
- Market conditions: Rents flat; 395 active listings in the ZIP; 40 comparable units currently listed for rent nearby; rentals at typical pace (median 26d on market — plan ~3-4 weeks tenant-placement turnaround); 45% of comp listings sitting > 30 days — soft ceiling on asking rent; 1,289 units permitted in Hunt County in 2024 (527 in 5+ unit buildings).
- This rent runs 35% of the median local income ($60k/yr) — at the standard rent-burdened threshold; future hikes will face affordability resistance.
Forward outlook
- Local home prices are declining (-3.0%/yr); year-one equity from $1k of loan paydown is wiped out by about $6k of value loss. Plan a longer hold.
- Hunt County population projected at +15% by 2050 — modest demand growth; plan on rents tracking national, not racing it.
Negotiation context
- It's been on market 77 days — a 6% lower offer ($182k) is reasonable based on typical stale-listing flexibility.
Risks & watch-outs
- Climate carrying-cost: major wind risk, 27% chance of damaging wind over 30y; major wildfire risk; extreme-heat days projected 7→23/yr by 2055 (HVAC capex compounding) — expect insurance premiums to compound above CPI over the hold.
Questions for the listing agent
- It's been on market 77 days. Have you received any prior offers? Is the seller open to a 11% concession, seller financing, or rate buy-down credit?
- Why hasn't it sold? Are there any deal-killer items the seller is aware of (foundation, flood, title, zoning, code violations)?
- Is there a deadline driving the sale (1031 exchange, divorce, estate, relocation)? That informs how much negotiation room exists.
- Schools are D-rated, which usually means shorter tenancies and higher turnover. Who's the typical renter profile here, and what's been the actual vacancy rate?
- The area grade is low — what's the realistic commute time and amenity access for the typical tenant pool here? Any planned neighborhood developments (good or bad) we should know about?
- What's the average days-on-market for RENTAL listings here right now (not sales)? A rising rental-DOM trend means longer vacancies and softer asking-rent achievability than the comps imply.
- What's the recent tenant-quality profile in this submarket — average credit score on applications, eviction rate, late-payment / NSF rate, and stable-employment percentage? A property-management company in the area should have these aggregated.
- How much new for-sale + rental construction is in the pipeline within 1–3 miles? Heavy new supply typically softens prices + rents 12–24 months out; constrained supply supports both.
Investment metrics
- 1% rule
- 0.89% ✗
- Cap rate
- 6.59%
- Cash-on-cash
- 1.05%
- DSCR
- 1.05
- GRM
- 9.4
CMA / ARV
- ARV (on-the-fly)
- $194,814
- Comps found
- 12
Show comp detail 12 sales within ~0.75 mi
| Address | Dist | Beds/Ba | Sqft | Sold | Price | $/sf | Match |
|---|---|---|---|---|---|---|---|
| 1700 Manor Gdn | 0.00mi | 4/2.0 | 1,233 (0%) | 0mo | $194,000 | $157 | 100 |
| 1505 Reed St | 0.05mi | 3/2.0 (-1) | 1,269 (+3%) | 6mo | $189,000 | $149 | 83 |
| 1702 Manor Gdn | 0.01mi | 3/2.0 (-1) | 1,264 (+2%) | 9mo | $159,000 | $126 | 82 |
| 1305 Reed St | 0.09mi | 3/2.0 (-1) | 1,316 (+7%) | 1mo | $259,900 | $197 | 79 |
| 1203 Reed St | 0.14mi | 3/2.0 (-1) | 1,175 (-5%) | 7mo | $249,900 | $213 | 75 |
| 4805 Fillmore Dr | 0.18mi | 3/2.0 (-1) | 1,175 (-5%) | 5mo | $249,900 | $213 | 75 |
| 4705 Fillmore Dr | 0.21mi | 3/2.0 (-1) | 1,316 (+7%) | 1mo | $259,900 | $197 | 73 |
| 4809 Fillmore Dr | 0.17mi | 3/2.0 (-1) | 1,316 (+7%) | 4mo | $259,900 | $197 | 73 |
| 2004 Morgan St | 0.38mi | 3/2.0 (-1) | 1,215 (-2%) | 9mo | $170,000 | $140 | 68 |
| 4810 Bourland St | 0.22mi | 3/1.5 (-1) | 1,344 (+9%) | 2mo | $149,000 | $111 | 66 |
| 4909 Henry St | 0.38mi | 3/2.0 (-1) | 1,299 (+5%) | 8mo | $205,000 | $158 | 62 |
| 2008 Morgan St | 0.40mi | 3/2.0 (-1) | 1,404 (+14%) | 8mo | $199,500 | $142 | 46 |
Match score weights: distance 35% · size 25% · config 20% · recency 20%. Top-matched comps best support the ARV.
Projected returns pro-forma
-3.0% appreciation · 0.62% rent growth · sell at horizon
- IRR
- -17.3%
- Equity multiple
- 0.40×
- Total profit
- $-32,431
- Equity at exit
- $28,926
- IRR
- -14.4%
- Equity multiple
- 0.26×
- Total profit
- $-40,084
- Equity at exit
- $16,774
Cash invested: $54,320 (down + closing). Projections, not guarantees.
Landlord ↔ Tenant lean methodology
- Overall (STATE)
- 87 Strongly Landlord-Friendly
- State Texas
- 87 Strongly Landlord-Friendly · R+5
- County
- — inherits STATE
- City
- — inherits STATE
ZIP-level market 75401
- Home prices YoY
- -20.7%
- Rents YoY
- 0.6%
- Active inventory
- 395
- Price-to-rent
- 9.4×
Monthly cashflow live
- Estimated rent
- $1,725 high interval (Pro) →
- Mortgage (P&I)
- −$1,017
- Tax from tax record
- −$217 /mo · $2,605/yr
- Insurance
- −$81
- HOA
- −$0
- Vacancy / Maint / Mgmt
- −$362
- Net cashflow
- $48
Break-even live
Sensitivity live
| Price | -10% $157 | -5% $102 | +0% $48 | +5% $-7 | +10% $-62 |
|---|---|---|---|---|---|
| Rent | -10% $-89 | -5% $-21 | +0% $48 | +5% $116 | +10% $184 |
| Rate | -1.0pp $145 | -0.5pp $97 | base $48 | +0.5pp $-3 | +1.0pp $-54 |
UW: 25.0% down · 7.5% · 30yr · 1.5% tax · 5.0% vac · 8.0% maint · 8.0% mgmt
Financing live
Cash to close
- Down payment
- $48,500
- Closing costs
- $5,820
- Reserves months
- —
- Total cash needed
- —
Loan-product check · same deal, 3 products live
Conventional
25% down · 7.5% · 30yr
- Down + closing
- —
- Monthly P&I
- —
- Monthly cashflow
- —
- DSCR
- —
- Eligible?
- —
Personal DTI + credit; lowest rate.
DSCR
20% down · 8.5% · 30yr
- Down + closing
- —
- Monthly P&I
- —
- Monthly cashflow
- —
- DSCR
- —
- Eligible?
- —
No personal income docs; deal must DSCR.
Hard money
10% down · 12.0% · 12mo
- Down + closing
- —
- Monthly P&I
- —
- Monthly cashflow
- —
- DSCR
- —
- Eligible?
- —
Short-term bridge; refi at stabilization.
Rent comps 40 comps
| Address | Beds | Baths | Sqft | Rent | $/sqft | DOM | Units | Dist |
|---|---|---|---|---|---|---|---|---|
| 4909 Delano St Greenville, TX | 3.0–4.0 | 2.0–2.5 | 1614 | $2,225 | $1.38 | 0d | 1 | 0.03mi |
| 1712 Manor Garden Curv Greenville, TX | 3.0 | 2.0 | 1108 | $1,425 | $1.29 | 45d | 1 | 0.10mi |
| 1716 Manor Garden Curv Unit 75401 Greenville, TX | 3.0 | 2.0 | 1108 | $1,525 | $1.38 | 26d | 1 | 0.12mi |
| 1902 Oliver St Greenville, TX | 3.0 | 2.0 | 1380 | $1,700 | $1.23 | 4d | 1 | 0.16mi |
| 1906 Oliver St Greenville, TX | 3.0 | 2.0 | 1380 | $1,650 | $1.20 | 4d | 1 | 0.18mi |
| 2006 Morgan St Greenville, TX | 3.0 | 2.0 | 1215 | $1,450 | $1.19 | 45d | 1 | 0.37mi |
| 4709 Henry St Greenville, TX | 3.0 | 2.0 | 1299 | $1,550 | $1.19 | 9d | 1 | 0.42mi |
| 1711 Langford St Greenville, TX | 3.0 | 1.5 | 1274 | $1,495 | $1.17 | 24d | 1 | 0.53mi |
| 1711 Langford St Greenville, TX | 3.0 | 1.5 | 1274 | $1,495 | $1.17 | 26d | 1 | 0.53mi |
| 2225 College St Greenville, TX | 3.0 | 2.0 | 1439 | $1,800 | $1.25 | 26d | 1 | 0.59mi |
| 4506 Pickett St Greenville, TX | 3.0 | 2.0 | 1024 | $1,395 | $1.36 | 20d | 1 | 0.65mi |
| 2209 Wellington St Greenville, TX | 3.0 | 2.0 | 1372 | $1,499 | $1.09 | 0d | 1 | 0.66mi |
| 2406 Beecha St Greenville, TX | 3.0 | 2.0 | 1263 | $1,575 | $1.25 | 45d | 1 | 0.71mi |
| 3840 McDougal St Greenville, TX | 3.0 | 2.0 | 1458 | $2,000 | $1.37 | 9d | 1 | 0.75mi |
| 5904 Lee St Greenville, TX | 3.0 | 1.0 | 1224 | $1,500 | $1.23 | 45d | 1 | 0.80mi |
| 3603 McDougal St Greenville, TX | 5.0 | 2.0 | 1472 | $1,850 | $1.26 | 45d | 1 | 0.89mi |
| 3604 Bourland St Greenville, TX | 3.0 | 2.0 | 1028 | $1,360 | $1.32 | 45d | 1 | 0.90mi |
| 2811 Walnut St Greenville, TX | 3.0 | 2.0 | 1368 | $1,595 | $1.17 | 45d | 1 | 0.95mi |
| 3605 Eutopia St Greenville, TX | 3.0 | 1.0 | 1156 | $1,450 | $1.25 | 45d | 1 | 0.96mi |
| 804 County Road 1058 Greenville, TX | 3.0 | 2.0 | 1200 | $1,750 | $1.46 | 0d | 1 | 0.99mi |
| 3307 Polk St Unit A Greenville, TX | 3.0 | 2.0 | 1288 | $1,550 | $1.20 | 19d | 1 | 1.01mi |
| 3305 Stevens St Greenville, TX | 3.0 | 2.0 | 1069 | $1,475 | $1.38 | 45d | 1 | 1.01mi |
| 3305 Stevens St Unit B Greenville, TX | 3.0 | 2.0 | 1069 | $1,350 | $1.26 | 45d | 1 | 1.01mi |
| 3305 Stevens St Unit A Greenville, TX | 3.0 | 2.0 | 1069 | $1,300 | $1.22 | 45d | 1 | 1.01mi |
| 2907 Texas St Greenville, TX | 3.0 | 2.0 | 1028 | $1,314 | $1.28 | 45d | 1 | 1.05mi |
| 3333 Dalton St Greenville, TX | 3.0 | 2.0 | 1493 | $1,635 | $1.10 | 26d | 1 | 1.07mi |
| 3333 Dalton St Greenville, TX | 3.0 | 2.0 | 1493 | $1,635 | $1.10 | 7d | 1 | 1.07mi |
| 3333 Dalton St Greenville, TX | 3.0 | 2.0 | 1493 | $1,635 | $1.10 | 9d | 1 | 1.07mi |
| 3509 Pickett St Greenville, TX | 3.0 | 2.0 | 1090 | $1,550 | $1.42 | 0d | 1 | 1.09mi |
| 4405 Oneal St Unit 4 Greenville, TX | 3.0 | 2.0 | 1005 | $1,275 | $1.27 | 45d | 1 | 1.10mi |
| 3614 Short St Greenville, TX | 3.0 | 2.0 | 1323 | $1,600 | $1.21 | 45d | 1 | 1.11mi |
| 3614 Short St Greenville, TX | 3.0 | 2.0 | 1323 | $1,575 | $1.19 | 0d | 1 | 1.11mi |
| 902 Clark St Greenville, TX | 3.0 | 2.0 | 1200 | $1,900 | $1.58 | 45d | 1 | 1.15mi |
| 3113 Bourland St Greenville, TX | 3.0 | 2.0 | 1200 | $1,650 | $1.38 | 0d | 1 | 1.15mi |
| 1707 Wright St Greenville, TX | 3.0 | 2.0 | 1400 | $1,725 | $1.23 | 7d | 1 | 1.18mi |
| 3303 Texas St Greenville, TX | 3.0 | 1.0 | 1260 | $1,450 | $1.15 | 4d | 1 | 1.18mi |
| 1901 Wright St Greenville, TX | 3.0 | 2.0 | 1260 | $1,550 | $1.23 | 0d | 1 | 1.19mi |
| 2113 Wright St Unit A Greenville, TX | 3.0 | 2.5 | 1436 | $1,800 | $1.25 | 45d | 1 | 1.21mi |
| 3020 Henry St Unit A Greenville, TX | 3.0 | 2.0 | 1100 | $2,800 | $2.55 | 45d | 1 | 1.21mi |
| 3020 Henry St Unit B Greenville, TX | 3.0 | 2.0 | 1100 | $2,850 | $2.59 | 45d | 1 | 1.21mi |
Listing history 7 events
-
2026-04-02status Pending
-
2026-03-24historical Active Option Contract
-
2026-03-22price $194,000
-
2026-01-15$189,000 Active
-
2023-03-15soldstatus
-
2019-04-29soldstatus
-
1991-02-08soldstatus
ⓘ Source: listings_history table (triggers on properties + properties_extension) + one-shot
backfill from property_details.listing_events for pre-trigger history.
Tax reassessment forecast TX · Resets to sale price
- Current annual tax
- $2,605 · $217/mo
- Projected year-2 tax
- $3,550 · $296/mo
- Expected delta
- +$945/yr (+$79/mo · 36.3%)
ⓘ Screening estimate from a state-policy table — verify with the county assessor before closing.
Climate risk First Street
- Flood 1/10 Low FEMA zone X (unshaded) · 0% chance over 30 yrs
- Wildfire 6/10 Major
- Heat 7/10 Severe 7 d/yr ≥110°F today · 23 d/yr by 30 yrs out
- Wind 6/10 Major 27% chance of damaging wind over 30 yrs
- Air quality 2/10 Low 1 unhealthy d/yr today · 1 by 30 yrs out
Nearby sold comps map
Loading sold comps map…
Walkable amenities ~0.75 mi
Loading nearby amenities…
Taxation est. · year 1
- Rental income
- $20,702
- − Mortgage interest
- −$10,867
- − Property taxes
- −$2,605
- − Insurance
- −$970
- − Repairs & maintenance
- −$1,656
- − Management
- −$1,656
- − Depreciation
- −$5,644
- Taxable loss
- −$2,696
- Est. tax savings @ 24.0%
- +$647
- After-tax cash flow
- $1,218/yr
For passive investors: Depreciation is non-cash, so a rental often shows a tax loss while cash-flowing — sheltering income. Rental losses are passive: they offset passive income freely, and up to $25,000/yr can offset ordinary (W-2) income if you actively participate and your MAGI is under $100k (phasing out to $0 by $150k); unused losses carry forward. On sale, claimed depreciation is recaptured at up to 25%, and gains may owe capital-gains tax (a 1031 exchange can defer both). Figures are a year-1 estimate at your 24.0% rate — not tax advice; consult a CPA.
Schools (NCES district)
- District
- Greenville ISD
- NCES district ID
- 4821720
- Math proficiency
- 20% ▼ -12.00%
- Reading proficiency
- 26% ▼ -7.00%
- Median HH income
- $41,374
- Composite
- 19.56/100
- National rank
- #8759
- State rank
- #743 of 826 in TX
Livability — Greenville
- Score
- 77/100
- State rank
- #78
- US rank
- #2719
Category grades
Schools grade is shown separately in the Schools card above.
Census & demographics
- Census place
- Greenville, TX
- County
- Hunt County · 71,969 people
- City population
- 42,767
- Metro
- Dallas-Fort Worth-Arlington, TX
- Population (ZIP)
- 22,669
- Household income
- $59,908
- Rent vs Own
- Severe rent burden
- 638.0
Population outlook (Hunt County) Hauer SSP2
- Today (2025)
- 97,090 people
- By 2030
- 100,452 · +3.5%
- By 2040
- 106,544 · +9.7%
- By 2050
- 111,218 · +14.6%
- By 2075
- 121,695 · +25.3%
- By 2100
- 123,683 · +27.4%
Race, ethnicity, and origin ACS 2023
- Neighborhood character
- Diverse neighborhood (Simpson 0.62)
- Race & ethnicity
- White 51% Hispanic / Latino 32% Black 13% Two or more races 11%
- Hispanic origin (detail)
- Mexican 30%
- Common ancestry
- Slovak 2% Lithuanian 1% Iranian 1%
- Foreign-born
- 13% · Canada
- Languages at home
- 75% English-only · Spanish 24%
Political lean MEDSL · Hunt
- 2024 margin
- Solid R (+55.5) · D 21.9% · R 77.4%
- 2008→2024 swing
- -14.9pp toward R · 2008: -40.6pp · 2024: -55.5pp
- All cycles
- 2024: R+55.5 2020: R+52.5 2016: R+56.3 2012: R+51.2 2008: R+40.6
Not yet ingested
- Civics
- —
Market trends
- HPI YoY
- ▼ -88.45%
- Current HPI
- 339.0287
- Rent YoY
- ▲ 0.62%
- Metro
- Dallas-Fort Worth-Arlington, TX
- State GDP YoY
- ▲ 3.95%
- F500 in state
- 110
Industry mix (Fortune 500 HQ in TX)
| Industry | F500 HQs | Revenue |
|---|---|---|
| Energy | 16 | $1,198B |
|
||
| Technology | 5 | $198B |
|
||
| Engineering / Construction | 4 | $72B |
|
||
| Energy Services | 3 | $60B |
|
||
| Utilities | 3 | $41B |
|
||
| Healthcare | 2 | $330B |
|
||
Price history
+2.6% since first listed7 events — show timeline
- 2026-04-02 Pending — NTREIS
- 2026-03-24 Contingent — NTREIS
- 2026-03-22 Price Changed $194,000 NTREIS
- 2026-01-15 Listed $189,000 NTREIS
- 2023-03-15 Sold (Public Records) — Public Records
- 2019-04-29 Sold (Public Records) — Public Records
- 1991-02-08 Sold (Public Records) — Public Records
Property tax history
+5.9%/yrLatest (2025): $2,605 · +5.1% YoY. Source: county tax records.
Cash-flow waterfall
monthlySold comps — $/sqft
last 12 mo · ≤1 miLoading sold comps…