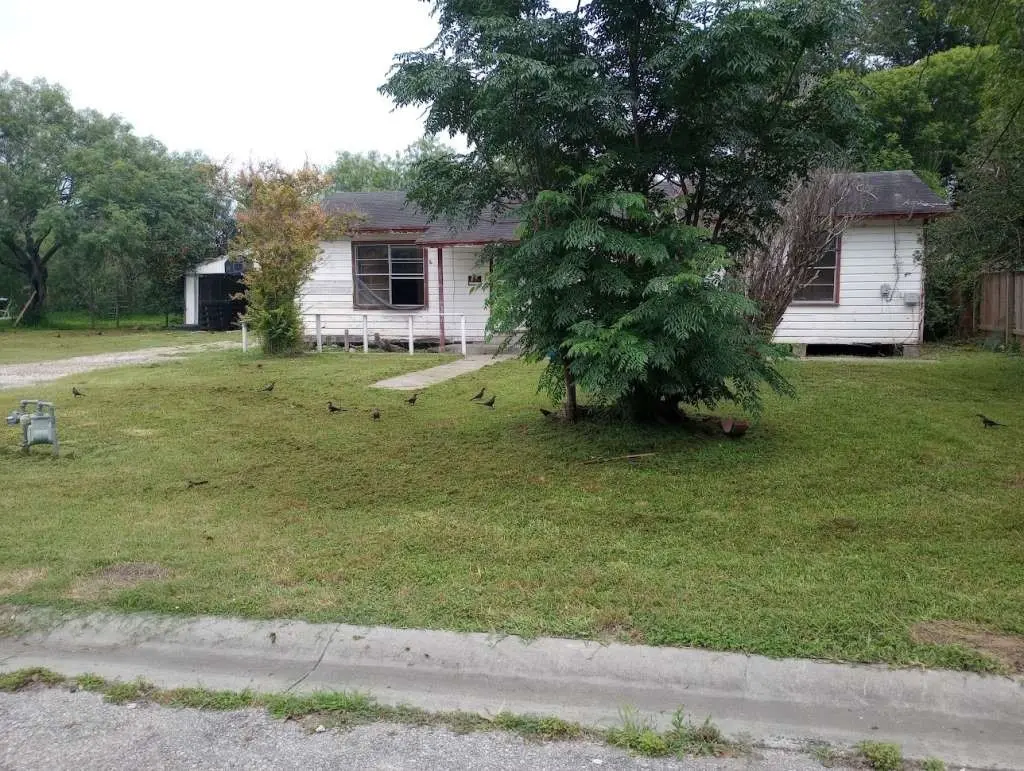
709 Avenue F · Sinton, TX
Flood risk 5/10 · Moderate
- FEMA flood zone
- X (unshaded)
- Chance of flooding over 30 yrs
- 0.46%
- Est. flood insurance / yr
- $507 – $1,088
Fire risk 3/10 · Minor
- Est. fire insurance / yr
- $1,222 – $2,270
Heat risk 9/10 · Severe
- Hot days now (above 109°F)
- 7 days/yr
- Hot days in 30 yrs
- 24 days/yr
Wind risk 9/10 · Severe
- Chance of severe wind over 30 yrs
- 99.0%
Air-quality risk 1/10 · Minimal
- Unhealthy air days now
- 0 days/yr
- Unhealthy air days in 30 yrs
- 0 days/yr
Risk factors via First Street. Map © Google.
Why this score? — see what drove the B grade
The composite is a weighted blend of 9 inputs, each scored 0–100. Each bar is that input's sub-score; the figure is the points it added to the 100-point composite (weight × sub-score).
- Cash flow +29.1/30.0
- ARV discount +15.0/15.0
- DSCR +10.0/10.0
- 1% rule +7.9/10.0
- Livability +3.2/5.0
- Schools +2.6/10.0
- Rent growth +2.5/5.0
- Condition / age +2.5/5.0
- Appreciation +0.0/10.0
$135,799
🖨 Deal sheet 📄 Offer letter ✓ Due diligence
Listing remarks MLS
Located in Sinton, TX, 709 Avenue F is surrounded by the charm and convenience of a close-knit community. Featuring four bedrooms, one bathroom, and a two-car garage, this property puts you within easy reach of local schools, parks, and shopping areas, making daily life both convenient and enjoyable. Its proximity to larger cities offers the perfect balance of small-town tranquility and access to urban amenities. Ideal for families or anyone looking for a peaceful setting with the benefits of city life just a short drive away. The home does need some TLC and renovations, but can quickly become home-sweet-home in no time! This home is currently being sold in it's current state.
Key facts
- Close-knit community
- Peaceful setting
- 0.32 acre lot
Tags
Neighborhood map
What this means for you Summary
Snapshot
- This is a 4-bed/1.0-bath single-family listed at $136k.
Deal economics
- At list price, monthly cash flow is $468 ($6k/yr) — positive.
- The deal already cash-flows at list — no discount required.
- Meets the 1% rule at list price ($2k rent vs $136k).
- Recommended offer: $120k (12.0% below list) — sets the bar for market timing.
- Cap rate 10.4% vs local median 3.8% in Sinton — top-decile yield for the area; either an underpriced asset or a hidden risk that comps aren't pricing in. Stress-test before assuming the spread holds.
Location & tenants
- Location reads 65/100 on livability (#667 in TX) — a middle-class / working-renter tenant base. Strengths: cost of living A+, health & safety A+, housing A-; Watch: schools F, amenities F, commute F.
- Sinton ISD (town): math 27% / reading 35% proficiency, ranked #601 of 826 in TX (top 73%) — families likely to look elsewhere, expect single-tenant / working-renter base with shorter leases; 67% free/reduced lunch — lower-income household profile, screen leases tightly.
- Market conditions: 159 active listings in the ZIP; 1 comparable units currently listed for rent nearby; 344 units permitted in San Patricio County in 2024 (0 in 5+ unit buildings).
Forward outlook
- Local home prices are declining (-3.0%/yr); year-one equity from $939 of loan paydown is wiped out by about $4k of value loss. Plan a longer hold.
- San Patricio County population projected at +27% by 2050 — long-run rental-demand tailwind backs the buy-and-hold thesis.
- At projected returns (-3.0% appreciation + 3.0% rent growth), your $38k cash investment doubles in ~8 years — after that, you're playing with house money.
Negotiation context
- It's been on market 724 days — a 12% lower offer ($120k) is reasonable based on typical stale-listing flexibility.
Risks & watch-outs
- Climate carrying-cost: moderate flood risk; severe wind risk, 99% chance of damaging wind over 30y; extreme-heat days projected 7→24/yr by 2055 (HVAC capex compounding) — expect insurance premiums to compound above CPI over the hold.
Questions for the listing agent
- It's been on market 724 days. Have you received any prior offers? Is the seller open to a 12% concession, seller financing, or rate buy-down credit?
- Built in 1976 — when were the roof, HVAC, electrical panel, plumbing, and water heater last replaced?
- Why hasn't it sold? Are there any deal-killer items the seller is aware of (foundation, flood, title, zoning, code violations)?
- Is there a deadline driving the sale (1031 exchange, divorce, estate, relocation)? That informs how much negotiation room exists.
- Schools are F-rated, which usually means shorter tenancies and higher turnover. Who's the typical renter profile here, and what's been the actual vacancy rate?
- What's the average days-on-market for RENTAL listings here right now (not sales)? A rising rental-DOM trend means longer vacancies and softer asking-rent achievability than the comps imply.
- What's the recent tenant-quality profile in this submarket — average credit score on applications, eviction rate, late-payment / NSF rate, and stable-employment percentage? A property-management company in the area should have these aggregated.
- How much new for-sale + rental construction is in the pipeline within 1–3 miles? Heavy new supply typically softens prices + rents 12–24 months out; constrained supply supports both.
Investment metrics
- 1% rule
- 1.29% ✓
- Cap rate
- 10.43%
- Cash-on-cash
- 14.76%
- DSCR
- 1.66
- GRM
- 6.5
CMA / ARV
- ARV (median comp)
- $169,450
- List price
- $135,799
- Delta
- -19.86%
- Verdict
- UNDERPRICED
- Comps
- 20 within 1.0 mi
Show comp detail 11 sales within ~0.75 mi
| Address | Dist | Beds/Ba | Sqft | Sold | Price | $/sf | Match |
|---|---|---|---|---|---|---|---|
| 606 Avenue F | 0.08mi | 4/2.0 | 1,148 (-5%) | 10mo | $199,900 | $174 | 75 |
| 600 E Merriman St | 0.30mi | 3/2.0 (-1) | 1,301 (+7%) | 2mo | $60,000 | $46 | 63 |
| 1018 Laredo St | 0.24mi | 4/1.0 | 1,120 (-8%) | 20mo | $155,900 | $139 | 60 |
| 621 E Merriman St | 0.33mi | 3/2.0 (-1) | 1,170 (-4%) | 13mo | $165,750 | $142 | 59 |
| 117 Moonlite | 0.29mi | 3/1.0 (-1) | 1,344 (+11%) | 7mo | $189,900 | $141 | 58 |
| 509 Avenue B | 0.33mi | 3/2.0 (-1) | 1,202 (-1%) | 20mo | $165,000 | $137 | 58 |
| 212 Hugh St | 0.59mi | 3/2.0 (-1) | 1,240 (+2%) | 5mo | $135,000 | $109 | 56 |
| 203 W Fourth St | 0.38mi | 3/2.0 (-1) | 1,058 (-13%) | 4mo | $169,900 | $161 | 49 |
| 400 Avenue B | 0.41mi | 3/2.0 (-1) | 1,096 (-10%) | 14mo | $179,999 | $164 | 44 |
| 925 E 4th St | 0.21mi | 3/2.0 (-1) | 1,347 (+11%) | 22mo | $239,000 | $177 | 44 |
| 113 N Pirate Blvd | 0.60mi | 3/2.0 (-1) | 1,325 (+9%) | 22mo | $175,000 | $132 | 30 |
Match score weights: distance 35% · size 25% · config 20% · recency 20%. Top-matched comps best support the ARV.
Projected returns pro-forma
-3.0% appreciation · 3.0% rent growth · sell at horizon
- IRR
- 5.3%
- Equity multiple
- 1.21×
- Total profit
- $7,796
- Equity at exit
- $20,248
- IRR
- 14.7%
- Equity multiple
- 2.19×
- Total profit
- $45,196
- Equity at exit
- $11,741
Cash invested: $38,024 (down + closing). Projections, not guarantees.
Landlord ↔ Tenant lean methodology
- Overall (STATE)
- 87 Strongly Landlord-Friendly
- State Texas
- 87 Strongly Landlord-Friendly · R+5
- County
- — inherits STATE
- City
- — inherits STATE
ZIP-level market 78387
- Active inventory
- 159
- Price-to-rent
- 6.5×
Monthly cashflow live
- Estimated rent
- $1,750 medium interval (Pro) →
- Mortgage (P&I)
- −$712
- Tax from tax record
- −$146 /mo · $1,753/yr
- Insurance
- −$57
- HOA
- −$0
- Vacancy / Maint / Mgmt
- −$368
- Net cashflow
- $468
Break-even live
UW: 25.0% down · 7.5% · 30yr · 1.5% tax · 5.0% vac · 8.0% maint · 8.0% mgmt
Financing live
Cash to close
- Down payment
- $33,950
- Closing costs
- $4,074
- Reserves months
- —
- Total cash needed
- —
Loan-product check · same deal, 3 products live
Conventional
25% down · 7.5% · 30yr
- Down + closing
- —
- Monthly P&I
- —
- Monthly cashflow
- —
- DSCR
- —
- Eligible?
- —
Personal DTI + credit; lowest rate.
DSCR
20% down · 8.5% · 30yr
- Down + closing
- —
- Monthly P&I
- —
- Monthly cashflow
- —
- DSCR
- —
- Eligible?
- —
No personal income docs; deal must DSCR.
Hard money
10% down · 12.0% · 12mo
- Down + closing
- —
- Monthly P&I
- —
- Monthly cashflow
- —
- DSCR
- —
- Eligible?
- —
Short-term bridge; refi at stabilization.
Rent comps 1 comps
| Address | Beds | Baths | Sqft | Rent | $/sqft | DOM | Units | Dist |
|---|---|---|---|---|---|---|---|---|
| 804 Avenue B St Unit B Sinton, TX | 3.0 | 2.0 | 1092 | $1,750 | $1.60 | 21d | 1 | 0.38mi |
Listing history 18 events
-
2026-06-18days on market $135,799 Active 724 DOM
-
2026-06-17days on market $135,799 Active 723 DOM
-
2026-06-16days on market $135,799 Active 722 DOM
-
2026-06-15days on market $135,799 Active 721 DOM
-
2026-06-15days on market $135,799 Active 720 DOM
-
2026-06-13days on market $135,799 Active 719 DOM
-
2026-06-12days on market $135,799 Active 718 DOM
-
2026-06-09days on market $135,799 Active 715 DOM
-
2026-06-08days on market $135,799 Active 714 DOM
-
2026-06-08days on market $135,799 Active 713 DOM
-
2026-06-05days on market $135,799 Active 711 DOM
-
2026-06-03days on market $135,799 Active 709 DOM
-
2026-06-02days on market $135,799 Active 708 DOM
-
2026-06-01days on market $135,799 Active 707 DOM
-
2026-05-31days on market $135,799 Active 706 DOM
-
2024-09-09price $135,799 685-char remark
Show marketing remark (685 chars)
Located in Sinton, TX, 709 Avenue F is surrounded by the charm and convenience of a close-knit community. Featuring four bedrooms, one bathroom, and a two-car garage, this property puts you within easy reach of local schools, parks, and shopping areas, making daily life both convenient and enjoyable. Its proximity to larger cities offers the perfect balance of small-town tranquility and access to urban amenities. Ideal for families or anyone looking for a peaceful setting with the benefits of city life just a short drive away. The home does need some TLC and renovations, but can quickly become home-sweet-home in no time! This home is currently being sold in it's current state.
-
2024-06-24$139,999 Active 685-char remark
Show marketing remark (685 chars)
Located in Sinton, TX, 709 Avenue F is surrounded by the charm and convenience of a close-knit community. Featuring four bedrooms, one bathroom, and a two-car garage, this property puts you within easy reach of local schools, parks, and shopping areas, making daily life both convenient and enjoyable. Its proximity to larger cities offers the perfect balance of small-town tranquility and access to urban amenities. Ideal for families or anyone looking for a peaceful setting with the benefits of city life just a short drive away. The home does need some TLC and renovations, but can quickly become home-sweet-home in no time! This home is currently being sold in it's current state.
-
2007-01-24soldstatus
ⓘ Source: listings_history table (triggers on properties + properties_extension) + one-shot
backfill from property_details.listing_events for pre-trigger history.
Tax reassessment forecast TX · Resets to sale price
- Current annual tax
- $1,753 · $146/mo
- Projected year-2 tax
- $2,485 · $207/mo
- Expected delta
- +$733/yr (+$61/mo · 41.8%)
ⓘ Screening estimate from a state-policy table — verify with the county assessor before closing.
Climate risk First Street
- Flood 5/10 Major FEMA zone X (unshaded) · 46% chance over 30 yrs
- Wildfire 3/10 Moderate
- Heat 9/10 Extreme 7 d/yr ≥109°F today · 24 d/yr by 30 yrs out
- Wind 9/10 Extreme 99% chance of damaging wind over 30 yrs
- Air quality 1/10 Low 0 unhealthy d/yr today · 0 by 30 yrs out
Nearby sold comps map
Loading sold comps map…
Walkable amenities ~0.75 mi
Loading nearby amenities…
Taxation est. · year 1
- Rental income
- $21,000
- − Mortgage interest
- −$7,607
- − Property taxes
- −$1,753
- − Insurance
- −$679
- − Repairs & maintenance
- −$1,680
- − Management
- −$1,680
- − Depreciation
- −$3,951
- Taxable income
- $3,651
- Est. tax owed @ 24.0%
- −$876
- After-tax cash flow
- $4,736/yr
For passive investors: Depreciation is non-cash, so a rental often shows a tax loss while cash-flowing — sheltering income. Rental losses are passive: they offset passive income freely, and up to $25,000/yr can offset ordinary (W-2) income if you actively participate and your MAGI is under $100k (phasing out to $0 by $150k); unused losses carry forward. On sale, claimed depreciation is recaptured at up to 25%, and gains may owe capital-gains tax (a 1031 exchange can defer both). Figures are a year-1 estimate at your 24.0% rate — not tax advice; consult a CPA.
Schools (NCES district)
- District
- Sinton ISD
- NCES district ID
- 4840350
- Math proficiency
- 27% ▼ -19.00%
- Reading proficiency
- 35% ▼ -3.00%
- Median HH income
- $44,618
- Composite
- 26.49/100
- National rank
- #7208
- State rank
- #601 of 826 in TX
Livability — Sinton
- Score
- 65/100
- State rank
- #667
- US rank
- #12510
Category grades
Schools grade is shown separately in the Schools card above.
Census & demographics
- Census place
- Sinton, TX
- Population (ZIP)
- 9,604
Population outlook (San Patricio County) Hauer SSP2
- Today (2025)
- 75,538 people
- By 2030
- 79,575 · +5.3%
- By 2040
- 87,670 · +16.1%
- By 2050
- 96,107 · +27.2%
- By 2075
- 117,984 · +56.2%
- By 2100
- 130,010 · +72.1%
Race, ethnicity, and origin ACS 2023
- Neighborhood character
- Predominantly Hispanic (71%)
- Race & ethnicity
- Hispanic / Latino 71% Two or more races 33% White 25% Black 2%
- Hispanic origin (detail)
- Mexican 64%
- Common ancestry
- Lithuanian 1%
- Foreign-born
- 2% · Canada
- Languages at home
- 62% English-only · Spanish 38%
Political lean MEDSL · San Patricio
- 2024 margin
- Solid R (+36.4) · D 31.4% · R 67.8%
- 2008→2024 swing
- -19.8pp toward R · 2008: -16.6pp · 2024: -36.4pp
- All cycles
- 2024: R+36.4 2020: R+29.1 2016: R+24.1 2012: R+20.6 2008: R+16.6
Not yet ingested
- Civics
- —
Market trends
- HPI YoY
- ▼ -81.32%
- Current HPI
- 149.9517
- Rent YoY
- —
- Metro
- —
- State GDP YoY
- ▲ 3.95%
- F500 in state
- 110
Industry mix (Fortune 500 HQ in TX)
| Industry | F500 HQs | Revenue |
|---|---|---|
| Energy | 16 | $1,198B |
|
||
| Technology | 5 | $198B |
|
||
| Engineering / Construction | 4 | $72B |
|
||
| Energy Services | 3 | $60B |
|
||
| Utilities | 3 | $41B |
|
||
| Healthcare | 2 | $330B |
|
||
Price history
-3.0% since first listed3 events — show timeline
- 2024-09-09 Price Changed $135,799 HARMLS
- 2024-06-24 Listed $139,999 HARMLS
- 2007-01-24 Sold (Public Records) — Public Records
Property tax history
+0.7%/yrLatest (2025): $1,753 · -11.8% YoY. Source: county tax records.
Cash-flow waterfall
monthlySold comps — $/sqft
last 12 mo · ≤1 miLoading sold comps…