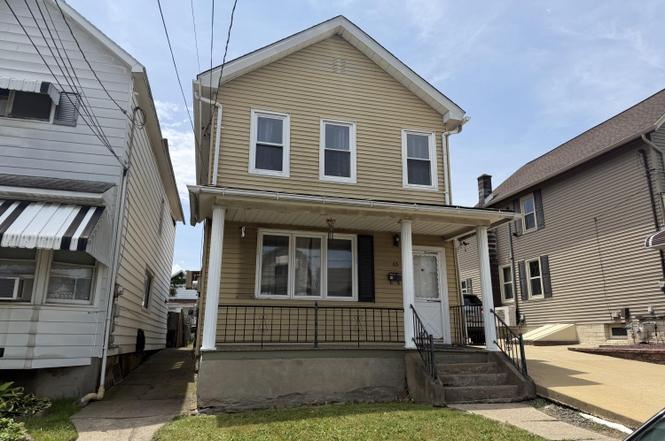
63 Moyallen St · Wilkes-Barre, PA
Flood risk 1/10 · Minimal
- FEMA flood zone
- X (unshaded)
- Chance of flooding over 30 yrs
- 0.0%
- Est. flood insurance / yr
- $507 – $1,088
Fire risk 4/10 · Minor
- Est. fire insurance / yr
- $511 – $949
Heat risk 4/10 · Minor
- Hot days now (above 97°F)
- 7 days/yr
- Hot days in 30 yrs
- 16 days/yr
Wind risk 3/10 · Minor
- Chance of severe wind over 30 yrs
- 5.0%
Air-quality risk 2/10 · Minimal
- Unhealthy air days now
- 1 days/yr
- Unhealthy air days in 30 yrs
- 2 days/yr
Risk factors via First Street. Map © Google.
Why this score? — see what drove the B+ grade
The composite is a weighted blend of 9 inputs, each scored 0–100. Each bar is that input's sub-score; the figure is the points it added to the 100-point composite (weight × sub-score).
- Cash flow +30.0/30.0
- ARV discount +15.0/15.0
- 1% rule +10.0/10.0
- DSCR +10.0/10.0
- Rent growth +4.2/5.0
- Livability +2.5/5.0
- Condition / age +2.5/5.0
- Schools +2.1/10.0
- Appreciation +0.0/10.0
$65,000
🖨 Deal sheet (PDF) 📄 Offer letter ✓ Due diligence
Listing remarks
Nice starter or investment property. Needs TLC. Large room sizes. Fenced yard. First floor laundryDO NOT PARK IN THE NEIGHBORS DRIVEWAY! YOU WILL GET TOWED!
Key facts
- 2,614 sq ft lot
- Listed 4 days
Property features AI
Exterior
- Utilities: Public water; Public sewer; Cable available
- Home design: Single-family residence; Two stories
- Construction: Aluminum siding
- Exterior features: Deck; Fenced yard
Interior
- Kitchen: Eat-in kitchen
- Bedrooms: Total of 4 rooms (includes bedrooms and living spaces)
- Flooring: Hardwood flooring
- Bathrooms: 1 full bathroom
- Heating & cooling: Natural gas heating; Baseboard heating; Ceiling fan(s)
- Interior features: Eat-in kitchen; Gas water heater
Neighborhood map
What this means for you Summary
Snapshot
- This is a 2-bed/1.0-bath single-family listed at $65k.
Deal economics
- At list price, monthly cash flow is $575 ($7k/yr) — positive.
- The deal already cash-flows at list — no discount required.
- Meets the 1% rule at list price ($1k rent vs $65k).
- Cap rate 16.9% vs local median 5.9% in Wilkes-Barre — top-decile yield for the area; either an underpriced asset or a hidden risk that comps aren't pricing in. Stress-test before assuming the spread holds.
Location & tenants
- Location reads: area grade B — affects rentability + tenant quality, not the cash-flow math above.
- Wilkes-Barre Area SD (urban): math 19% / reading 32% proficiency, ranked #469 of 539 in PA (top 87%) — low school quality limits family demand, transient renter base, plan for 1-2y turnover; 61% free/reduced lunch — lower-income household profile, screen leases tightly.
- Zoned schools: Dodson El Sch (math 2% / reading 22%, grade F, #1,362 of 1,518 statewide, top 92%, 486 students, 100% FRL); G A R Ms (math 17% / reading 22%, grade F, #444 of 512 statewide, top 87%, 1,026 students, 100% FRL) — zoned schools average 100% FRL vs 61% district-wide (39 pts higher); higher-poverty schools than district average — tighter screening recommended.
- Market conditions: Rents rising fast (+6.8%/yr); 225 active listings in the ZIP; 40 comparable units currently listed for rent nearby; rentals at typical pace (median 23d on market — plan ~3-4 weeks tenant-placement turnaround); 48% of comp listings sitting > 30 days — soft ceiling on asking rent; 349 units permitted in Luzerne County in 2024 (16 in 5+ unit buildings).
Forward outlook
- Local home prices are declining (-3.0%/yr); year-one equity from $449 of loan paydown is wiped out by about $2k of value loss. Plan a longer hold.
- Luzerne County population projected at +4% by 2050 — modest demand growth; plan on rents tracking national, not racing it.
- At projected returns (-3.0% appreciation + 6.8% rent growth), your $18k cash investment doubles in ~3 years — after that, you're playing with house money.
Negotiation context
- Only 4 days on market — expect competitive offers; lowballing is unlikely to land.
- Current owner paid $45k; 44% above their basis — modest negotiation headroom, anchor on the comps not their cost.
Risks & watch-outs
- Watch-outs: built in 1910 — expect roof / HVAC / electrical / plumbing capex.
Questions for the listing agent
- Built in 1910 — when were the roof, HVAC, electrical panel, plumbing, and water heater last replaced?
- Is there a deadline driving the sale (1031 exchange, divorce, estate, relocation)? That informs how much negotiation room exists.
- What's the average days-on-market for RENTAL listings here right now (not sales)? A rising rental-DOM trend means longer vacancies and softer asking-rent achievability than the comps imply.
- What's the recent tenant-quality profile in this submarket — average credit score on applications, eviction rate, late-payment / NSF rate, and stable-employment percentage? A property-management company in the area should have these aggregated.
- How much new for-sale + rental construction is in the pipeline within 1–3 miles? Heavy new supply typically softens prices + rents 12–24 months out; constrained supply supports both.
Investment metrics
- 1% rule
- 1.99% ✓
- Cap rate
- 16.91%
- Cash-on-cash
- 37.92%
- DSCR
- 2.69
- GRM
- 4.2
CMA / ARV
- ARV (on-the-fly)
- $126,464
- Comps found
- 12
Show comp detail 12 sales within ~0.75 mi
| Address | Dist | Beds/Ba | Sqft | Sold | Price | $/sf | Match |
|---|---|---|---|---|---|---|---|
| 64 Prospect St | 0.03mi | 3/1.0 (+1) | 1,231 (+1%) | 1mo | $123,000 | $100 | 91 |
| 131 Stanton St | 0.10mi | 3/1.0 (+1) | 1,200 (-1%) | 0mo | $110,500 | $92 | 88 |
| 71 Prospect St | 0.05mi | 3/1.0 (+1) | 1,120 (-8%) | 0mo | $115,000 | $103 | 79 |
| 127 Loomis St | 0.32mi | 2/2.0 | 1,245 (+2%) | 0mo | $124,000 | $100 | 77 |
| 22 Bruce Ln | 0.39mi | 3/1.0 (+1) | 1,173 (-4%) | 1mo | $125,000 | $107 | 70 |
| 290 Hazle St | 0.25mi | 3/1.5 (+1) | 1,088 (-10%) | 0mo | $152,000 | $140 | 64 |
| 299 Lehigh St | 0.68mi | 3/1.0 (+1) | 1,150 (-5%) | 3mo | $120,000 | $104 | 52 |
| 10 Kirkendall Ave | 0.57mi | 3/1.0 (+1) | 1,100 (-10%) | 3mo | $195,000 | $177 | 50 |
| 255 Lehigh St | 0.61mi | 3/1.5 (+1) | 1,100 (-10%) | 0mo | $170,000 | $155 | 48 |
| 287 Andover St | 0.61mi | 3/2.0 (+1) | 1,312 (+8%) | 2mo | $120,000 | $91 | 48 |
| 368 S Meade St | 0.63mi | 3/1.5 (+1) | 1,341 (+10%) | 2mo | $165,000 | $123 | 44 |
| 187 Grant St | 0.73mi | 3/1.0 (+1) | 1,392 (+14%) | 2mo | $105,000 | $75 | 36 |
Match score weights: distance 35% · size 25% · config 20% · recency 20%. Top-matched comps best support the ARV.
Projected returns pro-forma
-3.0% appreciation · 6.84% rent growth · sell at horizon
- IRR
- 38.3%
- Equity multiple
- 2.72×
- Total profit
- $31,320
- Equity at exit
- $9,692
- IRR
- 46.6%
- Equity multiple
- 6.36×
- Total profit
- $97,629
- Equity at exit
- $5,620
Cash invested: $18,200 (down + closing). Projections, not guarantees.
Landlord ↔ Tenant lean methodology
- Overall (STATE)
- 62 Landlord-Friendly
- State Pennsylvania
- 62 Landlord-Friendly · EVEN
- County
- — inherits STATE
- City
- — inherits STATE
ZIP-level market 18702
- Rents YoY
- 6.8%
- Active inventory
- 225
- Price-to-rent
- 4.2×
Monthly cashflow live
- Estimated rent
- $1,297 high interval (Pro) →
- Mortgage (P&I)
- −$341
- Tax est. 1.5%
- −$81 /mo · $975/yr
- Insurance
- −$27
- HOA
- −$0
- Vacancy / Maint / Mgmt
- −$272
- Net cashflow
- $575
Break-even live
Sensitivity live
| Price | -10% $620 | -5% $598 | +0% $575 | +5% $553 | +10% $530 |
|---|---|---|---|---|---|
| Rent | -10% $473 | -5% $524 | +0% $575 | +5% $626 | +10% $678 |
| Rate | -1.0pp $608 | -0.5pp $592 | base $575 | +0.5pp $558 | +1.0pp $541 |
UW: 25.0% down · 7.5% · 30yr · 1.5% tax · 5.0% vac · 8.0% maint · 8.0% mgmt
Financing live
Cash to close
- Down payment
- $16,250
- Closing costs
- $1,950
- Reserves months
- —
- Total cash needed
- —
Loan-product check · same deal, 3 products live
Conventional
25% down · 7.5% · 30yr
- Down + closing
- —
- Monthly P&I
- —
- Monthly cashflow
- —
- DSCR
- —
- Eligible?
- —
Personal DTI + credit; lowest rate.
DSCR
20% down · 8.5% · 30yr
- Down + closing
- —
- Monthly P&I
- —
- Monthly cashflow
- —
- DSCR
- —
- Eligible?
- —
No personal income docs; deal must DSCR.
Hard money
10% down · 12.0% · 12mo
- Down + closing
- —
- Monthly P&I
- —
- Monthly cashflow
- —
- DSCR
- —
- Eligible?
- —
Short-term bridge; refi at stabilization.
Rent comps 40 comps
| Address | Beds | Baths | Sqft | Rent | $/sqft | DOM | Units | Dist |
|---|---|---|---|---|---|---|---|---|
| 132 Sambourne St Wilkes Barre, PA | 2.0 | 1.0 | 1000 | $1,250 | $1.25 | 22d | 1 | 0.24mi |
| 62 Hutson St Wilkes Barre, PA | 2.0 | 1.0 | 1100 | $1,150 | $1.05 | 45d | 1 | 0.36mi |
| 62 Hutson St Unit 1 Wilkes-Barre, PA | 2.0 | 1.0 | 730 | $1,250 | $1.71 | 15d | 1 | 0.36mi |
| 403 S Franklin St Wilkes Barre, PA | 2.0 | 1.0 | 900 | $1,050 | $1.17 | 22d | 1 | 0.38mi |
| 75 Wood St Wilkes Barre, PA | 2.0 | 1.0 | 990 | $1,300 | $1.31 | 45d | 1 | 0.39mi |
| 32 Murray St Unit 34 Wilkes-Barre, PA | 3.0 | 1.0 | 930 | $1,100 | $1.18 | 22d | 1 | 0.47mi |
| 26 Bradford St Wilkes Barre, PA | 3.0 | 1.5 | 1056 | $1,400 | $1.33 | 15d | 1 | 0.47mi |
| 366 S River St Apt 3 Wilkes-Barre, PA | 1.0 | 1.0 | 1000 | $975 | $0.97 | 22d | 1 | 0.49mi |
| 131 Academy St Wilkes Barre, PA | 3.0 | 1.0 | 1300 | $1,500 | $1.15 | 45d | 1 | 0.50mi |
| 100-102 Westminster St Wilkes-Barre, PA | 2.0 | 1.0 | 1200 | $1,150 | $0.96 | 22d | 1 | 0.52mi |
| 100-102 Westminster St Wilkes-Barre, PA | 2.0 | 1.0 | 1100 | $1,150 | $1.05 | 15d | 1 | 0.52mi |
| 34 Barney St Fl Right Wilkes-Barre, PA | 2.0 | 1.0 | 1000 | $1,195 | $1.20 | 45d | 1 | 0.55mi |
| 155 W River St Wilkes Barre, PA | 3.0 | 2.0 | 1100 | $1,425 | $1.30 | 45d | 1 | 0.57mi |
| 239 Poplar St Wilkes Barre, PA | 3.0 | 1.5 | 1100 | $1,350 | $1.23 | 45d | 1 | 0.58mi |
| 154 Hanover St Unit A Wilkes-Barre, PA | 1.0 | 1.0 | 1050 | $1,150 | $1.10 | 45d | 1 | 0.63mi |
| 156 Hanover St Wilkes Barre, PA | 3.0 | 1.0 | 850 | $1,300 | $1.53 | 15d | 1 | 0.63mi |
| 26 Stanley St Wilkes Barre, PA | 2.0 | 1.0 | 950 | $1,650 | $1.74 | 45d | 1 | 0.66mi |
| 407 McLean St Wilkes Barre, PA | 3.0 | 1.0 | 1482 | $1,400 | $0.94 | 15d | 1 | 0.70mi |
| 233 Gilligan St Wilkes Barre, PA | 3.0 | 1.0 | 1440 | $1,600 | $1.11 | 22d | 1 | 0.76mi |
| 150 S Franklin St Wilkes Barre, PA | 2.0 | 1.0 | 850 | $1,750 | $2.06 | 45d | 1 | 0.77mi |
| 159 New Mallery Pl Unit 2 Wilkes-Barre, PA | 2.0 | 1.0 | 1020 | $950 | $0.93 | 45d | 1 | 0.77mi |
| 224 New Mallery Pl Wilkes Barre, PA | 2.0 | 1.0 | 850 | $1,000 | $1.18 | 15d | 1 | 0.82mi |
| 284 Barney St Wilkes Barre, PA | 3.0 | 1.0 | 1070 | $1,600 | $1.50 | 46d | 1 | 0.84mi |
| 216 Horton St Wilkes Barre, PA | 3.0 | 1.5 | 1475 | $1,575 | $1.07 | 45d | 1 | 0.86mi |
| 129 Carlisle St Wilkes Barre, PA | 2.0 | 1.0 | 1005 | $1,200 | $1.19 | 15d | 1 | 0.89mi |
| 166 Brook St Wilkes Barre, PA | 1.0 | 1.0 | 850 | $1,100 | $1.29 | 15d | 1 | 0.95mi |
| 75 Melrose Ave Apt 2 Wilkes-Barre, PA | 2.0 | 1.0 | 1150 | $1,250 | $1.09 | 45d | 1 | 0.96mi |
| 86 Maffett St Wilkes-Barre, PA | 2.0 | 1.0 | 1032 | $1,300 | $1.26 | 45d | 1 | 0.97mi |
| 67-69 Public Sq #1203 Wilkes Barre, PA | 2.0 | 1.0 | 875 | $1,825 | $2.09 | 45d | 1 | 0.98mi |
| 67-69 Public Sq Wilkes-Barre, PA | 2.0 | 1.0 | 910 | $1,875 | $2.06 | 45d | 1 | 0.99mi |
| 68 Circle Dr Hanover Township, PA | 3.0 | 1.5 | 950 | $1,800 | $1.89 | 15d | 1 | 1.04mi |
| 38 W Market St Unit 3 Wilkes-Barre, PA | 2.0 | 1.0 | 1388 | $1,295 | $0.93 | 15d | 1 | 1.04mi |
| 44 Eagle Ct Wilkes Barre, PA | 1.0–3.0 | 1.0–1.5 | 910 | $1,722 | $1.89 | 15d | 5 | 1.06mi |
| 342 Horton St Wilkes Barre, PA | 3.0 | 1.5 | 1472 | $1,650 | $1.12 | 15d | 1 | 1.07mi |
| 27 Oak St Wilkes Barre, PA | 3.0 | 1.5 | 1500 | $1,700 | $1.13 | 45d | 1 | 1.08mi |
| 13 Woodbury St Hanover Township, PA | 2.0 | 1.0 | 1000 | $1,100 | $1.10 | 45d | 1 | 1.08mi |
| 780 Hazle St Unit Rear 2nd Fl Ashley, PA | 2.0 | 1.0 | 850 | $975 | $1.15 | 15d | 1 | 1.09mi |
| 19 N River St Unit 308 Wilkes-Barre, PA | 2.0 | 1.5 | 910 | $1,600 | $1.76 | 15d | 1 | 1.10mi |
| 19 N River St Unit 403 Wilkes-Barre, PA | 2.0 | 1.0 | 723 | $1,600 | $2.21 | 15d | 1 | 1.10mi |
| 100 E Newport St Hanover Township, PA | 2.0 | 1.5 | 1344 | $1,250 | $0.93 | 45d | 1 | 1.11mi |
Listing history 3 events
-
2026-06-22statusdays on market $65,000 Pending 4 DOM
-
2026-06-19remarks 157-char remark
-
2026-06-17$65,000 Active 1 DOM
ⓘ Source: listings_history table (triggers on properties + properties_extension) + one-shot
backfill from property_details.listing_events for pre-trigger history.
Climate risk First Street
- Flood 1/10 Low FEMA zone X (unshaded) · 0% chance over 30 yrs
- Wildfire 4/10 Moderate
- Heat 4/10 Moderate 7 d/yr ≥97°F today · 16 d/yr by 30 yrs out
- Wind 3/10 Moderate 5% chance of damaging wind over 30 yrs
- Air quality 2/10 Low 1 unhealthy d/yr today · 2 by 30 yrs out
Nearby sold comps map
Loading sold comps map…
Walkable amenities ~0.75 mi
Loading nearby amenities…
Taxation est. · year 1
- Rental income
- $15,559
- − Mortgage interest
- −$3,641
- − Property taxes
- −$975
- − Insurance
- −$325
- − Repairs & maintenance
- −$1,245
- − Management
- −$1,245
- − Depreciation
- −$1,891
- Taxable income
- $6,238
- Est. tax owed @ 24.0%
- −$1,497
- After-tax cash flow
- $5,404/yr
For passive investors: Depreciation is non-cash, so a rental often shows a tax loss while cash-flowing — sheltering income. Rental losses are passive: they offset passive income freely, and up to $25,000/yr can offset ordinary (W-2) income if you actively participate and your MAGI is under $100k (phasing out to $0 by $150k); unused losses carry forward. On sale, claimed depreciation is recaptured at up to 25%, and gains may owe capital-gains tax (a 1031 exchange can defer both). Figures are a year-1 estimate at your 24.0% rate — not tax advice; consult a CPA.
Schools (NCES district)
- District
- Wilkes-Barre Area SD
- NCES district ID
- 4226300
- Math proficiency
- 19% ▼ -2.00%
- Reading proficiency
- 32% ▼ -9.00%
- Median HH income
- $37,420
- Composite
- 21.22/100
- National rank
- #8409
- State rank
- #469 of 539 in PA
Livability — Wilkes-Barre
No livability data for this city. (Only ~50 U.S. cities are tracked.)
Census & demographics
- Census place
- Wilkes-Barre, PA
- County
- Luzerne County · 118,885 people
- City population
- 73,981
- Metro
- Scranton--Wilkes-Barre, PA
- Population (ZIP)
- 41,970
- Household income
- $56,378
- Rent vs Own
- Severe rent burden
- 1632.0
Population outlook (Luzerne County) Hauer SSP2
- Today (2025)
- 319,505 people
- By 2030
- 319,943 · +0.1%
- By 2040
- 322,643 · +1.0%
- By 2050
- 330,817 · +3.5%
- By 2075
- 379,145 · +18.7%
- By 2100
- 431,908 · +35.2%
Race, ethnicity, and origin ACS 2023
- Neighborhood character
- Diverse neighborhood (Simpson 0.59)
- Race & ethnicity
- White 58% Hispanic / Latino 25% Black 12% Two or more races 11% Asian 2%
- Hispanic origin (detail)
- Mexican 6% Puerto Rican 6% Dominican 9%
- Common ancestry
- Romanian 14% Scotch-Irish 2% Iranian 1%
- Foreign-born
- 13% · Canada, Jamaica
- Languages at home
- 79% English-only · Spanish 17% Other Asian/Pacific 1% Other Indo-European 1%
Political lean MEDSL · Luzerne
- 2024 margin
- R (+19.2) · D 40.0% · R 59.2%
- 2008→2024 swing
- -27.6pp toward R · 2008: 8.4pp · 2024: -19.2pp
- All cycles
- 2024: R+19.2 2020: R+14.4 2016: R+19.6 2012: D+4.8 2008: D+8.4
Not yet ingested
- Civics
- —
Market trends
- HPI YoY
- ▼ -156.99%
- Current HPI
- 216.9373
- Rent YoY
- ▲ 6.84%
- Metro
- Scranton--Wilkes-Barre, PA
- State GDP YoY
- ▲ 1.68%
- F500 in state
- 34
Industry mix (Fortune 500 HQ in PA)
| Industry | F500 HQs | Revenue |
|---|---|---|
| Healthcare | 2 | $309B |
|
||
| Insurance | 2 | $27B |
|
||
| Telecommunications / Media | 1 | $124B |
|
||
| Industrial Distribution | 1 | $22B |
|
||
| Financial Services | 1 | $20B |
|
||
| Chemicals / Materials | 1 | $18B |
|
||
Price history
+44.4% since first listed2 events — show timeline
- 2026-06-17 Listed $65,000 LCAR
- 2007-09-17 Sold (Public Records) $45,000 Public Records
Property tax history
+20.4%/yrLatest (2026): $7,679 · +0.1% YoY. Source: county tax records.
Cash-flow waterfall
monthlySold comps — $/sqft
last 12 mo · ≤1 miLoading sold comps…