 Fourplex
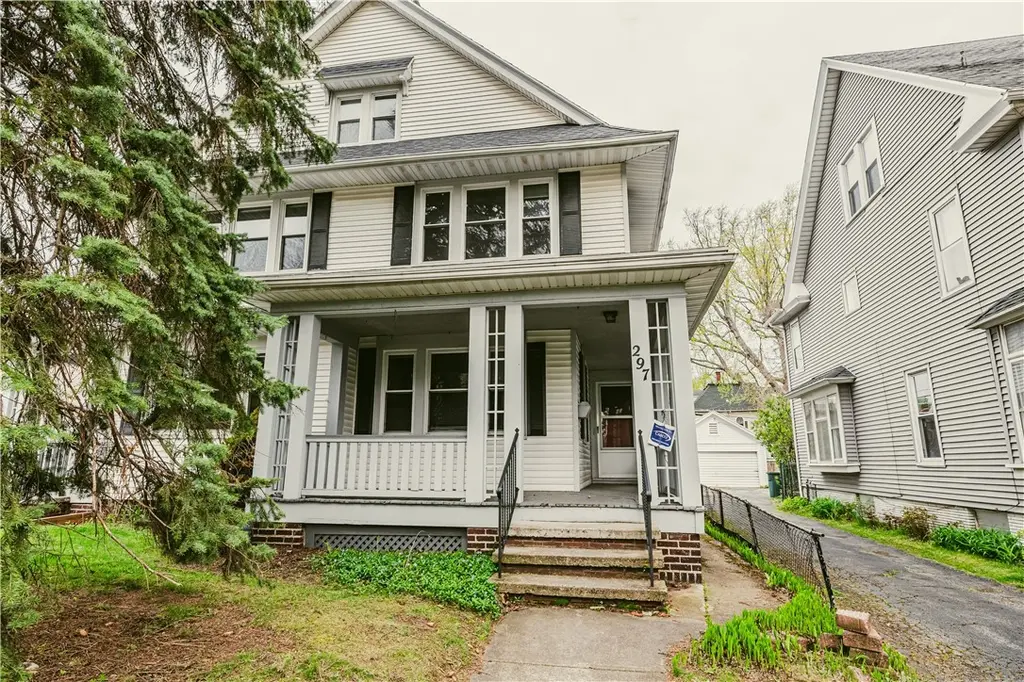
297-303 Dartmouth St · Rochester, NY
Flood risk 1/10 · Minimal
- FEMA flood zone
- X (unshaded)
- Chance of flooding over 30 yrs
- 0.0%
- Est. flood insurance / yr
- $473 – $860
Fire risk 1/10 · Minimal
- Est. fire insurance / yr
- $691 – $1,283
Heat risk 2/10 · Minimal
- Hot days now (above 95°F)
- 7 days/yr
- Hot days in 30 yrs
- 15 days/yr
Wind risk 1/10 · Minimal
- Chance of severe wind over 30 yrs
- —
Air-quality risk 2/10 · Minimal
- Unhealthy air days now
- 1 days/yr
- Unhealthy air days in 30 yrs
- 1 days/yr
Risk factors via First Street. Map © Google.
Why this score? — see what drove the C+ grade
The composite is a weighted blend of 9 inputs, each scored 0–100. Each bar is that input's sub-score; the figure is the points it added to the 100-point composite (weight × sub-score).
- Cash flow +30.0/30.0
- 1% rule +10.0/10.0
- DSCR +10.0/10.0
- Livability +3.8/5.0
- Rent growth +3.7/5.0
- Condition / age +2.5/5.0
- ARV discount +1.9/15.0
- Schools +1.9/10.0
- Appreciation +0.0/10.0
$499,900
🖨 Deal sheet 📄 Offer letter ✓ Due diligence
Multi-family units
County records classify this as Multi-Family (2-4 Unit). Listing-text estimate: 4 units. confirmed
Listing remarks MLS
Welcome to 297–303 Dartmouth Street, a spacious side-by-side duplex offering scale, flexibility, and strong potential across two well-designed units! Ideal for both owner-occupants and investors, each unit features four bedrooms, two full bathrooms, and a half bathroom, along with separate utilities and three full levels of living space. The layouts feel both practical and inviting, with living rooms anchored by artificial fireplaces, formal dining rooms, and well-sized kitchens designed for everyday living. Upstairs, both units offer three bedrooms and a full bathroom, with porch access off one of the bedrooms, adding a natural extension to the living space. The third floors continue to expand the footprint with a fourth bedroom and additional bathroom, creating flexibility for a variety of uses. The 297 side is complemented by a welcoming front porch, while the 303 side offers a side porch, giving each unit its own distinct presence. Outside, off-street parking and a two-car garage add everyday convenience. 297-303 Dartmouth Street is a compelling multi-unit opportunity with size, layout, and long-term potential!
Key facts
- Separate utilities
- Side-by-side duplex
- Flexible layouts
Tags
Neighborhood map
What this means for you Summary
Snapshot
- This is a 4 × 4-bed/3.5-bath units multifamily listed at $500k.
Deal economics
- At list price, monthly cash flow is $4k ($53k/yr) — positive. Per door: $1k/mo.
- The deal already cash-flows at list — no discount required.
- Meets the 1% rule at list price ($10k rent vs $500k).
- Recommended offer: $492k (1.5% below list) — sets the bar for market timing.
- Cap rate 17.0% vs local median 9.3% in Rochester — top-decile yield for the area; either an underpriced asset or a hidden risk that comps aren't pricing in. Stress-test before assuming the spread holds.
Location & tenants
- Location reads 76/100 on livability (#222 in NY, #3,482 nationally) — a middle-class / working-renter tenant base. Strengths: commute A+, cost of living A+, housing A+; Watch: schools D+, crime F, employment F.
- Rochester City School District (urban): math 21% / reading 26% proficiency, ranked #589 of 590 in NY (top 100%) — low school quality limits family demand, transient renter base, plan for 1-2y turnover; 82% free/reduced lunch — lower-income household profile, screen leases tightly.
- Market conditions: Rents rising fast (+4.6%/yr); 56 active listings in the ZIP; 1,169 units permitted in Monroe County in 2024 (591 in 5+ unit buildings).
- At $9,666/mo this rent would consume 194% of the median local household income ($60k/yr) (locally 2034% of renters already pay >50% of income on rent) — very limited rent-growth headroom before tenants either downsize or default.
Forward outlook
- Local home prices are declining (-3.0%/yr); year-one equity from $3k of loan paydown is wiped out by about $15k of value loss. Plan a longer hold.
- Monroe County population projected to shrink 6% by 2050 — rents likely to lag national; underwrite the cash flow, not the appreciation.
- At projected returns (-3.0% appreciation + 4.6% rent growth), your $140k cash investment doubles in ~3 years — after that, you're playing with house money.
Negotiation context
- It's been on market 22 days — a 2% lower offer ($492k) is reasonable based on typical stale-listing flexibility.
- 2 sale attempts; this cycle's ask has dropped $65k (12%) from the opening price — seller is motivated, your offer sets the floor, not the list.
Risks & watch-outs
- Watch-outs: built in 1910 — expect roof / HVAC / electrical / plumbing capex.
Questions for the listing agent
- Can we see the unit-by-unit rent roll, current vacancy, and any below-market leases? What's the average tenancy length?
- What capital expenditures (roof, boiler, parking lot, exteriors) have been made in the last 5 years, and what's planned in the next 2?
- Built in 1910 — when were the roof, HVAC, electrical panel, plumbing, and water heater last replaced?
- Is there a deadline driving the sale (1031 exchange, divorce, estate, relocation)? That informs how much negotiation room exists.
- Schools are D-rated, which usually means shorter tenancies and higher turnover. Who's the typical renter profile here, and what's been the actual vacancy rate?
- Crime grade is F in this area — have there been break-ins, vandalism, or insurance claims at this property in the last 3 years? What carrier currently insures it and at what premium?
- What's the average days-on-market for RENTAL listings here right now (not sales)? A rising rental-DOM trend means longer vacancies and softer asking-rent achievability than the comps imply.
- What's the recent tenant-quality profile in this submarket — average credit score on applications, eviction rate, late-payment / NSF rate, and stable-employment percentage? A property-management company in the area should have these aggregated.
- How much new apartment / multifamily construction is in the pipeline within 1–3 miles? Heavy new supply (>2% of stock underway) typically softens rents 12–24 months out; light construction supports rent growth.
Investment metrics
- 1% rule
- 1.93% ✓
- Cap rate
- 16.97%
- Cash-on-cash
- 38.15%
- DSCR
- 2.70
- GRM
- 4.3
CMA / ARV
- ARV (on-the-fly)
- $444,664
- Comps found
- 12
Show comp detail 12 sales within ~0.75 mi
| Address | Dist | Beds/Ba | Sqft | Sold | Price | $/sf | Match |
|---|---|---|---|---|---|---|---|
| 2 Thayer St | 0.38mi | 6/3.0 | 3,726 (+4%) | 3mo | $375,000 | $101 | 71 |
| 10 Werner Park | 0.54mi | 6/3.0 | 3,520 (-2%) | 1mo | $526,000 | $149 | 69 |
| 110 Park Ave | 0.62mi | 5/— (-1) | 3,644 (+2%) | 3mo | $644,330 | $177 | 61 |
| 195-197 Milburn St | 0.53mi | 6/2.0 | 3,666 (+2%) | 8mo | $432,800 | $118 | 59 |
| 187 Culver Rd | 0.63mi | 7/4.5 (+1) | 3,624 (+1%) | 10mo | $385,000 | $106 | 52 |
| 14-16 Suter Ter | 0.23mi | 6/3.0 | 3,051 (-15%) | 14mo | $272,900 | $89 | 51 |
| 78 Avondale Park | 0.41mi | 7/3.0 (+1) | 3,238 (-10%) | 9mo | $435,000 | $134 | 50 |
| 40-42 Rosedale St | 0.46mi | 7/3.0 (+1) | 3,335 (-7%) | 18mo | $350,000 | $105 | 45 |
| 597-599 S Clinton Ave | 0.75mi | 5/4.0 (-1) | 3,506 (-2%) | 14mo | $435,000 | $124 | 43 |
| 179 Rosedale St | 0.35mi | 5/4.0 (-1) | 4,054 (+13%) | 16mo | $399,900 | $99 | 42 |
| 20-22 Arnold Park | 0.58mi | 5/5.0 (-1) | 3,868 (+8%) | 12mo | $580,000 | $150 | 39 |
| 15 Vick Park A | 0.58mi | 5/4.5 (-1) | 4,028 (+12%) | 15mo | $580,000 | $144 | 31 |
Match score weights: distance 35% · size 25% · config 20% · recency 20%. Top-matched comps best support the ARV.
Projected returns pro-forma
-3.0% appreciation · 4.6% rent growth · sell at horizon
- IRR
- 36.0%
- Equity multiple
- 2.56×
- Total profit
- $218,187
- Equity at exit
- $74,537
- IRR
- 43.5%
- Equity multiple
- 5.44×
- Total profit
- $621,866
- Equity at exit
- $43,222
Cash invested: $139,972 (down + closing). Projections, not guarantees.
Landlord ↔ Tenant lean methodology
- Overall (STATE)
- 15 Strongly Tenant-Friendly
- State New York
- 15 Strongly Tenant-Friendly · D+10
- County
- — inherits STATE
- City
- — inherits STATE
ZIP-level market 14607
- Home prices YoY
- -10.7%
- Rents YoY
- 4.6%
- Active inventory
- 56
- Price-to-rent
- 17.2×
Monthly cashflow live
- Estimated rent
- $9,666 medium interval (Pro) →
- Mortgage (P&I)
- −$2,622
- Tax from tax record
- −$357 /mo · $4,280/yr
- Insurance
- −$208
- HOA
- −$0
- Vacancy / Maint / Mgmt
- −$2,030
- Net cashflow
- $4,450
Break-even live
4-unit breakdown (identical units grouped — click to expand)
| Units | Beds | Baths | Est. rent |
|---|---|---|---|
| 4× units | 4 | 3.5 | $9,668 |
| #1 | 4 | 3.5 | $2,417 |
| #2 | 4 | 3.5 | $2,417 |
| #3 | 4 | 3.5 | $2,417 |
| #4 | 4 | 3.5 | $2,417 |
| Total (4 units) | $9,666 | ||
UW: 25.0% down · 7.5% · 30yr · 1.5% tax · 5.0% vac · 8.0% maint · 8.0% mgmt
Financing live
Cash to close
- Down payment
- $124,975
- Closing costs
- $14,997
- Reserves months
- —
- Total cash needed
- —
Loan-product check · same deal, 3 products live
Conventional
25% down · 7.5% · 30yr
- Down + closing
- —
- Monthly P&I
- —
- Monthly cashflow
- —
- DSCR
- —
- Eligible?
- —
Personal DTI + credit; lowest rate.
DSCR
20% down · 8.5% · 30yr
- Down + closing
- —
- Monthly P&I
- —
- Monthly cashflow
- —
- DSCR
- —
- Eligible?
- —
No personal income docs; deal must DSCR.
Hard money
10% down · 12.0% · 12mo
- Down + closing
- —
- Monthly P&I
- —
- Monthly cashflow
- —
- DSCR
- —
- Eligible?
- —
Short-term bridge; refi at stabilization.
Listing history 22 events
-
2026-06-18days on market $499,900 Active 22 DOM
-
2026-06-17days on market $499,900 Active 21 DOM
-
2026-06-16days on market $499,900 Active 20 DOM
-
2026-06-15days on market $499,900 Active 19 DOM
-
2026-06-13days on market $499,900 Active 17 DOM
-
2026-06-13days on market $499,900 Active 16 DOM
-
2026-06-10days on market $499,900 Active 14 DOM
-
2026-06-09days on market $499,900 Active 13 DOM
-
2026-06-09days on market $499,900 Active 12 DOM
-
2026-06-07days on market $499,900 Active 11 DOM
-
2026-06-05days on market $499,900 Active 8 DOM
-
2026-06-03days on market $499,900 Active 7 DOM
-
2026-06-03days on market $499,900 Active 6 DOM
-
2026-06-01days on market $499,900 Active 5 DOM
-
2026-05-31days on market $499,900 Active 4 DOM
-
2026-05-06price $499,900 1142-char remark
Show marketing remark (1142 chars)
Welcome to 297–303 Dartmouth Street, a spacious side-by-side duplex offering scale, flexibility, and strong potential across two well-designed units! Ideal for both owner-occupants and investors, each unit features four bedrooms, two full bathrooms, and a half bathroom, along with separate utilities and three full levels of living space. The layouts feel both practical and inviting, with living rooms anchored by artificial fireplaces, formal dining rooms, and well-sized kitchens designed for everyday living. Upstairs, both units offer three bedrooms and a full bathroom, with porch access off one of the bedrooms, adding a natural extension to the living space. The third floors continue to expand the footprint with a fourth bedroom and additional bathroom, creating flexibility for a variety of uses. The 297 side is complemented by a welcoming front porch, while the 303 side offers a side porch, giving each unit its own distinct presence. Outside, off-street parking and a two-car garage add everyday convenience. 297-303 Dartmouth Street is a compelling multi-unit opportunity with size, layout, and long-term potential!
-
2026-04-29$564,900 Active 1142-char remark
Show marketing remark (1142 chars)
Welcome to 297–303 Dartmouth Street, a spacious side-by-side duplex offering scale, flexibility, and strong potential across two well-designed units! Ideal for both owner-occupants and investors, each unit features four bedrooms, two full bathrooms, and a half bathroom, along with separate utilities and three full levels of living space. The layouts feel both practical and inviting, with living rooms anchored by artificial fireplaces, formal dining rooms, and well-sized kitchens designed for everyday living. Upstairs, both units offer three bedrooms and a full bathroom, with porch access off one of the bedrooms, adding a natural extension to the living space. The third floors continue to expand the footprint with a fourth bedroom and additional bathroom, creating flexibility for a variety of uses. The 297 side is complemented by a welcoming front porch, while the 303 side offers a side porch, giving each unit its own distinct presence. Outside, off-street parking and a two-car garage add everyday convenience. 297-303 Dartmouth Street is a compelling multi-unit opportunity with size, layout, and long-term potential!
-
2026-03-27historical $2,500
-
2026-03-05$2,500
-
2023-07-17soldstatus $476,000
-
2017-11-13soldstatus $300,000
-
2001-10-04soldstatus $170,000
ⓘ Source: listings_history table (triggers on properties + properties_extension) + one-shot
backfill from property_details.listing_events for pre-trigger history.
Tax reassessment forecast NY · Partial reset (capped growth)
- Current annual tax
- $4,280 · $357/mo
- Projected year-2 tax
- $6,364 · $530/mo
- Expected delta
- +$2,084/yr (+$174/mo · 48.7%)
ⓘ Screening estimate from a state-policy table — verify with the county assessor before closing.
Climate risk First Street
- Flood 1/10 Low FEMA zone X (unshaded) · 0% chance over 30 yrs
- Wildfire 1/10 Low
- Heat 2/10 Low 7 d/yr ≥95°F today · 15 d/yr by 30 yrs out
- Wind 1/10 Low
- Air quality 2/10 Low 1 unhealthy d/yr today · 1 by 30 yrs out
Nearby sold comps map
Loading sold comps map…
Walkable amenities ~0.75 mi
Loading nearby amenities…
Taxation est. · year 1
- Rental income
- $115,992
- − Mortgage interest
- −$28,002
- − Property taxes
- −$4,280
- − Insurance
- −$2,500
- − Repairs & maintenance
- −$9,279
- − Management
- −$9,279
- − Depreciation
- −$14,543
- Taxable income
- $48,109
- Est. tax owed @ 24.0%
- −$11,546
- After-tax cash flow
- $41,850/yr
For passive investors: Depreciation is non-cash, so a rental often shows a tax loss while cash-flowing — sheltering income. Rental losses are passive: they offset passive income freely, and up to $25,000/yr can offset ordinary (W-2) income if you actively participate and your MAGI is under $100k (phasing out to $0 by $150k); unused losses carry forward. On sale, claimed depreciation is recaptured at up to 25%, and gains may owe capital-gains tax (a 1031 exchange can defer both). Figures are a year-1 estimate at your 24.0% rate — not tax advice; consult a CPA.
Schools (NCES district)
- District
- Rochester City School District
- NCES district ID
- 3624750
- Math proficiency
- 21% ▬ 0.00%
- Reading proficiency
- 26% ▲ 4.00%
- Median HH income
- $30,923
- Composite
- 18.98/100
- National rank
- #8850
- State rank
- #589 of 590 in NY
Livability — Rochester
- Score
- 76/100
- State rank
- #222
- US rank
- #3482
Category grades
Schools grade is shown separately in the Schools card above.
Census & demographics
- Census place
- Rochester, NY
- County
- Monroe County · 674,131 people
- City population
- 432,803
- Metro
- Rochester, NY
- Population (ZIP)
- 17,891
- Household income
- $59,787
- Rent vs Own
- Severe rent burden
- 2034.0
Population outlook (Monroe County) Hauer SSP2
- Today (2025)
- 759,460 people
- By 2030
- 757,154 · -0.3%
- By 2040
- 740,644 · -2.5%
- By 2050
- 714,443 · -5.9%
- By 2075
- 645,883 · -15.0%
- By 2100
- 547,084 · -28.0%
Race, ethnicity, and origin ACS 2023
- Neighborhood character
- Predominantly White (78%)
- Race & ethnicity
- White 78% Black 8% Two or more races 7% Hispanic / Latino 6% Asian 2%
- Hispanic origin (detail)
- Puerto Rican 2%
- Common ancestry
- Romanian 5% Slovak 4% Scotch-Irish 2%
- Foreign-born
- 7% · Canada, South Korea
- Languages at home
- 90% English-only · Spanish 5% Other Indo-European 1% Russian/Polish/Slavic 1%
Political lean MEDSL · Monroe
- 2024 margin
- D (+19.1) · D 59.5% · R 40.5%
- 2008→2024 swing
- +1.4pp toward D · 2008: 17.7pp · 2024: 19.1pp
- All cycles
- 2024: D+19.1 2020: D+21.0 2016: D+14.1 2012: D+17.4 2008: D+17.7
Not yet ingested
- Civics
- —
Market trends
- HPI YoY
- ▼ -35.72%
- Current HPI
- 297.8107
- Rent YoY
- ▲ 4.60%
- Metro
- Rochester, NY
- State GDP YoY
- ▲ 2.60%
- F500 in state
- 92
Industry mix (Fortune 500 HQ in NY)
| Industry | F500 HQs | Revenue |
|---|---|---|
| Financial Services | 10 | $950B |
|
||
| Consumer Goods | 9 | $162B |
|
||
| Insurance | 4 | $225B |
|
||
| Telecommunications | 2 | $144B |
|
||
| Pharmaceuticals | 2 | $112B |
|
||
| Media / Entertainment | 2 | $69B |
|
||
Price history
+194.1% since first listed7 events — show timeline
- 2026-05-06 Price Changed $499,900 UNYREIS
- 2026-04-29 Listed $564,900 UNYREIS
- 2026-03-27 Rental Removed $2,500 UNYREIS
- 2026-03-05 Listed for Rent $2,500 UNYREIS
- 2023-07-17 Sold (Public Records) $476,000 Public Records
- 2017-11-13 Sold (Public Records) $300,000 Public Records
- 2001-10-04 Sold (Public Records) $170,000 Public Records
Property tax history
+3.8%/yrLatest (2025): $4,280 · +0.0% YoY. Source: county tax records.
Cash-flow waterfall
monthlySold comps — $/sqft
last 12 mo · ≤1 miLoading sold comps…