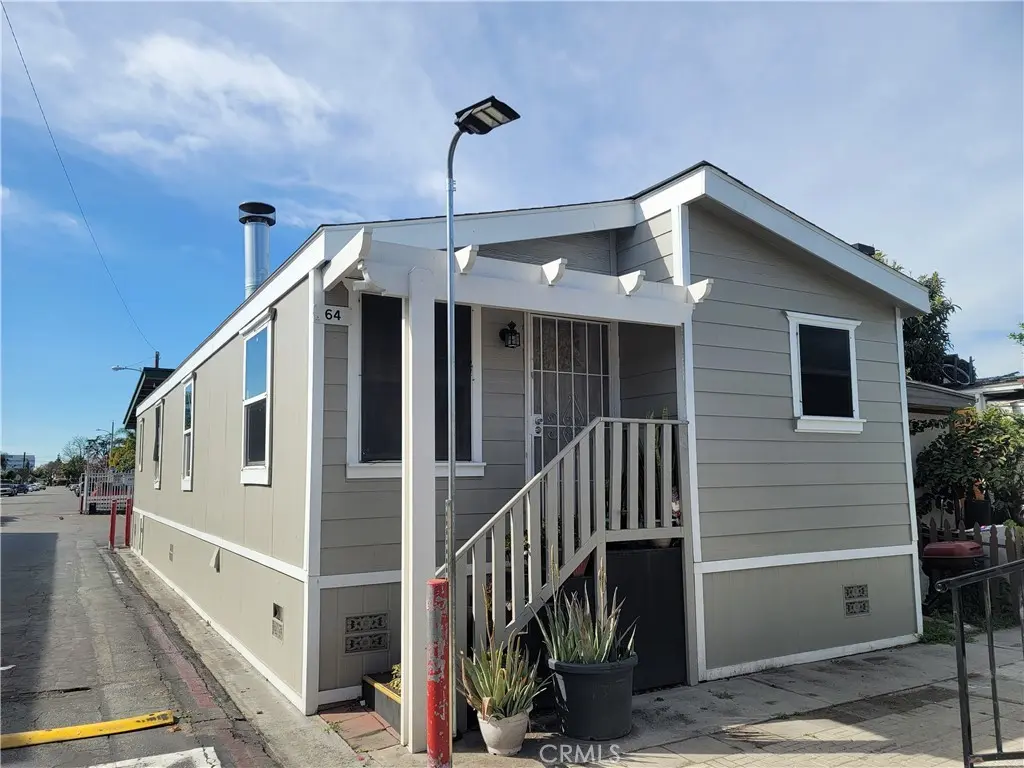
12265 Woodruff Ave #64 · Downey, CA
Flood risk 5/10 · Moderate
- FEMA flood zone
- X
- Chance of flooding over 30 yrs
- 0.24%
- Est. flood insurance / yr
- $507 – $1,088
Fire risk 1/10 · Minimal
- Est. fire insurance / yr
- $659 – $1,223
Heat risk 5/10 · Moderate
- Hot days now (above 93°F)
- 7 days/yr
- Hot days in 30 yrs
- 22 days/yr
Wind risk 1/10 · Minimal
- Chance of severe wind over 30 yrs
- —
Air-quality risk 5/10 · Moderate
- Unhealthy air days now
- 7 days/yr
- Unhealthy air days in 30 yrs
- 9 days/yr
Risk factors via First Street. Map © Google.
Why this score? — see what drove the B- grade
The composite is a weighted blend of 9 inputs, each scored 0–100. Each bar is that input's sub-score; the figure is the points it added to the 100-point composite (weight × sub-score).
- Cash flow +29.1/30.0
- DSCR +10.0/10.0
- ARV discount +7.5/15.0
- 1% rule +7.3/10.0
- Schools +4.4/10.0
- Livability +3.6/5.0
- Rent growth +3.2/5.0
- Condition / age +2.5/5.0
- Appreciation +0.0/10.0
$215,000
🖨 Deal sheet 📄 Offer letter ✓ Due diligence
Listing remarks MLS
Great potential, 3-bedroom, 2-bath manufactured home built in 2017, offering 1,120 sq ft of comfortable living space in a highly desirable all-ages family community. This home features a spacious living room that flows seamlessly into the dining area and kitchen, creating an open and inviting layout perfect for everyday living and entertaining. Enjoy year-round comfort with central air and heat. The community offers a refreshing swimming pool steps away from property to enjoy during the summer months. It is conveniently located near shopping centers, dining, schools, and with easy access to the 105, 91, and 605 freeways, making commuting a breeze.
Key facts
- Central air and heat
- Swimming pool
- Open layout
Tags
Neighborhood map
What this means for you Summary
Snapshot
- This is a 3-bed/2.0-bath manufactured listed at $215k.
Deal economics
- At list price, monthly cash flow is $741 ($9k/yr) — positive.
- The deal already cash-flows at list — no discount required.
- Meets the 1% rule at list price ($3k rent vs $215k).
- Recommended offer: $196k (9.0% below list) — sets the bar for market timing.
- Cap rate 10.4% vs local median 2.1% in Downey — top-decile yield for the area; either an underpriced asset or a hidden risk that comps aren't pricing in. Stress-test before assuming the spread holds.
Location & tenants
- Location reads 72/100 on livability (#187 in CA) — a middle-class / working-renter tenant base. Strengths: amenities A+, commute A+, employment A; Watch: health & safety C-, crime D, cost of living F.
- Downey Unified (suburban): math 41% / reading 53% proficiency, ranked #481 of 1,400 in CA (top 34%) — families likely to look elsewhere, expect single-tenant / working-renter base with shorter leases.
- Market conditions: Rents rising (+2.9%/yr); 40 active listings in the ZIP; 28 comparable units currently listed for rent nearby; rentals at typical pace (median 24d on market — plan ~3-4 weeks tenant-placement turnaround); 46% of comp listings sitting > 30 days — soft ceiling on asking rent; solid renter incomes; 19,697 units permitted in Los Angeles County in 2024 (9,426 in 5+ unit buildings).
- This rent runs 36% of the median local income ($88k/yr) — at the standard rent-burdened threshold; future hikes will face affordability resistance.
Forward outlook
- Local home prices are declining (-3.0%/yr); year-one equity from $1k of loan paydown is wiped out by about $6k of value loss. Plan a longer hold.
- Los Angeles County population projected at +9% by 2050 — modest demand growth; plan on rents tracking national, not racing it.
- At projected returns (-3.0% appreciation + 2.9% rent growth), your $60k cash investment doubles in ~9 years — after that, you're playing with house money.
Negotiation context
- It's been on market 114 days — a 9% lower offer ($196k) is reasonable based on typical stale-listing flexibility.
- 7 sale attempts since 7y ago with the ask held roughly flat each time — persistent listings suggest the price (not the market) is what's stuck; bring a comps-based counter.
Risks & watch-outs
- Climate carrying-cost: moderate flood risk; extreme-heat days projected 7→22/yr by 2055 (HVAC capex compounding) — expect insurance premiums to compound above CPI over the hold.
Questions for the listing agent
- It's been on market 114 days. Have you received any prior offers? Is the seller open to a 9% concession, seller financing, or rate buy-down credit?
- Why hasn't it sold? Are there any deal-killer items the seller is aware of (foundation, flood, title, zoning, code violations)?
- Is there a deadline driving the sale (1031 exchange, divorce, estate, relocation)? That informs how much negotiation room exists.
- Crime grade is D in this area — have there been break-ins, vandalism, or insurance claims at this property in the last 3 years? What carrier currently insures it and at what premium?
- What's the average days-on-market for RENTAL listings here right now (not sales)? A rising rental-DOM trend means longer vacancies and softer asking-rent achievability than the comps imply.
- What's the recent tenant-quality profile in this submarket — average credit score on applications, eviction rate, late-payment / NSF rate, and stable-employment percentage? A property-management company in the area should have these aggregated.
- How much new for-sale + rental construction is in the pipeline within 1–3 miles? Heavy new supply typically softens prices + rents 12–24 months out; constrained supply supports both.
Investment metrics
- 1% rule
- 1.23% ✓
- Cap rate
- 10.43%
- Cash-on-cash
- 14.76%
- DSCR
- 1.66
- GRM
- 6.8
CMA / ARV
- ARV (median comp)
- $137,069
- List price
- $215,000
- Delta
- 56.86%
- Verdict
- OVERPRICED
- Comps
- 3 within 1.0 mi
Projected returns pro-forma
-3.0% appreciation · 2.93% rent growth · sell at horizon
- IRR
- 5.2%
- Equity multiple
- 1.20×
- Total profit
- $12,097
- Equity at exit
- $32,057
- IRR
- 14.5%
- Equity multiple
- 2.17×
- Total profit
- $70,315
- Equity at exit
- $18,589
Cash invested: $60,200 (down + closing). Projections, not guarantees.
Landlord ↔ Tenant lean methodology
- Overall (STATE)
- 18 Strongly Tenant-Friendly
- State California
- 18 Strongly Tenant-Friendly · D+13
- County
- — inherits STATE
- City
- — inherits STATE
ZIP-level market 90241
- Rents YoY
- 2.9%
- Active inventory
- 40
- Price-to-rent
- 6.8×
Monthly cashflow live
- Estimated rent
- $2,636 high interval (Pro) →
- Mortgage (P&I)
- −$1,127
- Tax from tax record
- −$125 /mo · $1,495/yr
- Insurance
- −$90
- HOA
- −$0
- Vacancy / Maint / Mgmt
- −$554
- Net cashflow
- $741
Break-even live
UW: 25.0% down · 7.5% · 30yr · 1.5% tax · 5.0% vac · 8.0% maint · 8.0% mgmt
Financing live
Cash to close
- Down payment
- $53,750
- Closing costs
- $6,450
- Reserves months
- —
- Total cash needed
- —
Loan-product check · same deal, 3 products live
Conventional
25% down · 7.5% · 30yr
- Down + closing
- —
- Monthly P&I
- —
- Monthly cashflow
- —
- DSCR
- —
- Eligible?
- —
Personal DTI + credit; lowest rate.
DSCR
20% down · 8.5% · 30yr
- Down + closing
- —
- Monthly P&I
- —
- Monthly cashflow
- —
- DSCR
- —
- Eligible?
- —
No personal income docs; deal must DSCR.
Hard money
10% down · 12.0% · 12mo
- Down + closing
- —
- Monthly P&I
- —
- Monthly cashflow
- —
- DSCR
- —
- Eligible?
- —
Short-term bridge; refi at stabilization.
Rent comps 28 comps
| Address | Beds | Baths | Sqft | Rent | $/sqft | DOM | Units | Dist |
|---|---|---|---|---|---|---|---|---|
| 12405 Benedict Ave Downey, CA | 1.0–2.0 | 1.0 | 750 | $2,150 | $2.87 | 43d | 1 | 0.18mi |
| 9815 Imperial Hwy Downey, CA | 2.0 | 1.0 | 850 | $2,195 | $2.58 | 43d | 1 | 0.26mi |
| 9999 Imperial Hwy Downey, CA | 1.0–2.0 | 1.0–2.0 | 780 | $2,888 | $3.70 | 2d | 3 | 0.32mi |
| 9351 Washburn Rd Unit 09 Downey, CA | 2.0 | 1.0 | 925 | $2,400 | $2.59 | 43d | 1 | 0.34mi |
| 9307 Washburn Rd Downey, CA | 2.0 | 1.0 | 700 | $2,000 | $2.86 | 43d | 2 | 0.40mi |
| 9353 Elm Vista Dr Unit 207 Downey, CA | 2.0 | 2.0 | 950 | $2,375 | $2.50 | 19d | 1 | 0.43mi |
| 10000 Imperial Hwy Downey, CA | 1.0–2.0 | 1.0–2.0 | 850 | $2,975 | $3.50 | 1d | 20 | 0.47mi |
| 11914 Bellflower Blvd Downey, CA | 2.0 | 1.0 | 832 | $2,395 | $2.88 | 43d | 1 | 0.60mi |
| 9559 Firestone Blvd Unit C Downey, CA | 3.0 | 3.0 | 1410 | $3,700 | $2.62 | 43d | 1 | 0.71mi |
| 12625 Domart Ave Norwalk, CA | 2.0 | 10.0 | 810 | $2,590 | $3.20 | 2d | 1 | 0.71mi |
| 11118 Newville Ave Apt E Downey, CA | 2.0 | 1.5 | 805 | $2,499 | $3.10 | 7d | 1 | 0.73mi |
| 10129 Foster Rd Unit 15C Downey, CA | 2.0 | 1.0 | 810 | $2,420 | $2.99 | 43d | 1 | 0.77mi |
| 11921 Lakewood Blvd Downey, CA | 1.0–2.0 | 1.0 | 650 | $2,395 | $3.68 | 11d | 3 | 0.84mi |
| 11717 Lakewood Blvd Downey, CA | 2.0 | 1.5 | 1402 | $2,550 | $1.82 | 20d | 1 | 0.85mi |
| 13612 Carfax Ave Bellflower, CA | 3.0 | 2.0 | 1320 | $4,200 | $3.18 | 12d | 1 | 0.94mi |
| 13421 Curtis and King Rd Norwalk, CA | 2.0 | 1.0 | 810 | $2,895 | $3.57 | 43d | 1 | 0.98mi |
| 12301 Studebaker Rd Norwalk, CA | 1.0–2.0 | 1.0–2.0 | 823 | $3,105 | $3.77 | 3d | 6 | 1.00mi |
| 8612 Stewart and Gray Rd Downey, CA | 2.0 | 1.0 | 900 | $3,000 | $3.33 | 43d | 1 | 1.04mi |
| 8459 Luxor St Downey, CA | 3.0 | 2.0 | 1400 | $3,495 | $2.50 | 43d | 1 | 1.23mi |
| 11410 Brookshire Ave Downey, CA | 1.0–2.0 | 1.0–2.0 | 685 | $2,300 | $3.36 | 43d | 1 | 1.27mi |
| 11410 Brookshire Ave Downey, CA | 1.0–2.0 | 1.0–2.0 | 685 | $2,150 | $3.14 | 18d | 2 | 1.27mi |
| 8418 Stewart and Gray Rd Downey, CA | 2.0 | 2.0 | 850 | $2,900 | $3.41 | 5d | 1 | 1.27mi |
| 8721 Imperial Hwy Downey, CA | 1.0–2.0 | 1.0 | 907 | $2,358 | $2.60 | 6d | 1 | 1.30mi |
| 12709 Lakewood Blvd Unit 107 Downey, CA | 2.0 | 1.5 | 1110 | $2,575 | $2.32 | 43d | 1 | 1.31mi |
| 8709 Lyndora St Unit D Downey, CA | 2.0 | 1.0 | 750 | $2,100 | $2.80 | 24d | 1 | 1.34mi |
| 9610 Rosecrans Ave Bellflower, CA | 2.0 | 1.0 | 1050 | $3,195 | $3.04 | 43d | 1 | 1.40mi |
| 12554 Brookshire Ave Apt 1 Downey, CA | 3.0 | 2.0 | 1400 | $3,600 | $2.57 | 10d | 1 | 1.43mi |
| 11649 Downey Ave Downey, CA | 2.0 | 1.0 | 587 | $2,395 | $4.08 | 3d | 4 | 1.46mi |
Listing history 32 events
-
2026-06-18days on market $215,000 Active 114 DOM
-
2026-06-17days on market $215,000 Active 113 DOM
-
2026-06-16days on market $215,000 Active 112 DOM
-
2026-06-15days on market $215,000 Active 111 DOM
-
2026-06-13days on market $215,000 Active 109 DOM
-
2026-06-13days on market $215,000 Active 108 DOM
-
2026-06-09days on market $215,000 Active 105 DOM
-
2026-06-08days on market $215,000 Active 104 DOM
-
2026-06-07days on market $215,000 Active 103 DOM
-
2026-06-04days on market $215,000 Active 100 DOM
-
2026-06-03days on market $215,000 Active 99 DOM
-
2026-06-02days on market $215,000 Active 98 DOM
-
2026-06-01days on market $215,000 Active 97 DOM
-
2026-05-31days on market $215,000 Active 96 DOM
-
2026-02-24$215,000 Active 655-char remark
Show marketing remark (655 chars)
Great potential, 3-bedroom, 2-bath manufactured home built in 2017, offering 1,120 sq ft of comfortable living space in a highly desirable all-ages family community. This home features a spacious living room that flows seamlessly into the dining area and kitchen, creating an open and inviting layout perfect for everyday living and entertaining. Enjoy year-round comfort with central air and heat. The community offers a refreshing swimming pool steps away from property to enjoy during the summer months. It is conveniently located near shopping centers, dining, schools, and with easy access to the 105, 91, and 605 freeways, making commuting a breeze.
-
2025-11-14historical
-
2025-08-20price $217,000
-
2025-06-19price $229,999
-
2025-06-09$250,000 Active
-
2025-05-21historical
-
2025-02-17$200,000 Active
-
2025-02-13historical
-
2024-06-06$240,000 Active
-
2019-12-11status Active
-
2019-12-11historical Hold Do Not Show
-
2019-10-31historical Hold Do Not Show
-
2019-10-26status Active
-
2019-10-25historical Hold Do Not Show
-
2019-08-26price $135,000
-
2019-07-23price $155,000
-
2019-06-19price $165,000
-
2019-05-18$175,000 Active
ⓘ Source: listings_history table (triggers on properties + properties_extension) + one-shot
backfill from property_details.listing_events for pre-trigger history.
Tax reassessment forecast CA · Resets to sale price
- Current annual tax
- $1,495 · $125/mo
- Projected year-2 tax
- $1,634 · $136/mo
- Expected delta
- +$139/yr (+$12/mo · 9.3%)
ⓘ Screening estimate from a state-policy table — verify with the county assessor before closing.
Climate risk First Street
- Flood 5/10 Major FEMA zone X · 24% chance over 30 yrs
- Wildfire 1/10 Low
- Heat 5/10 Major 7 d/yr ≥93°F today · 22 d/yr by 30 yrs out
- Wind 1/10 Low
- Air quality 5/10 Major 7 unhealthy d/yr today · 9 by 30 yrs out
Nearby sold comps map
Loading sold comps map…
Walkable amenities ~0.75 mi
Loading nearby amenities…
Taxation est. · year 1
- Rental income
- $31,629
- − Mortgage interest
- −$12,043
- − Property taxes
- −$1,495
- − Insurance
- −$1,075
- − Repairs & maintenance
- −$2,530
- − Management
- −$2,530
- − Depreciation
- −$6,255
- Taxable income
- $5,701
- Est. tax owed @ 24.0%
- −$1,368
- After-tax cash flow
- $7,519/yr
For passive investors: Depreciation is non-cash, so a rental often shows a tax loss while cash-flowing — sheltering income. Rental losses are passive: they offset passive income freely, and up to $25,000/yr can offset ordinary (W-2) income if you actively participate and your MAGI is under $100k (phasing out to $0 by $150k); unused losses carry forward. On sale, claimed depreciation is recaptured at up to 25%, and gains may owe capital-gains tax (a 1031 exchange can defer both). Figures are a year-1 estimate at your 24.0% rate — not tax advice; consult a CPA.
Schools (NCES district)
- District
- Downey Unified
- NCES district ID
- 0611460
- Math proficiency
- 41% ▲ 3.00%
- Reading proficiency
- 53% ▲ 1.00%
- Median HH income
- $61,344
- Composite
- 43.5/100
- National rank
- #6458
- State rank
- #481 of 1400 in CA
Livability — Downey
- Score
- 72/100
- State rank
- #187
- US rank
- #6096
Category grades
Schools grade is shown separately in the Schools card above.
Census & demographics
- Census place
- Downey, CA
- County
- Los Angeles County · 9,444,647 people
- City population
- 110,939
- Metro
- Los Angeles-Long Beach-Anaheim, CA
- Population (ZIP)
- 45,319
- Household income
- $88,006
- Rent vs Own
- Severe rent burden
- 1884.0
Population outlook (Los Angeles County) Hauer SSP2
- Today (2025)
- 10,940,515 people
- By 2030
- 11,256,481 · +2.9%
- By 2040
- 11,729,929 · +7.2%
- By 2050
- 11,948,407 · +9.2%
- By 2075
- 11,818,114 · +8.0%
- By 2100
- 10,842,928 · -0.9%
Race, ethnicity, and origin ACS 2023
- Neighborhood character
- Predominantly Hispanic (75%)
- Race & ethnicity
- Hispanic / Latino 75% Two or more races 22% White 13% Asian 7% Black 3% Native American 2%
- Hispanic origin (detail)
- Mexican 60% Cuban 2%
- Common ancestry
- Lithuanian 1%
- Foreign-born
- 31% · Canada, South Korea, Dominican Republic
- Languages at home
- 32% English-only · Spanish 58% Korean 2% Arabic 2%
Political lean MEDSL · Los Angeles
- 2024 margin
- Solid D (+32.9) · D 64.8% · R 31.9% · Other 3.3%
- 2008→2024 swing
- -7.4pp toward R · 2008: 40.4pp · 2024: 32.9pp
- All cycles
- 2024: D+32.9 2020: D+44.2 2016: D+48.0 2012: D+40.0 2008: D+40.4
Not yet ingested
- Civics
- —
Market trends
- HPI YoY
- ▼ -913.21%
- Current HPI
- 387.2382
- Rent YoY
- ▲ 2.93%
- Metro
- Los Angeles-Long Beach-Anaheim, CA
- State GDP YoY
- ▲ 3.21%
- F500 in state
- 116
Industry mix (Fortune 500 HQ in CA)
| Industry | F500 HQs | Revenue |
|---|---|---|
| Technology | 27 | $1,492B |
|
||
| Financial Services | 3 | $174B |
|
||
| Retail | 3 | $44B |
|
||
| Insurance | 3 | $26B |
|
||
| Media / Entertainment | 2 | $115B |
|
||
| Pharmaceuticals / Biotech | 2 | $62B |
|
||
Price history
+22.9% since first listed18 events — show timeline
- 2026-02-24 Listed $215,000 CRMLS
- 2025-11-14 Listing Removed — CRMLS
- 2025-08-20 Price Changed $217,000 CRMLS
- 2025-06-19 Price Changed $229,999 CRMLS
- 2025-06-09 Listed $250,000 CRMLS
- 2025-05-21 Coming Soon — CRMLS
- 2025-02-17 Listed $200,000 CRMLS
- 2025-02-13 Listing Removed — CRMLS
- 2024-06-06 Listed $240,000 CRMLS
- 2019-12-11 Relisted — CRMLS
- 2019-12-11 Delisted — CRMLS
- 2019-10-31 Delisted — CRMLS
- 2019-10-26 Relisted — CRMLS
- 2019-10-25 Delisted — CRMLS
- 2019-08-26 Price Changed $135,000 CRMLS
- 2019-07-23 Price Changed $155,000 CRMLS
- 2019-06-19 Price Changed $165,000 CRMLS
- 2019-05-18 Listed $175,000 CRMLS
Property tax history
+0.6%/yrLatest (2025): $1,495 · +0.6% YoY. Source: county tax records.
Cash-flow waterfall
monthlySold comps — $/sqft
last 12 mo · ≤1 miLoading sold comps…