17420 Pioneer Road Rd · Crescent Mills, CA
Flood risk 1/10 · Minimal
- FEMA flood zone
- X (unshaded)
- Chance of flooding over 30 yrs
- 0.0%
- Est. flood insurance / yr
- $473 – $860
Fire risk 7/10 · Major
- Est. fire insurance / yr
- $659 – $1,223
Heat risk 5/10 · Moderate
- Hot days now (above 94°F)
- 9 days/yr
- Hot days in 30 yrs
- 22 days/yr
Wind risk 1/10 · Minimal
- Chance of severe wind over 30 yrs
- —
Air-quality risk 10/10 · Severe
- Unhealthy air days now
- 32 days/yr
- Unhealthy air days in 30 yrs
- 33 days/yr
Risk factors via First Street. Map © Google.
Why this score? — see what drove the D grade
The composite is a weighted blend of 9 inputs, each scored 0–100. Each bar is that input's sub-score; the figure is the points it added to the 100-point composite (weight × sub-score).
- ARV discount +15.0/15.0
- Cash flow +11.1/30.0
- DSCR +3.2/10.0
- Schools +2.8/10.0
- Rent growth +2.5/5.0
- Condition / age +2.5/5.0
- 1% rule +2.3/10.0
- Livability +1.7/5.0
- Appreciation +0.0/10.0
$315,000
🖨 Deal sheet 📄 Offer letter ✓ Due diligence
Listing remarks MLS
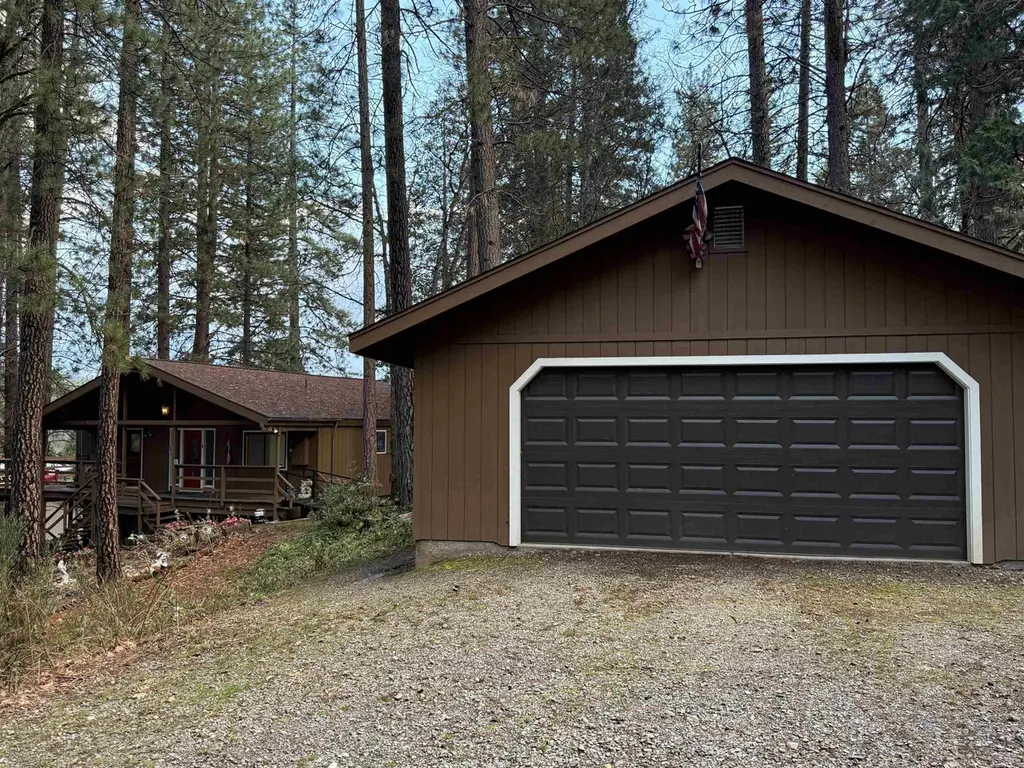
Charming 3-bedroom, 2-bath home in the desirable Mt. Hough Estates! This property features a 2-car garage with plenty of room for all your toys and sits on a spacious 0.64-acre lot. Enjoy ample yard space and start your mornings sipping coffee on the porch while taking in stunning views of Mt. Hough and beautiful Indian Valley. Inside, you’ll find an open-concept layout with stainless steel appliances in the kitchen, perfect for entertaining or everyday living. Conveniently located just a short drive to Lake Almanor, this home would make an excellent full-time residence or a peaceful mountain getaway.
Key facts
- Stunning views
- Spacious lot
- 2 car garage
Tags
Neighborhood map
What this means for you Summary
Snapshot
- This is a 3-bed/2.0-bath single-family listed at $315k.
Deal economics
- At list price, monthly cash flow is $-129 ($-2k/yr) — negative.
- To cash-flow at today's rent, offer at most $292k (7.2% below list).
- To meet the 1% rule (rent ≥ 1% of price), the offer needs to be $230k (26.9% below list).
- Recommended offer: $230k (26.9% below list) — sets the bar for 1% rule.
Location & tenants
- Location reads 33/100 on livability (#1,450 in CA) — a limited-amenity area; tenant pool skews transient or value-seeking. Strengths: crime A; Watch: schools F, amenities F, commute F.
- Plumas Unified (rural): math 21% / reading 44% proficiency, ranked #306 of 517 in CA (top 59%) — families likely to look elsewhere, expect single-tenant / working-renter base with shorter leases.
- Market conditions: 74 active listings in the ZIP; 39 units permitted in Plumas County in 2024 (0 in 5+ unit buildings).
Forward outlook
- Local home prices are declining (-3.0%/yr); year-one equity from $2k of loan paydown is wiped out by about $9k of value loss. Plan a longer hold.
- Plumas County population projected at -42% by 2050 — secular population decline; favor cash flow + early exit over multi-decade hold.
Negotiation context
- It's been on market 160 days — a 12% lower offer ($277k) is reasonable based on typical stale-listing flexibility.
- 2 sale attempts since 6y ago with the ask held roughly flat each time — persistent listings suggest the price (not the market) is what's stuck; bring a comps-based counter.
- Current owner paid $110k; list at $315k implies a 186% gain — meaningful room to come down on a strong offer.
Risks & watch-outs
- Climate carrying-cost: major wildfire risk; extreme-heat days projected 9→22/yr by 2055 (HVAC capex compounding) — expect insurance premiums to compound above CPI over the hold.
Questions for the listing agent
- What do current leases actually rent for vs. the listed asking? Can we see a recent rent roll and the last 12 months of T-12 income?
- It's been on market 160 days. Have you received any prior offers? Is the seller open to a 27% concession, seller financing, or rate buy-down credit?
- Built in 1978 — when were the roof, HVAC, electrical panel, plumbing, and water heater last replaced?
- Why hasn't it sold? Are there any deal-killer items the seller is aware of (foundation, flood, title, zoning, code violations)?
- Is there a deadline driving the sale (1031 exchange, divorce, estate, relocation)? That informs how much negotiation room exists.
- Schools are F-rated, which usually means shorter tenancies and higher turnover. Who's the typical renter profile here, and what's been the actual vacancy rate?
- The area grade is low — what's the realistic commute time and amenity access for the typical tenant pool here? Any planned neighborhood developments (good or bad) we should know about?
- What's the average days-on-market for RENTAL listings here right now (not sales)? A rising rental-DOM trend means longer vacancies and softer asking-rent achievability than the comps imply.
- What's the recent tenant-quality profile in this submarket — average credit score on applications, eviction rate, late-payment / NSF rate, and stable-employment percentage? A property-management company in the area should have these aggregated.
- How much new for-sale + rental construction is in the pipeline within 1–3 miles? Heavy new supply typically softens prices + rents 12–24 months out; constrained supply supports both.
Investment metrics
- 1% rule
- 0.73% ✗
- Cap rate
- 5.80%
- Cash-on-cash
- -1.76%
- DSCR
- 0.92
- GRM
- 11.4
CMA / ARV
- ARV (median comp)
- $492,128
- List price
- $315,000
- Delta
- -35.99%
- Verdict
- UNDERPRICED
- Comps
- 6 within 1.0 mi
Projected returns pro-forma
-3.0% appreciation · 3.0% rent growth · sell at horizon
- IRR
- -19.2%
- Equity multiple
- 0.33×
- Total profit
- $-59,365
- Equity at exit
- $46,968
- IRR
- -12.0%
- Equity multiple
- 0.29×
- Total profit
- $-62,702
- Equity at exit
- $27,235
Cash invested: $88,200 (down + closing). Projections, not guarantees.
Landlord ↔ Tenant lean methodology
- Overall (STATE)
- 18 Strongly Tenant-Friendly
- State California
- 18 Strongly Tenant-Friendly · D+13
- County
- — inherits STATE
- City
- — inherits STATE
ZIP-level market 95971
- Active inventory
- 74
- Price-to-rent
- 11.4×
Monthly cashflow live
- Estimated rent
- $2,304 medium interval (Pro) →
- Mortgage (P&I)
- −$1,652
- Tax from tax record
- −$166 /mo · $1,990/yr
- Insurance
- −$131
- HOA
- −$0
- Vacancy / Maint / Mgmt
- −$484
- Net cashflow
- $-129
Break-even live
UW: 25.0% down · 7.5% · 30yr · 1.5% tax · 5.0% vac · 8.0% maint · 8.0% mgmt
Financing live
Cash to close
- Down payment
- $78,750
- Closing costs
- $9,450
- Reserves months
- —
- Total cash needed
- —
Loan-product check · same deal, 3 products live
Conventional
25% down · 7.5% · 30yr
- Down + closing
- —
- Monthly P&I
- —
- Monthly cashflow
- —
- DSCR
- —
- Eligible?
- —
Personal DTI + credit; lowest rate.
DSCR
20% down · 8.5% · 30yr
- Down + closing
- —
- Monthly P&I
- —
- Monthly cashflow
- —
- DSCR
- —
- Eligible?
- —
No personal income docs; deal must DSCR.
Hard money
10% down · 12.0% · 12mo
- Down + closing
- —
- Monthly P&I
- —
- Monthly cashflow
- —
- DSCR
- —
- Eligible?
- —
Short-term bridge; refi at stabilization.
Listing history 21 events
-
2026-06-19days on market $315,000 Active 160 DOM
-
2026-06-18days on market $315,000 Active 159 DOM
-
2026-06-17days on market $315,000 Active 158 DOM
-
2026-06-16days on market $315,000 Active 157 DOM
-
2026-06-15days on market $315,000 Active 156 DOM
-
2026-06-14days on market $315,000 Active 154 DOM
-
2026-06-13days on market $315,000 Active 153 DOM
-
2026-06-10days on market $315,000 Active 151 DOM
-
2026-06-09days on market $315,000 Active 150 DOM
-
2026-06-08days on market $315,000 Active 149 DOM
-
2026-06-07days on market $315,000 Active 148 DOM
-
2026-06-05days on market $315,000 Active 145 DOM
-
2026-06-03days on market $315,000 Active 144 DOM
-
2026-06-02days on market $315,000 Active 143 DOM
-
2026-06-01days on market $315,000 Active 142 DOM
-
2026-05-31days on market $315,000 Active 141 DOM
-
2026-05-30days on market $315,000 Active 140 DOM
-
2026-03-31price $315,000 614-char remark
Show marketing remark (614 chars)
Charming 3-bedroom, 2-bath home in the desirable Mt. Hough Estates! This property features a 2-car garage with plenty of room for all your toys and sits on a spacious 0.64-acre lot. Enjoy ample yard space and start your mornings sipping coffee on the porch while taking in stunning views of Mt. Hough and beautiful Indian Valley. Inside, you’ll find an open-concept layout with stainless steel appliances in the kitchen, perfect for entertaining or everyday living. Conveniently located just a short drive to Lake Almanor, this home would make an excellent full-time residence or a peaceful mountain getaway.
-
2026-01-04$325,000 Active 614-char remark
Show marketing remark (614 chars)
Charming 3-bedroom, 2-bath home in the desirable Mt. Hough Estates! This property features a 2-car garage with plenty of room for all your toys and sits on a spacious 0.64-acre lot. Enjoy ample yard space and start your mornings sipping coffee on the porch while taking in stunning views of Mt. Hough and beautiful Indian Valley. Inside, you’ll find an open-concept layout with stainless steel appliances in the kitchen, perfect for entertaining or everyday living. Conveniently located just a short drive to Lake Almanor, this home would make an excellent full-time residence or a peaceful mountain getaway.
-
2020-08-05$375,000
-
1997-09-17soldstatus $110,000
ⓘ Source: listings_history table (triggers on properties + properties_extension) + one-shot
backfill from property_details.listing_events for pre-trigger history.
Tax reassessment forecast CA · Resets to sale price
- Current annual tax
- $1,990 · $166/mo
- Projected year-2 tax
- $2,394 · $200/mo
- Expected delta
- +$404/yr (+$34/mo · 20.3%)
ⓘ Screening estimate from a state-policy table — verify with the county assessor before closing.
Climate risk First Street
- Flood 1/10 Low FEMA zone X (unshaded) · 0% chance over 30 yrs
- Wildfire 7/10 Severe
- Heat 5/10 Major 9 d/yr ≥94°F today · 22 d/yr by 30 yrs out
- Wind 1/10 Low
- Air quality 10/10 Extreme 32 unhealthy d/yr today · 33 by 30 yrs out
Nearby sold comps map
Loading sold comps map…
Walkable amenities ~0.75 mi
Loading nearby amenities…
Taxation est. · year 1
- Rental income
- $27,646
- − Mortgage interest
- −$17,645
- − Property taxes
- −$1,990
- − Insurance
- −$1,575
- − Repairs & maintenance
- −$2,212
- − Management
- −$2,212
- − Depreciation
- −$9,164
- Taxable loss
- −$7,152
- Est. tax savings @ 24.0%
- +$1,716
- After-tax cash flow
- $168/yr
For passive investors: Depreciation is non-cash, so a rental often shows a tax loss while cash-flowing — sheltering income. Rental losses are passive: they offset passive income freely, and up to $25,000/yr can offset ordinary (W-2) income if you actively participate and your MAGI is under $100k (phasing out to $0 by $150k); unused losses carry forward. On sale, claimed depreciation is recaptured at up to 25%, and gains may owe capital-gains tax (a 1031 exchange can defer both). Figures are a year-1 estimate at your 24.0% rate — not tax advice; consult a CPA.
Schools (NCES district)
- District
- Plumas Unified
- NCES district ID
- 0631170
- Math proficiency
- 21% ▼ -11.00%
- Reading proficiency
- 44% ▬ 0.00%
- Median HH income
- $46,935
- Composite
- 27.89/100
- National rank
- #6870
- State rank
- #306 of 517 in CA
Livability — Crescent Mills
- Score
- 33/100
- State rank
- #1450
- US rank
- #27794
Category grades
Schools grade is shown separately in the Schools card above.
Census & demographics
- Population (ZIP)
- 6,288
Population outlook (Plumas County) Hauer SSP2
- Today (2025)
- 15,564 people
- By 2030
- 14,014 · -10.0%
- By 2040
- 11,197 · -28.1%
- By 2050
- 9,069 · -41.7%
- By 2075
- 5,573 · -64.2%
- By 2100
- 3,392 · -78.2%
Race, ethnicity, and origin ACS 2023
- Neighborhood character
- Predominantly White (77%)
- Race & ethnicity
- White 77% Two or more races 12% Hispanic / Latino 8% Black 2% Native American 2%
- Hispanic origin (detail)
- Mexican 3%
- Common ancestry
- Russian 4% Italian 3% Scottish 2%
- Foreign-born
- 3% · Canada, China
- Languages at home
- 96% English-only · Spanish 3% French/Haitian/Cajun 1%
Political lean MEDSL · Plumas
- 2024 margin
- R (+16.9) · D 39.9% · R 56.9% · Other 3.2%
- 2008→2024 swing
- -5.0pp toward R · 2008: -12.0pp · 2024: -16.9pp
- All cycles
- 2024: R+16.9 2020: R+16.7 2016: R+21.0 2012: R+17.2 2008: R+12.0
Not yet ingested
- Civics
- —
Market trends
- HPI YoY
- ▼ -149.71%
- Current HPI
- 139.3612
- Rent YoY
- —
- Metro
- —
- State GDP YoY
- ▲ 3.21%
- F500 in state
- 116
Industry mix (Fortune 500 HQ in CA)
| Industry | F500 HQs | Revenue |
|---|---|---|
| Technology | 27 | $1,492B |
|
||
| Financial Services | 3 | $174B |
|
||
| Retail | 3 | $44B |
|
||
| Insurance | 3 | $26B |
|
||
| Media / Entertainment | 2 | $115B |
|
||
| Pharmaceuticals / Biotech | 2 | $62B |
|
||
Price history
+186.4% since first listed4 events — show timeline
- 2026-03-31 Price Changed $315,000 PAR
- 2026-01-04 Listed $325,000 PAR
- 2020-08-05 Listed $375,000 PAR
- 1997-09-17 Sold (Public Records) $110,000 Public Records
Property tax history
+1.8%/yrLatest (2025): $1,990 · -0.7% YoY. Source: county tax records.
Cash-flow waterfall
monthlySold comps — $/sqft
last 12 mo · ≤1 miLoading sold comps…