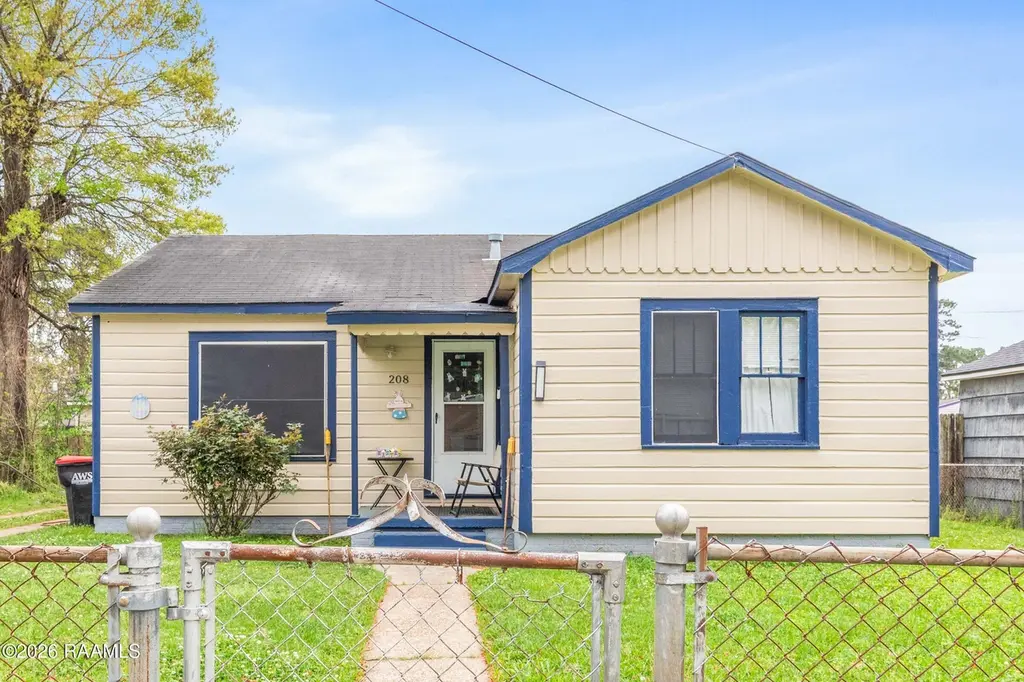
208 Randolph Dr · Lafayette, LA
Flood risk 3/10 · Minor
- FEMA flood zone
- X (unshaded)
- Chance of flooding over 30 yrs
- 0.2%
- Est. flood insurance / yr
- $507 – $1,088
Fire risk 3/10 · Minor
- Est. fire insurance / yr
- $1,269 – $2,357
Heat risk 8/10 · Major
- Hot days now (above 109°F)
- 7 days/yr
- Hot days in 30 yrs
- 21 days/yr
Wind risk 9/10 · Severe
- Chance of severe wind over 30 yrs
- 99.0%
Air-quality risk 2/10 · Minimal
- Unhealthy air days now
- 0 days/yr
- Unhealthy air days in 30 yrs
- 1 days/yr
Risk factors via First Street. Map © Google.
Why this score? — see what drove the B grade
The composite is a weighted blend of 9 inputs, each scored 0–100. Each bar is that input's sub-score; the figure is the points it added to the 100-point composite (weight × sub-score).
- Cash flow +30.0/30.0
- ARV discount +10.9/15.0
- DSCR +10.0/10.0
- 1% rule +8.9/10.0
- Rent growth +4.3/5.0
- Schools +3.6/10.0
- Livability +3.5/5.0
- Condition / age +2.5/5.0
- Appreciation +0.0/10.0
$69,500
🖨 Deal sheet 📄 Offer letter ✓ Due diligence
Listing remarks MLS
208 Randolph and 316 E Foch St. are ready for new owners! These income producing properties can be purchased as either a primary residence or continuing to be income producing properties! Can be sold separately or as a package deal. Call today for more information regarding the property's current leases!
Key facts
- 6,969 sq ft lot
- Garage
- Built 1964
Neighborhood map
What this means for you Summary
Snapshot
- This is a 2-bed/1.0-bath single-family listed at $70k.
Deal economics
- At list price, monthly cash flow is $329 ($4k/yr) — positive.
- The deal already cash-flows at list — no discount required.
- Meets the 1% rule at list price ($967 rent vs $70k).
- Recommended offer: $61k (12.0% below list) — sets the bar for market timing.
- Cap rate 12.0% vs local median 4.7% in Lafayette — top-decile yield for the area; either an underpriced asset or a hidden risk that comps aren't pricing in. Stress-test before assuming the spread holds.
Location & tenants
- Location reads 70/100 on livability (#63 in LA) — a middle-class / working-renter tenant base. Strengths: cost of living A+, housing A+, health & safety A+; Watch: amenities C-, employment C-, crime F.
- Lafayette Parish (urban): math 38% / reading 46% proficiency, ranked #19 of 98 in LA (top 19%) — families likely to look elsewhere, expect single-tenant / working-renter base with shorter leases.
- Market conditions: Rents rising fast (+7.3%/yr); 246 active listings in the ZIP; 17 comparable units currently listed for rent nearby; rentals at typical pace (median 21d on market — plan ~3-4 weeks tenant-placement turnaround); 47% of comp listings sitting > 30 days — soft ceiling on asking rent; lower-income renter base — watch delinquency; 1,585 units permitted in Lafayette Parish in 2024 (10 in 5+ unit buildings).
- This rent runs 35% of the median local income ($33k/yr) — at the standard rent-burdened threshold; future hikes will face affordability resistance.
Forward outlook
- Local home prices are declining (-3.0%/yr); year-one equity from $481 of loan paydown is wiped out by about $2k of value loss. Plan a longer hold.
- Lafayette County population projected at +34% by 2050 — long-run rental-demand tailwind backs the buy-and-hold thesis.
- At projected returns (-3.0% appreciation + 7.3% rent growth), your $19k cash investment doubles in ~5 years — after that, you're playing with house money.
Negotiation context
- It's been on market 163 days — a 12% lower offer ($61k) is reasonable based on typical stale-listing flexibility.
- 5 sale attempts since 28y ago; this cycle's ask has dropped $73k (51%) from the opening price — seller is motivated, your offer sets the floor, not the list.
Risks & watch-outs
- Climate carrying-cost: severe wind risk, 99% chance of damaging wind over 30y; extreme-heat days projected 7→21/yr by 2055 (HVAC capex compounding) — expect insurance premiums to compound above CPI over the hold.
Questions for the listing agent
- It's been on market 163 days. Have you received any prior offers? Is the seller open to a 12% concession, seller financing, or rate buy-down credit?
- Built in 1964 — when were the roof, HVAC, electrical panel, plumbing, and water heater last replaced?
- Why hasn't it sold? Are there any deal-killer items the seller is aware of (foundation, flood, title, zoning, code violations)?
- Is there a deadline driving the sale (1031 exchange, divorce, estate, relocation)? That informs how much negotiation room exists.
- Schools are B-rated — typically a magnet for longer-tenancy family renters. What's the average tenant stay here, and is there a school-zone premium baked into asking?
- Crime grade is F in this area — have there been break-ins, vandalism, or insurance claims at this property in the last 3 years? What carrier currently insures it and at what premium?
- What's the average days-on-market for RENTAL listings here right now (not sales)? A rising rental-DOM trend means longer vacancies and softer asking-rent achievability than the comps imply.
- What's the recent tenant-quality profile in this submarket — average credit score on applications, eviction rate, late-payment / NSF rate, and stable-employment percentage? A property-management company in the area should have these aggregated.
- How much new for-sale + rental construction is in the pipeline within 1–3 miles? Heavy new supply typically softens prices + rents 12–24 months out; constrained supply supports both.
Investment metrics
- 1% rule
- 1.39% ✓
- Cap rate
- 11.97%
- Cash-on-cash
- 20.28%
- DSCR
- 1.90
- GRM
- 6.0
CMA / ARV
- ARV (median comp)
- $75,264
- List price
- $69,500
- Delta
- -7.66%
- Verdict
- FAIR
- Comps
- 20 within 1.0 mi
Show comp detail 12 sales within ~0.75 mi
| Address | Dist | Beds/Ba | Sqft | Sold | Price | $/sf | Match |
|---|---|---|---|---|---|---|---|
| 118 Webb St | 0.34mi | 2/1.0 | 1,000 (-1%) | 11mo | $39,500 | $40 | 72 |
| 203 Carlton Dr | 0.08mi | 3/1.0 (+1) | 994 (-2%) | 21mo | $58,173 | $59 | 71 |
| 110 N Pine St | 0.27mi | 3/1.0 (+1) | 979 (-4%) | 8mo | $60,500 | $62 | 70 |
| 114 Randolph Dr | 0.15mi | 3/1.0 (+1) | 920 (-9%) | 6mo | $74,000 | $80 | 67 |
| 162 Sherwood Dr | 0.08mi | 3/1.0 (+1) | 900 (-11%) | 20mo | $81,000 | $90 | 56 |
| 327 Sonny St | 0.66mi | 3/1.0 (+1) | 975 (-4%) | 7mo | $37,000 | $38 | 52 |
| 106 Narcisse St | 0.20mi | 3/1.0 (+1) | 1,150 (+13%) | 17mo | $79,999 | $70 | 49 |
| 148 E Gilman Rd | 0.71mi | 3/1.5 (+1) | 1,050 (+4%) | 7mo | $135,000 | $129 | 48 |
| 209 Joy St | 0.33mi | 3/1.5 (+1) | 1,123 (+11%) | 17mo | $140,500 | $125 | 45 |
| 315 Doc Duhon St | 0.69mi | 2/1.5 | 1,102 (+9%) | 14mo | $86,300 | $78 | 39 |
| 418 Odile St | 0.70mi | 3/1.5 (+1) | 1,044 (+3%) | 19mo | $85,000 | $81 | 39 |
| 308 Sonny St | 0.73mi | 3/2.0 (+1) | 911 (-10%) | 20mo | $100,000 | $110 | 24 |
Match score weights: distance 35% · size 25% · config 20% · recency 20%. Top-matched comps best support the ARV.
Projected returns pro-forma
-3.0% appreciation · 7.35% rent growth · sell at horizon
- IRR
- 17.1%
- Equity multiple
- 1.72×
- Total profit
- $14,083
- Equity at exit
- $10,363
- IRR
- 28.4%
- Equity multiple
- 4.03×
- Total profit
- $59,003
- Equity at exit
- $6,009
Cash invested: $19,460 (down + closing). Projections, not guarantees.
Landlord ↔ Tenant lean methodology
- Overall (STATE)
- 90 Strongly Landlord-Friendly
- State Louisiana
- 90 Strongly Landlord-Friendly · R+12
- County
- — inherits STATE
- City
- — inherits STATE
ZIP-level market 70501
- Rents YoY
- 7.3%
- Active inventory
- 246
- Price-to-rent
- 6.0×
Monthly cashflow live
- Estimated rent
- $967 high interval (Pro) →
- Mortgage (P&I)
- −$364
- Tax from tax record
- −$42 /mo · $498/yr
- Insurance
- −$29
- HOA
- −$0
- Vacancy / Maint / Mgmt
- −$203
- Net cashflow
- $329
Break-even live
UW: 25.0% down · 7.5% · 30yr · 1.5% tax · 5.0% vac · 8.0% maint · 8.0% mgmt
Financing live
Cash to close
- Down payment
- $17,375
- Closing costs
- $2,085
- Reserves months
- —
- Total cash needed
- —
Loan-product check · same deal, 3 products live
Conventional
25% down · 7.5% · 30yr
- Down + closing
- —
- Monthly P&I
- —
- Monthly cashflow
- —
- DSCR
- —
- Eligible?
- —
Personal DTI + credit; lowest rate.
DSCR
20% down · 8.5% · 30yr
- Down + closing
- —
- Monthly P&I
- —
- Monthly cashflow
- —
- DSCR
- —
- Eligible?
- —
No personal income docs; deal must DSCR.
Hard money
10% down · 12.0% · 12mo
- Down + closing
- —
- Monthly P&I
- —
- Monthly cashflow
- —
- DSCR
- —
- Eligible?
- —
Short-term bridge; refi at stabilization.
Rent comps 17 comps
| Address | Beds | Baths | Sqft | Rent | $/sqft | DOM | Units | Dist |
|---|---|---|---|---|---|---|---|---|
| 610 Sunset Dr Lafayette, LA | 2.0 | 1.0 | 1000 | $800 | $0.80 | 43d | 1 | 0.26mi |
| 241 N Pine St Lafayette, LA | 2.0 | 1.0 | 864 | $950 | $1.10 | 43d | 1 | 0.49mi |
| 319 Tissington St Lafayette, LA | 2.0 | 1.0 | 956 | $775 | $0.81 | 43d | 1 | 0.57mi |
| 215 Peggy St Lafayette, LA | 3.0 | 2.0 | 1100 | $1,100 | $1.00 | 13d | 1 | 0.83mi |
| 215 Peggy St Lafayette, LA | 3.0 | 2.0 | 1100 | $1,100 | $1.00 | 20d | 1 | 0.83mi |
| 313 Hobson St Lafayette, LA | 3.0 | 1.0 | 1000 | $1,100 | $1.10 | 20d | 1 | 0.92mi |
| 2820 Louisiana Ave Lafayette, LA | 1.0–2.0 | 1.0–2.0 | 821 | $1,145 | $1.39 | 13d | 20 | 0.93mi |
| 1030 9th St Lafayette, LA | 2.0 | 1.0 | 800 | $800 | $1.00 | 43d | 1 | 0.94mi |
| 810 Fairmont Ln Lafayette, LA | 3.0 | 1.0 | 1000 | $992 | $0.99 | 43d | 1 | 0.98mi |
| 2826 Louisiana Ave #1111 Lafayette, LA | 2.0 | 2.0 | 1140 | $1,200 | $1.05 | 44d | 1 | 1.00mi |
| 2826 Louisiana Ave #907 Lafayette, LA | 2.0 | 2.5 | 1100 | $950 | $0.86 | 20d | 1 | 1.00mi |
| 2830 Louisiana Ave #6 Lafayette, LA | 2.0 | 1.5 | 1100 | $950 | $0.86 | 13d | 1 | 1.03mi |
| 206 N Washington St Lafayette, LA | 3.0 | 1.0 | 900 | $900 | $1.00 | 20d | 1 | 1.21mi |
| 815 Martin Luther King Junior Dr Apt 29 Lafayette, LA | 2.0 | 1.0 | 873 | $800 | $0.92 | 20d | 1 | 1.26mi |
| 815 Martin Luther King Junior Dr Unit 40 Lafayette, LA | 2.0 | 1.0 | 873 | $800 | $0.92 | 43d | 1 | 1.26mi |
| 908 Saint Charles St Lafayette, LA | 3.0 | 2.0 | 1200 | $1,250 | $1.04 | 20d | 1 | 1.31mi |
| 615 Lafayette St Lafayette, LA | 2.0 | 2.0 | 1188 | $1,350 | $1.14 | 43d | 1 | 1.49mi |
Listing history 25 events
-
2026-06-18days on market $69,500 Active 163 DOM
-
2026-06-17days on market $69,500 Active 162 DOM
-
2026-06-16days on market $69,500 Active 161 DOM
-
2026-06-15days on market $69,500 Active 160 DOM
-
2026-06-14days on market $69,500 Active 158 DOM
-
2026-06-13days on market $69,500 Active 157 DOM
-
2026-06-10days on market $69,500 Active 155 DOM
-
2026-06-09days on market $69,500 Active 154 DOM
-
2026-06-08days on market $69,500 Active 153 DOM
-
2026-06-07days on market $69,500 Active 152 DOM
-
2026-06-05days on market $69,500 Active 149 DOM
-
2026-06-03days on market $69,500 Active 148 DOM
-
2026-06-02days on market $69,500 Active 147 DOM
-
2026-06-01days on market $69,500 Active 146 DOM
-
2026-05-31days on market $69,500 Active 145 DOM
-
2026-05-30days on market $69,500 Active 144 DOM
-
2026-01-12$142,500 Active 305-char remark
Show marketing remark (305 chars)
208 Randolph and 316 E Foch St. are ready for new owners! These income producing properties can be purchased as either a primary residence or continuing to be income producing properties! Can be sold separately or as a package deal. Call today for more information regarding the property's current leases!
-
2026-01-06$69,500 Active 238-char remark
Show marketing remark (238 chars)
208 Randolph is ready for new owners! This income producing property can be purchased as either a primary residence or continuing to be an income producing property! Call today for more information regarding the property's current leases!
-
2025-05-06soldstatus $400,000
-
2012-02-29soldstatus $38,000
-
2012-02-23soldstatus $38,000
-
2010-12-20$40,000
-
2000-01-18$45,000
-
1998-03-27soldstatus $37,000
-
1998-01-30$41,500
ⓘ Source: listings_history table (triggers on properties + properties_extension) + one-shot
backfill from property_details.listing_events for pre-trigger history.
Tax reassessment forecast LA · Resets to sale price
- Current annual tax
- $498 · $42/mo
- Projected year-2 tax
- $498 · $42/mo
- Expected delta
- $0/yr ($0/mo · 0.0%)
ⓘ Screening estimate from a state-policy table — verify with the county assessor before closing.
Climate risk First Street
- Flood 3/10 Moderate FEMA zone X (unshaded) · 20% chance over 30 yrs
- Wildfire 3/10 Moderate
- Heat 8/10 Severe 7 d/yr ≥109°F today · 21 d/yr by 30 yrs out
- Wind 9/10 Extreme 99% chance of damaging wind over 30 yrs
- Air quality 2/10 Low 0 unhealthy d/yr today · 1 by 30 yrs out
Nearby sold comps map
Loading sold comps map…
Walkable amenities ~0.75 mi
Loading nearby amenities…
Taxation est. · year 1
- Rental income
- $11,601
- − Mortgage interest
- −$3,893
- − Property taxes
- −$498
- − Insurance
- −$348
- − Repairs & maintenance
- −$928
- − Management
- −$928
- − Depreciation
- −$2,022
- Taxable income
- $2,984
- Est. tax owed @ 24.0%
- −$716
- After-tax cash flow
- $3,229/yr
For passive investors: Depreciation is non-cash, so a rental often shows a tax loss while cash-flowing — sheltering income. Rental losses are passive: they offset passive income freely, and up to $25,000/yr can offset ordinary (W-2) income if you actively participate and your MAGI is under $100k (phasing out to $0 by $150k); unused losses carry forward. On sale, claimed depreciation is recaptured at up to 25%, and gains may owe capital-gains tax (a 1031 exchange can defer both). Figures are a year-1 estimate at your 24.0% rate — not tax advice; consult a CPA.
Schools (NCES district)
- District
- Lafayette Parish
- NCES district ID
- 2200870
- Math proficiency
- 38% ▼ -32.00%
- Reading proficiency
- 46% ▼ -24.00%
- Median HH income
- $50,238
- Composite
- 36.15/100
- National rank
- #4741
- State rank
- #19 of 98 in LA
Livability — Lafayette
- Score
- 70/100
- State rank
- #63
- US rank
- #8133
Category grades
Schools grade is shown separately in the Schools card above.
Census & demographics
- Census place
- Lafayette, LA
- County
- Lafayette Parish · 207,544 people
- City population
- 158,114
- Metro
- Lafayette, LA
- Population (ZIP)
- 26,465
- Household income
- $33,365
- Rent vs Own
- Severe rent burden
- 2089.0
Population outlook (Lafayette County) Hauer SSP2
- Today (2025)
- 280,930 people
- By 2030
- 301,092 · +7.2%
- By 2040
- 339,456 · +20.8%
- By 2050
- 375,156 · +33.5%
- By 2075
- 451,672 · +60.8%
- By 2100
- 497,203 · +77.0%
Race, ethnicity, and origin ACS 2023
- Neighborhood character
- Predominantly Black (73%)
- Race & ethnicity
- Black 73% White 18% Two or more races 6% Hispanic / Latino 4%
- Common ancestry
- Lithuanian 4%
- Foreign-born
- 2% · Canada
- Languages at home
- 95% English-only · Spanish 3% French/Haitian/Cajun 2%
Political lean MEDSL · Lafayette
- 2024 margin
- Solid R (+31.4) · D 33.5% · R 64.8% · Other 1.7%
- 2008→2024 swing
- -0.1pp no change · 2008: -31.3pp · 2024: -31.4pp
- All cycles
- 2024: R+31.4 2020: R+28.7 2016: R+33.6 2012: R+33.7 2008: R+31.3
Not yet ingested
- Civics
- —
Market trends
- HPI YoY
- ▼ -108.63%
- Current HPI
- 81.2963
- Rent YoY
- ▲ 7.35%
- Metro
- Lafayette, LA
- State GDP YoY
- ▲ 3.29%
- F500 in state
- 10
Industry mix (Fortune 500 HQ in LA)
| Industry | F500 HQs | Revenue |
|---|---|---|
| Telecommunications | 2 | $23B |
|
||
| Utilities | 1 | $12B |
|
||
| Wholesale / Distribution | 1 | $5B |
|
||
| Advertising | 1 | $2B |
|
||
Price history
+243.4% since first listed9 events — show timeline
- 2026-01-12 Listed $142,500 AcadianaMLS
- 2026-01-06 Listed $69,500 AcadianaMLS
- 2025-05-06 Sold (Public Records) $400,000 Public Records
- 2012-02-29 Sold (Public Records) $38,000 Public Records
- 2012-02-23 Sold (MLS) $38,000 AcadianaMLS
- 2010-12-20 Listed $40,000 AcadianaMLS
- 2000-01-18 Listed $45,000 AcadianaMLS
- 1998-03-27 Sold (MLS) $37,000 AcadianaMLS
- 1998-01-30 Listed $41,500 AcadianaMLS
Property tax history
+2.3%/yrLatest (2025): $498 · -1.1% YoY. Source: county tax records.
Cash-flow waterfall
monthlySold comps — $/sqft
last 12 mo · ≤1 miLoading sold comps…