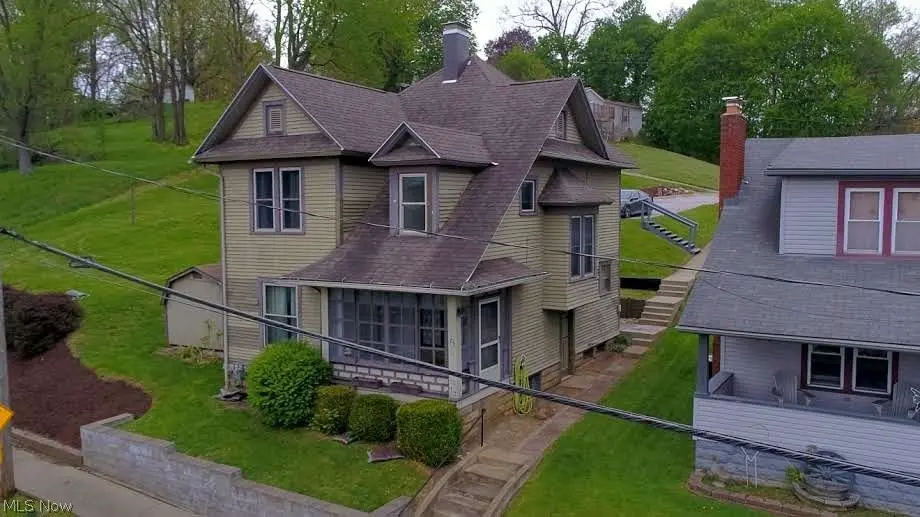
75 N Crawford St · Millersburg, OH
Flood risk 1/10 · Minimal
- FEMA flood zone
- X (unshaded)
- Chance of flooding over 30 yrs
- 0.0%
- Est. flood insurance / yr
- $473 – $860
Fire risk 1/10 · Minimal
- Est. fire insurance / yr
- $713 – $1,323
Heat risk 3/10 · Minor
- Hot days now (above 98°F)
- 7 days/yr
- Hot days in 30 yrs
- 17 days/yr
Wind risk 2/10 · Minimal
- Chance of severe wind over 30 yrs
- —
Air-quality risk 2/10 · Minimal
- Unhealthy air days now
- 0 days/yr
- Unhealthy air days in 30 yrs
- 1 days/yr
Risk factors via First Street. Map © Google.
Why this score? — see what drove the C- grade
The composite is a weighted blend of 9 inputs, each scored 0–100. Each bar is that input's sub-score; the figure is the points it added to the 100-point composite (weight × sub-score).
- ARV discount +15.0/15.0
- Appreciation +10.0/10.0
- Cash flow +8.1/30.0
- Schools +5.2/10.0
- Livability +3.6/5.0
- Rent growth +2.5/5.0
- Condition / age +2.5/5.0
- DSCR +2.1/10.0
- 1% rule +1.6/10.0
$183,000
🖨 Deal sheet (PDF) 📄 Offer letter ✓ Due diligence
Listing remarks
Once you view this home you will appreciate the historical charm from the stunning hardwood floors, sunroom, dormer, pocket door to the landing on the staircase. Starting in the kitchen with a beautiful built-in hutch and all of the appliances will stay for the new owner. Throughout the home, wide wooden trim enhances its character. Large dining room that flows to the living room. Well preserved pocket door separating living room from foyer. The sunroom, adorned with new luxury vinyl flooring, serves as a perfect spot for enjoying morning coffee. This residence also includes an English-style water closet—essentially a small room dedicated to the toilet. The open staircase welcomes bea
Key facts
- 0.31 acre lot
- Parking
- Built 1940
Neighborhood map
What this means for you Summary
Snapshot
- This is a 3-bed/1.5-bath single-family listed at $183k.
Deal economics
- At list price, monthly cash flow is $-180 ($-2k/yr) — negative.
- To cash-flow at today's rent, offer at most $151k (17.4% below list).
- To meet the 1% rule (rent ≥ 1% of price), the offer needs to be $121k (33.9% below list).
- Recommended offer: $121k (33.9% below list) — sets the bar for 1% rule.
Location & tenants
- Location reads 71/100 on livability (#445 in OH) — a middle-class / working-renter tenant base. Strengths: cost of living A+, housing A+, crime A; Watch: employment D+, amenities F, commute F.
- West Holmes Local (rural): math 60% / reading 62% proficiency, ranked #283 of 656 in OH (top 43%) — acceptable for families but not a draw, mixed tenant base, ~2y average lease.
- Zoned schools: Millersburg Elementary School (math 72% / reading 62%, grade B+, #456 of 1,584 statewide, top 31%, 379 students, 36% FRL); West Holmes Middle School (math 59% / reading 61%, grade B, #266 of 654 statewide, top 41%, 409 students, 35% FRL); West Holmes High School (math 42% / reading 62%, grade D+, #343 of 781 statewide, top 47%, 540 students, 28% FRL) — zoned schools at 33% FRL track the district average.
- Market conditions: 61 active listings in the ZIP; solid renter incomes; 8 units permitted in Holmes County in 2024 (0 in 5+ unit buildings).
Forward outlook
- In year one you build about $20k of equity ($1k loan paydown + $18k appreciation (10.0% local appreciation)).
- Holmes County population projected to shrink 4% by 2050 — rents likely to lag national; underwrite the cash flow, not the appreciation.
- By year 2, paydown + projected appreciation supports a ~$31k cash-out refi (75% LTV) — recoverable capital for the next deal without selling this one.
Negotiation context
- Only 1 days on market — expect competitive offers; lowballing is unlikely to land.
- 3 sale attempts since 20y ago with the ask held roughly flat each time — persistent listings suggest the price (not the market) is what's stuck; bring a comps-based counter.
- Current owner paid $78k; list at $183k implies a 135% gain — meaningful room to come down on a strong offer.
Risks & watch-outs
- Watch-outs: built in 1940 — expect roof / HVAC / electrical / plumbing capex.
Questions for the listing agent
- What do current leases actually rent for vs. the listed asking? Can we see a recent rent roll and the last 12 months of T-12 income?
- Built in 1940 — when were the roof, HVAC, electrical panel, plumbing, and water heater last replaced?
- Is there a deadline driving the sale (1031 exchange, divorce, estate, relocation)? That informs how much negotiation room exists.
- Schools are B-rated — typically a magnet for longer-tenancy family renters. What's the average tenant stay here, and is there a school-zone premium baked into asking?
- What's the average days-on-market for RENTAL listings here right now (not sales)? A rising rental-DOM trend means longer vacancies and softer asking-rent achievability than the comps imply.
- What's the recent tenant-quality profile in this submarket — average credit score on applications, eviction rate, late-payment / NSF rate, and stable-employment percentage? A property-management company in the area should have these aggregated.
- How much new for-sale + rental construction is in the pipeline within 1–3 miles? Heavy new supply typically softens prices + rents 12–24 months out; constrained supply supports both.
Investment metrics
- 1% rule
- 0.66% ✗
- Cap rate
- 5.11%
- Cash-on-cash
- -4.21%
- DSCR
- 0.81
- GRM
- 12.6
CMA / ARV
- ARV (on-the-fly)
- $219,336
- Comps found
- 11
Show comp detail 11 sales within ~0.75 mi
| Address | Dist | Beds/Ba | Sqft | Sold | Price | $/sf | Match |
|---|---|---|---|---|---|---|---|
| 910 Fairview Ave | 0.22mi | 3/1.0 | 1,344 (-9%) | 2mo | $140,000 | $104 | 70 |
| 46 S Crawford St | 0.12mi | 4/1.0 (+1) | 1,624 (+10%) | 2mo | $165,000 | $102 | 70 |
| 733 Critchfield St | 0.43mi | 3/2.0 | 1,434 (-3%) | 4mo | $130,000 | $91 | 70 |
| 284 S Alexander St | 0.24mi | 3/1.5 | 1,344 (-9%) | 10mo | $236,000 | $176 | 65 |
| 120 Miller Dr | 0.19mi | 2/2.0 (-1) | 1,350 (-9%) | 18mo | $200,000 | $148 | 54 |
| 622 Elm St | 0.44mi | 3/2.0 | 1,288 (-13%) | 4mo | $255,000 | $198 | 53 |
| 688 Forlow St | 0.64mi | 3/2.0 | 1,534 (+4%) | 12mo | $255,000 | $166 | 52 |
| 898 E Jackson St | 0.56mi | 3/1.0 | 1,328 (-10%) | 12mo | $95,000 | $72 | 45 |
| 17 Cliff Ln | 0.51mi | 3/2.5 | 1,322 (-11%) | 14mo | $282,500 | $214 | 43 |
| 609 S Washington St | 0.48mi | 3/1.5 | 1,292 (-13%) | 22mo | $155,000 | $120 | 37 |
| 218 Ledges Drive Dr | 0.69mi | 4/3.0 (+1) | 1,528 (+3%) | 19mo | $330,000 | $216 | 36 |
Match score weights: distance 35% · size 25% · config 20% · recency 20%. Top-matched comps best support the ARV.
Projected returns pro-forma
10.0% appreciation · 3.0% rent growth · sell at horizon
- IRR
- 21.3%
- Equity multiple
- 2.72×
- Total profit
- $88,153
- Equity at exit
- $164,861
- IRR
- 19.2%
- Equity multiple
- 6.24×
- Total profit
- $268,481
- Equity at exit
- $355,529
Cash invested: $51,240 (down + closing). Projections, not guarantees.
Landlord ↔ Tenant lean methodology
- Overall (STATE)
- 73 Landlord-Friendly
- State Ohio
- 73 Landlord-Friendly · R+6
- County
- — inherits STATE
- City
- — inherits STATE
ZIP-level market 44654
- Home prices YoY
- 4.3%
- Active inventory
- 61
- Price-to-rent
- 12.6×
Monthly cashflow live
- Estimated rent
- $1,210 medium interval (Pro) →
- Mortgage (P&I)
- −$960
- Tax from tax record
- −$100 /mo · $1,196/yr
- Insurance
- −$76
- HOA
- −$0
- Vacancy / Maint / Mgmt
- −$254
- Net cashflow
- $-180
Break-even live
Sensitivity live
| Price | -10% $-76 | -5% $-128 | +0% $-180 | +5% $-232 | +10% $-283 |
|---|---|---|---|---|---|
| Rent | -10% $-275 | -5% $-228 | +0% $-180 | +5% $-132 | +10% $-84 |
| Rate | -1.0pp $-88 | -0.5pp $-133 | base $-180 | +0.5pp $-227 | +1.0pp $-275 |
UW: 25.0% down · 7.5% · 30yr · 1.5% tax · 5.0% vac · 8.0% maint · 8.0% mgmt
Financing live
Cash to close
- Down payment
- $45,750
- Closing costs
- $5,490
- Reserves months
- —
- Total cash needed
- —
Loan-product check · same deal, 3 products live
Conventional
25% down · 7.5% · 30yr
- Down + closing
- —
- Monthly P&I
- —
- Monthly cashflow
- —
- DSCR
- —
- Eligible?
- —
Personal DTI + credit; lowest rate.
DSCR
20% down · 8.5% · 30yr
- Down + closing
- —
- Monthly P&I
- —
- Monthly cashflow
- —
- DSCR
- —
- Eligible?
- —
No personal income docs; deal must DSCR.
Hard money
10% down · 12.0% · 12mo
- Down + closing
- —
- Monthly P&I
- —
- Monthly cashflow
- —
- DSCR
- —
- Eligible?
- —
Short-term bridge; refi at stabilization.
Listing history 7 events
-
2026-04-25status Pending
-
2026-04-23$183,000 Active
-
2007-01-16historical
-
2006-08-17$94,500
-
2006-07-27historical
-
2006-01-27$98,500
-
2000-11-28soldstatus $77,900
ⓘ Source: listings_history table (triggers on properties + properties_extension) + one-shot
backfill from property_details.listing_events for pre-trigger history.
Tax reassessment forecast OH · Partial reset (capped growth)
- Current annual tax
- $1,196 · $100/mo
- Projected year-2 tax
- $2,025 · $169/mo
- Expected delta
- +$830/yr (+$69/mo · 69.4%)
ⓘ Screening estimate from a state-policy table — verify with the county assessor before closing.
Climate risk First Street
- Flood 1/10 Low FEMA zone X (unshaded) · 0% chance over 30 yrs
- Wildfire 1/10 Low
- Heat 3/10 Moderate 7 d/yr ≥98°F today · 17 d/yr by 30 yrs out
- Wind 2/10 Low
- Air quality 2/10 Low 0 unhealthy d/yr today · 1 by 30 yrs out
Nearby sold comps map
Loading sold comps map…
Walkable amenities ~0.75 mi
Loading nearby amenities…
Taxation est. · year 1
- Rental income
- $14,518
- − Mortgage interest
- −$10,251
- − Property taxes
- −$1,196
- − Insurance
- −$915
- − Repairs & maintenance
- −$1,161
- − Management
- −$1,161
- − Depreciation
- −$5,324
- Taxable loss
- −$5,490
- Est. tax savings @ 24.0%
- +$1,318
- After-tax cash flow
- $-840/yr
For passive investors: Depreciation is non-cash, so a rental often shows a tax loss while cash-flowing — sheltering income. Rental losses are passive: they offset passive income freely, and up to $25,000/yr can offset ordinary (W-2) income if you actively participate and your MAGI is under $100k (phasing out to $0 by $150k); unused losses carry forward. On sale, claimed depreciation is recaptured at up to 25%, and gains may owe capital-gains tax (a 1031 exchange can defer both). Figures are a year-1 estimate at your 24.0% rate — not tax advice; consult a CPA.
Schools (NCES district)
- District
- West Holmes Local
- NCES district ID
- 3904769
- Math proficiency
- 60% ▼ -12.00%
- Reading proficiency
- 62% ▼ -7.00%
- Median HH income
- $46,531
- Composite
- 51.57/100
- National rank
- #1711
- State rank
- #283 of 656 in OH
Livability — Millersburg
- Score
- 71/100
- State rank
- #445
- US rank
- #7306
Category grades
Schools grade is shown separately in the Schools card above.
Census & demographics
- Census place
- Millersburg, OH
- County
- Holmes · 38,872 people
- Population (ZIP)
- 20,329
- Household income
- $75,195
- Rent vs Own
- Severe rent burden
- 4.3
Population outlook (Holmes County) Hauer SSP2
- Today (2025)
- 44,801 people
- By 2030
- 45,021 · +0.5%
- By 2040
- 44,857 · +0.1%
- By 2050
- 43,040 · -3.9%
- By 2075
- 33,122 · -26.1%
- By 2100
- 17,241 · -61.5%
Race, ethnicity, and origin ACS 2023
- Neighborhood character
- Predominantly White (97%)
- Race & ethnicity
- White 97% Hispanic / Latino 1%
- Common ancestry
- Polish 9% Italian 3% Lithuanian 2%
- Foreign-born
- 1%
- Languages at home
- 54% English-only · German/W. Germanic 45%
Political lean MEDSL · Holmes
- 2024 margin
- Solid R (+69.2) · D 15.0% · R 84.2%
- 2008→2024 swing
- -27.9pp toward R · 2008: -41.2pp · 2024: -69.2pp
- All cycles
- 2024: R+69.2 2020: R+68.0 2016: R+62.9 2012: R+52.8 2008: R+41.2
Not yet ingested
- Civics
- —
Market trends
- HPI YoY
- ▲ 11.03%
- Current HPI
- 268.0336
- Rent YoY
- —
- Metro
- —
- State GDP YoY
- ▲ 1.98%
- F500 in state
- 48
Industry mix (Fortune 500 HQ in OH)
| Industry | F500 HQs | Revenue |
|---|---|---|
| Insurance | 3 | $145B |
|
||
| Industrial Machinery | 3 | $49B |
|
||
| Financial Services | 3 | $24B |
|
||
| Consumer Goods | 2 | $93B |
|
||
| Aerospace / Defense | 2 | $47B |
|
||
| Utilities | 2 | $33B |
|
||
Price history
+134.9% since first listed7 events — show timeline
- 2026-04-25 Pending — MLSNOW
- 2026-04-23 Listed $183,000 MLSNOW
- 2007-01-16 Listing Removed — MLSNOW
- 2006-08-17 Listed $94,500 MLSNOW
- 2006-07-27 Listing Removed — MLSNOW
- 2006-01-27 Listed $98,500 MLSNOW
- 2000-11-28 Sold (Public Records) $77,900 Public Records
Property tax history
+2.9%/yrLatest (2025): $1,196 · +0.0% YoY. Source: county tax records.
Cash-flow waterfall
monthlySold comps — $/sqft
last 12 mo · ≤1 miLoading sold comps…