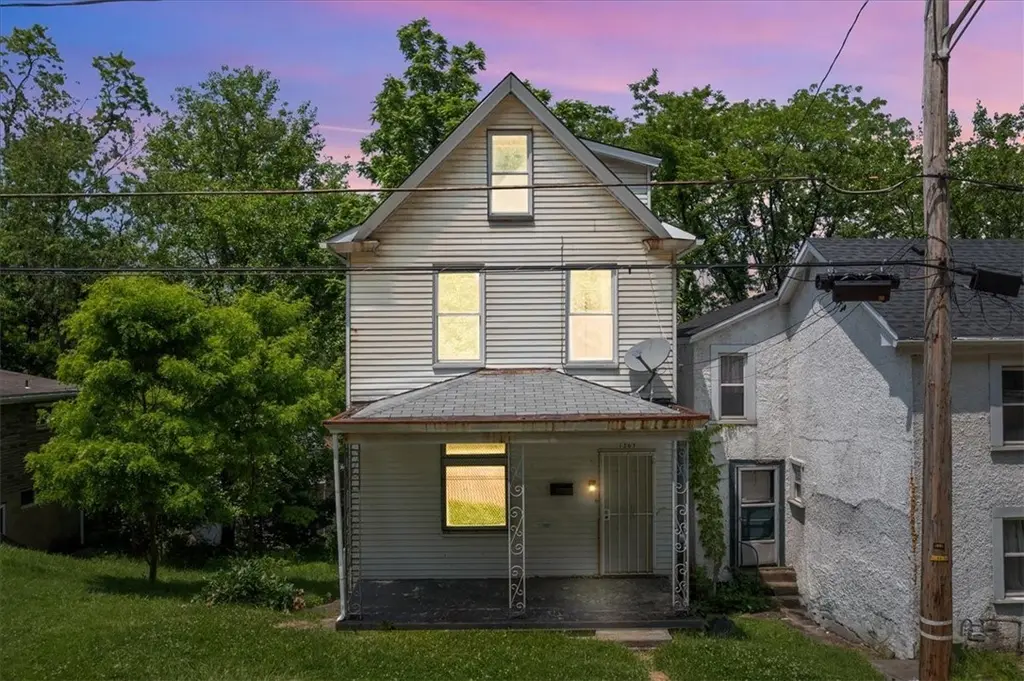
1567 Princeton Blvd · Wilkinsburg, PA
Flood risk 1/10 · Minimal
- FEMA flood zone
- X (unshaded)
- Chance of flooding over 30 yrs
- 0.0%
- Est. flood insurance / yr
- $473 – $860
Fire risk 1/10 · Minimal
- Est. fire insurance / yr
- $511 – $949
Heat risk 3/10 · Minor
- Hot days now (above 96°F)
- 7 days/yr
- Hot days in 30 yrs
- 16 days/yr
Wind risk 2/10 · Minimal
- Chance of severe wind over 30 yrs
- —
Air-quality risk 4/10 · Minor
- Unhealthy air days now
- 4 days/yr
- Unhealthy air days in 30 yrs
- 5 days/yr
Risk factors via First Street. Map © Google.
Why this score? — see what drove the C grade
The composite is a weighted blend of 9 inputs, each scored 0–100. Each bar is that input's sub-score; the figure is the points it added to the 100-point composite (weight × sub-score).
- Cash flow +30.0/30.0
- DSCR +10.0/10.0
- 1% rule +7.7/10.0
- Livability +3.8/5.0
- Rent growth +3.5/5.0
- Condition / age +2.5/5.0
- Schools +1.5/10.0
- ARV discount +0.0/15.0
- Appreciation +0.0/10.0
$135,000
🖨 Deal sheet 📄 Offer letter ✓ Due diligence
Listing remarks MLS
As Is Cond, Subj to Corp Approval, Spec Warr Deed, Spec Corp Addenda, Must PreQual Buyer, Buyer makes own Inspects+Dye+Lien Certs, List Off Holds H/M, Call for Title Report info
Key facts
- 3,201 sq ft lot
- Built 1900
- Listed 50 days
Property features AI
Exterior
- Home design: Two-story house
- Exterior features: Resale property
Interior
- Kitchen: Kitchen on main level (15x8)
- Bedrooms: Four bedrooms (three labeled Upper); Bedroom dimensions include 10x14, 11x14, 10x13, and an additional 15x15 space on the Upper level
- Bathrooms: One full bathroom; One half bathroom
- Interior features: Entry/foyer; Den
Neighborhood map
What this means for you Summary
Snapshot
- This is a 4-bed/1.5-bath single-family listed at $135k.
Deal economics
- At list price, monthly cash flow is $539 ($6k/yr) — positive.
- The deal already cash-flows at list — no discount required.
- Meets the 1% rule at list price ($2k rent vs $135k).
- Recommended offer: $131k (3.0% below list) — sets the bar for market timing.
Location & tenants
- Location reads 76/100 on livability (#411 in PA, #3,754 nationally) — a middle-class / working-renter tenant base. Strengths: commute A+, cost of living A+, housing A+; Watch: schools D+, health & safety D+, crime F.
- Wilkinsburg Borough SD (suburban): math 14% / reading 23% proficiency, ranked #503 of 539 in PA (top 93%) — low school quality limits family demand, transient renter base, plan for 1-2y turnover; 96% free/reduced lunch — lower-income household profile, screen leases tightly.
- Market conditions: Rents rising (+3.9%/yr); 118 active listings in the ZIP; 16 comparable units currently listed for rent nearby; rentals at typical pace (median 24d on market — plan ~3-4 weeks tenant-placement turnaround); 2,996 units permitted in Allegheny County in 2024 (1,588 in 5+ unit buildings).
- This rent runs 37% of the median local income ($55k/yr) — at the standard rent-burdened threshold; future hikes will face affordability resistance.
Forward outlook
- Local home prices are declining (-3.0%/yr); year-one equity from $933 of loan paydown is wiped out by about $4k of value loss. Plan a longer hold.
- At projected returns (-3.0% appreciation + 3.9% rent growth), your $38k cash investment doubles in ~7 years — after that, you're playing with house money.
Negotiation context
- It's been on market 50 days — a 3% lower offer ($131k) is reasonable based on typical stale-listing flexibility.
- 4 sale attempts since 25y ago with the ask held roughly flat each time — persistent listings suggest the price (not the market) is what's stuck; bring a comps-based counter.
- Current owner paid $9k; list at $135k implies a 1417% gain — meaningful room to come down on a strong offer.
Risks & watch-outs
- Watch-outs: built in 1900 — expect roof / HVAC / electrical / plumbing capex.
Questions for the listing agent
- It's been on market 50 days. Have you received any prior offers? Is the seller open to a 3% concession, seller financing, or rate buy-down credit?
- Built in 1900 — when were the roof, HVAC, electrical panel, plumbing, and water heater last replaced?
- Is there a deadline driving the sale (1031 exchange, divorce, estate, relocation)? That informs how much negotiation room exists.
- Schools are D-rated, which usually means shorter tenancies and higher turnover. Who's the typical renter profile here, and what's been the actual vacancy rate?
- Crime grade is F in this area — have there been break-ins, vandalism, or insurance claims at this property in the last 3 years? What carrier currently insures it and at what premium?
- What's the average days-on-market for RENTAL listings here right now (not sales)? A rising rental-DOM trend means longer vacancies and softer asking-rent achievability than the comps imply.
- What's the recent tenant-quality profile in this submarket — average credit score on applications, eviction rate, late-payment / NSF rate, and stable-employment percentage? A property-management company in the area should have these aggregated.
- How much new for-sale + rental construction is in the pipeline within 1–3 miles? Heavy new supply typically softens prices + rents 12–24 months out; constrained supply supports both.
Investment metrics
- 1% rule
- 1.27% ✓
- Cap rate
- 11.08%
- Cash-on-cash
- 17.10%
- DSCR
- 1.76
- GRM
- 6.6
CMA / ARV
- ARV (median comp)
- $103,242
- List price
- $135,000
- Delta
- 30.76%
- Verdict
- OVERPRICED
- Comps
- 20 within 1.0 mi
Show comp detail 12 sales within ~0.75 mi
| Address | Dist | Beds/Ba | Sqft | Sold | Price | $/sf | Match |
|---|---|---|---|---|---|---|---|
| 1117 James St | 0.30mi | 3/2.0 (-1) | 1,512 (0%) | 6mo | $147,325 | $97 | 74 |
| 1137 Jackson St | 0.43mi | 3/3.0 (-1) | 1,488 (-2%) | 8mo | $240,000 | $161 | 59 |
| 1446 Center St | 0.59mi | 3/1.0 (-1) | 1,478 (-2%) | 12mo | $65,000 | $44 | 52 |
| 42 Barton Dr | 0.50mi | 3/1.5 (-1) | 1,365 (-10%) | 5mo | $257,000 | $188 | 52 |
| 1459 Foliage St | 0.65mi | 3/1.0 (-1) | 1,500 (-1%) | 12mo | $18,000 | $12 | 51 |
| 1133 Sperling Dr | 0.66mi | 4/1.5 | 1,350 (-11%) | 0mo | $151,000 | $112 | 51 |
| 1410 Traymore Ave | 0.51mi | 3/2.5 (-1) | 1,408 (-7%) | 10mo | $219,000 | $156 | 48 |
| 1910 Beech St | 0.39mi | 3/1.5 (-1) | 1,724 (+14%) | 7mo | $230,000 | $133 | 47 |
| 2072 Boggs Ave | 0.59mi | 3/1.5 (-1) | 1,324 (-12%) | 1mo | $83,000 | $63 | 46 |
| 615 Midland St | 0.48mi | 3/1.0 (-1) | 1,356 (-10%) | 10mo | $160,000 | $118 | 45 |
| 1334 Franklin Ave | 0.36mi | 3/2.0 (-1) | 1,736 (+15%) | 10mo | $120,000 | $69 | 43 |
| 5 Barton Dr | 0.60mi | 3/1.5 (-1) | 1,361 (-10%) | 11mo | $200,000 | $147 | 41 |
Match score weights: distance 35% · size 25% · config 20% · recency 20%. Top-matched comps best support the ARV.
Projected returns pro-forma
-3.0% appreciation · 3.86% rent growth · sell at horizon
- IRR
- 9.2%
- Equity multiple
- 1.37×
- Total profit
- $13,882
- Equity at exit
- $20,129
- IRR
- 19.1%
- Equity multiple
- 2.65×
- Total profit
- $62,330
- Equity at exit
- $11,672
Cash invested: $37,800 (down + closing). Projections, not guarantees.
Landlord ↔ Tenant lean methodology
- Overall (STATE)
- 62 Landlord-Friendly
- State Pennsylvania
- 62 Landlord-Friendly · EVEN
- County
- — inherits STATE
- City
- — inherits STATE
ZIP-level market 15221
- Home prices YoY
- -32.3%
- Rents YoY
- 3.9%
- Active inventory
- 118
- Price-to-rent
- 6.6×
Monthly cashflow live
- Estimated rent
- $1,716 high interval (Pro) →
- Mortgage (P&I)
- −$708
- Tax from tax record
- −$52 /mo · $630/yr
- Insurance
- −$56
- HOA
- −$0
- Vacancy / Maint / Mgmt
- −$360
- Net cashflow
- $539
Break-even live
UW: 25.0% down · 7.5% · 30yr · 1.5% tax · 5.0% vac · 8.0% maint · 8.0% mgmt
Financing live
Cash to close
- Down payment
- $33,750
- Closing costs
- $4,050
- Reserves months
- —
- Total cash needed
- —
Loan-product check · same deal, 3 products live
Conventional
25% down · 7.5% · 30yr
- Down + closing
- —
- Monthly P&I
- —
- Monthly cashflow
- —
- DSCR
- —
- Eligible?
- —
Personal DTI + credit; lowest rate.
DSCR
20% down · 8.5% · 30yr
- Down + closing
- —
- Monthly P&I
- —
- Monthly cashflow
- —
- DSCR
- —
- Eligible?
- —
No personal income docs; deal must DSCR.
Hard money
10% down · 12.0% · 12mo
- Down + closing
- —
- Monthly P&I
- —
- Monthly cashflow
- —
- DSCR
- —
- Eligible?
- —
Short-term bridge; refi at stabilization.
Rent comps 16 comps
| Address | Beds | Baths | Sqft | Rent | $/sqft | DOM | Units | Dist |
|---|---|---|---|---|---|---|---|---|
| 1148 East St Pittsburgh, PA | 3.0 | 3.0 | 1738 | $1,700 | $0.98 | 43d | 1 | 0.26mi |
| 1962 McNary Blvd Pittsburgh, PA | 3.0 | 1.0 | 1517 | $1,545 | $1.02 | 7d | 1 | 0.47mi |
| 565 Ardmore Blvd Pittsburgh, PA | 4.0 | 1.0 | 1368 | $1,450 | $1.06 | 10d | 1 | 0.56mi |
| 2031 Chalfant St Pittsburgh, PA | 3.0 | 1.5 | 1150 | $1,950 | $1.70 | 43d | 1 | 0.59mi |
| 745 Franklin Ave Pittsburgh, PA | 4.0 | 2.0 | 1948 | $1,599 | $0.82 | 43d | 1 | 0.77mi |
| 515 Hill Ave Pittsburgh, PA | 4.0 | 1.0 | 1628 | $1,300 | $0.80 | 43d | 1 | 0.82mi |
| 8918 Frankstown Rd Pittsburgh, PA | 3.0 | 1.0 | 1400 | $1,907 | $1.36 | 14d | 1 | 1.16mi |
| 8606 Westwood Rd Pittsburgh, PA | 4.0 | 1.0 | 1596 | $1,425 | $0.89 | 43d | 1 | 1.18mi |
| 519-521 S Trenton Ave Pittsburgh, PA | 3.0 | 1.5 | 1360 | $2,600 | $1.91 | 16d | 1 | 1.19mi |
| 407 Biddle Ave #3 Pittsburgh, PA | 3.0 | 1.0 | 1200 | $1,700 | $1.42 | 43d | 1 | 1.22mi |
| 648 Southern Ave Penn Hills, PA | 3.0 | 1.0 | 1100 | $1,600 | $1.45 | 7d | 1 | 1.28mi |
| 700 Filmore Rd Pittsburgh, PA | 3.0 | 2.0 | 1072 | $1,800 | $1.68 | 12d | 1 | 1.35mi |
| 1250 Blackadore Ave Pittsburgh, PA | 3.0 | 1.0 | 1440 | $1,750 | $1.22 | 23d | 1 | 1.36mi |
| 610 Churchill Ave Pittsburgh, PA | 3.0 | 1.0 | 1100 | $1,395 | $1.27 | 2d | 1 | 1.39mi |
| 3005 Laketon Rd Pittsburgh, PA | 3.0 | 1.0 | 1100 | $1,295 | $1.18 | 14d | 1 | 1.39mi |
| 2210 Hampton St Pittsburgh, PA | 3.0 | 1.5 | 1512 | $1,650 | $1.09 | 23d | 1 | 1.44mi |
Listing history 21 events
-
2026-06-18days on market $135,000 Active 50 DOM
-
2026-06-17days on market $135,000 Active 49 DOM
-
2026-06-16days on market $135,000 Active 48 DOM
-
2026-06-15days on market $135,000 Active 47 DOM
-
2026-06-13days on market $135,000 Active 45 DOM
-
2026-06-09days on market $135,000 Active 41 DOM
-
2026-06-08days on market $135,000 Active 40 DOM
-
2026-06-07days on market $135,000 Active 39 DOM
-
2026-06-05days on market $135,000 Active 36 DOM
-
2026-06-03days on market $135,000 Active 35 DOM
-
2026-06-02days on market $135,000 Active 34 DOM
-
2026-06-01days on market $135,000 Active 33 DOM
-
2026-05-31days on market $135,000 Active 32 DOM
-
2026-04-29$135,000 Active
-
2025-06-06$135,900 Active
-
2007-05-10soldstatus $8,900
Show marketing remark (177 chars)
As Is Cond, Subj to Corp Approval, Spec Warr Deed, Spec Corp Addenda, Must PreQual Buyer, Buyer makes own Inspects+Dye+Lien Certs, List Off Holds H/M, Call for Title Report info
-
2007-02-11$8,900
Show marketing remark (177 chars)
As Is Cond, Subj to Corp Approval, Spec Warr Deed, Spec Corp Addenda, Must PreQual Buyer, Buyer makes own Inspects+Dye+Lien Certs, List Off Holds H/M, Call for Title Report info
-
2002-05-07soldstatus $36,000
-
2002-04-29soldstatus $36,000
-
2001-08-16$39,900
-
1991-08-22soldstatus $13,000
ⓘ Source: listings_history table (triggers on properties + properties_extension) + one-shot
backfill from property_details.listing_events for pre-trigger history.
Tax reassessment forecast PA · Partial reset (capped growth)
- Current annual tax
- $630 · $52/mo
- Projected year-2 tax
- $1,381 · $115/mo
- Expected delta
- +$752/yr (+$63/mo · 119.4%)
ⓘ Screening estimate from a state-policy table — verify with the county assessor before closing.
Climate risk First Street
- Flood 1/10 Low FEMA zone X (unshaded) · 0% chance over 30 yrs
- Wildfire 1/10 Low
- Heat 3/10 Moderate 7 d/yr ≥96°F today · 16 d/yr by 30 yrs out
- Wind 2/10 Low
- Air quality 4/10 Moderate 4 unhealthy d/yr today · 5 by 30 yrs out
Nearby sold comps map
Loading sold comps map…
Walkable amenities ~0.75 mi
Loading nearby amenities…
Taxation est. · year 1
- Rental income
- $20,587
- − Mortgage interest
- −$7,562
- − Property taxes
- −$630
- − Insurance
- −$675
- − Repairs & maintenance
- −$1,647
- − Management
- −$1,647
- − Depreciation
- −$3,927
- Taxable income
- $4,499
- Est. tax owed @ 24.0%
- −$1,080
- After-tax cash flow
- $5,384/yr
For passive investors: Depreciation is non-cash, so a rental often shows a tax loss while cash-flowing — sheltering income. Rental losses are passive: they offset passive income freely, and up to $25,000/yr can offset ordinary (W-2) income if you actively participate and your MAGI is under $100k (phasing out to $0 by $150k); unused losses carry forward. On sale, claimed depreciation is recaptured at up to 25%, and gains may owe capital-gains tax (a 1031 exchange can defer both). Figures are a year-1 estimate at your 24.0% rate — not tax advice; consult a CPA.
Schools (NCES district)
- District
- Wilkinsburg Borough SD
- NCES district ID
- 4226370
- Math proficiency
- 14% ▼ -8.00%
- Reading proficiency
- 23% ▼ -9.00%
- Median HH income
- $32,204
- Composite
- 14.94/100
- National rank
- #9368
- State rank
- #503 of 539 in PA
Livability — Wilkinsburg
- Score
- 76/100
- State rank
- #411
- US rank
- #3754
Category grades
Schools grade is shown separately in the Schools card above.
Census & demographics
- Census place
- Wilkinsburg, PA
- County
- Allegheny County · 1,022,028 people
- City population
- 29,513
- Metro
- Pittsburgh, PA
- Population (ZIP)
- 29,374
- Household income
- $55,028
- Rent vs Own
- Severe rent burden
- 1933.0
Population outlook (Allegheny County) Hauer SSP2
- Today (2025)
- 1,250,282 people
- By 2030
- 1,256,482 · +0.5%
- By 2040
- 1,256,318 · +0.5%
- By 2050
- 1,244,169 · -0.5%
- By 2075
- 1,197,693 · -4.2%
- By 2100
- 1,093,187 · -12.6%
Race, ethnicity, and origin ACS 2023
- Neighborhood character
- Diverse neighborhood (Simpson 0.60)
- Race & ethnicity
- White 47% Black 43% Two or more races 7% Hispanic / Latino 4% Asian 1%
- Common ancestry
- Romanian 4% Lithuanian 2% Serbian 1%
- Foreign-born
- 4% · Canada, South Korea, China
- Languages at home
- 93% English-only · Spanish 2% French/Haitian/Cajun 1% Other Indo-European 1%
Political lean MEDSL · Allegheny
- 2024 margin
- Strong D (+20.3) · D 59.7% · R 39.4%
- 2008→2024 swing
- +4.8pp toward D · 2008: 15.5pp · 2024: 20.3pp
- All cycles
- 2024: D+20.3 2020: D+20.4 2016: D+16.4 2012: D+14.4 2008: D+15.5
Not yet ingested
- Civics
- —
Market trends
- HPI YoY
- ▼ -109.77%
- Current HPI
- 230.0486
- Rent YoY
- ▲ 3.86%
- Metro
- Pittsburgh, PA
- State GDP YoY
- ▲ 1.68%
- F500 in state
- 34
Industry mix (Fortune 500 HQ in PA)
| Industry | F500 HQs | Revenue |
|---|---|---|
| Healthcare | 2 | $309B |
|
||
| Insurance | 2 | $27B |
|
||
| Telecommunications / Media | 1 | $124B |
|
||
| Industrial Distribution | 1 | $22B |
|
||
| Financial Services | 1 | $20B |
|
||
| Chemicals / Materials | 1 | $18B |
|
||
Price history
+938.5% since first listed8 events — show timeline
- 2026-04-29 Listed $135,000 West Penn MLS
- 2025-06-06 Listed $135,900 West Penn MLS
- 2007-05-10 Sold (MLS) $8,900 West Penn MLS
- 2007-02-11 Listed $8,900 West Penn MLS
- 2002-05-07 Sold (Public Records) $36,000 Public Records
- 2002-04-29 Sold (MLS) $36,000 West Penn MLS
- 2001-08-16 Listed $39,900 West Penn MLS
- 1991-08-22 Sold (Public Records) $13,000 Public Records
Property tax history
-0.6%/yrLatest (2026): $630 · +3.0% YoY. Source: county tax records.
Cash-flow waterfall
monthlySold comps — $/sqft
last 12 mo · ≤1 miLoading sold comps…