 🏗️ New Construction
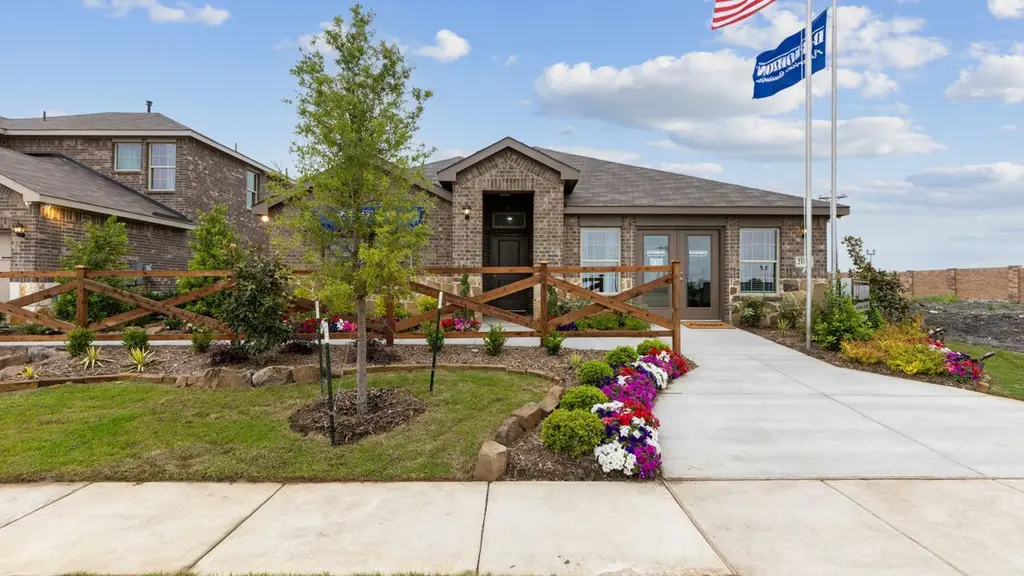
TEXAS CALI Plan · Crandall, TX
Flood risk No data
- FEMA flood zone
- —
- Chance of flooding over 30 yrs
- —
- Est. flood insurance / yr
- —
Fire risk No data
- Est. fire insurance / yr
- —
Heat risk No data
- Hot days now (above threshold)
- —
- Hot days in 30 yrs
- —
Wind risk No data
- Chance of severe wind over 30 yrs
- —
Air-quality risk No data
- Unhealthy air days now
- —
- Unhealthy air days in 30 yrs
- —
Risk factors via First Street. Map © Google.
Why this score? — see what drove the D grade
The composite is a weighted blend of 9 inputs, each scored 0–100. Each bar is that input's sub-score; the figure is the points it added to the 100-point composite (weight × sub-score).
- Cash flow +14.8/30.0
- ARV discount +7.5/15.0
- DSCR +4.5/10.0
- 1% rule +4.1/10.0
- Condition / age +4.0/5.0
- Schools +3.6/10.0
- Livability +3.4/5.0
- Rent growth +2.5/5.0
- Appreciation +0.0/10.0
$291,490
🖨 Deal sheet 📄 Offer letter ✓ Due diligence
Listing remarks
This home plan can feature a professionally landscaped front yard with a lighted front porch and back patio. Enjoy the gourmet kitchen plus the large bedroom suite with an ensuite that includes a 5-foot shower, chrome faucets and a mirror over full length of vanity. Home an energy efficient heating and cooling system per community guidelines and weather stripping around exterior doors. Bonus features include attic pull downstairs, one access. Photos shown here may not depict the specified home and features. Elevations, exterior/ interior colors, options, available upgrades, and standard features will vary in each community and may change without notice. May include options, elevations, and
Key facts
- Chrome faucets
- Lighted front porch
- Gourmet kitchen
Tags
Property features AI
Finance
- Other: Listing status: Active
- Financial info: List price $291,490
Exterior
- Parking: 2 total parking spaces; 2-car garage
- Home design: New construction plan named TEXAS CALI; Plan inventory type
- Exterior features: Property located in Crandall, TX (Call for exact address)
Interior
- Bedrooms: 4 bedrooms
- Bathrooms: 2 full bathrooms
- Interior features: Living area approximately 1864 square feet
Neighborhood map
What this means for you Summary
Snapshot
- This is a 4-bed/2.0-bath single-family listed at $291k. Condition is rated good.
Deal economics
- At list price, monthly cash flow is $76 ($907/yr) — positive.
- The deal already cash-flows at list — no discount required.
- To meet the 1% rule (rent ≥ 1% of price), the offer needs to be $256k (12.2% below list).
- Recommended offer: $256k (12.2% below list) — sets the bar for 1% rule.
- Cap rate 6.6% vs local median 5.3% in Crandall — meaningfully above typical; check what's discounted (condition, days-on-market, listing class) to confirm the premium yield is real.
Location & tenants
- Location reads 68/100 on livability (#507 in TX) — a middle-class / working-renter tenant base. Strengths: employment A+, cost of living A+, housing A+; Watch: crime F, amenities F, commute F.
- Crandall ISD (rural): math 36% / reading 42% proficiency, ranked #351 of 826 in TX (top 42%) — families likely to look elsewhere, expect single-tenant / working-renter base with shorter leases.
- Market conditions: 787 active listings in the ZIP; 4 comparable units currently listed for rent nearby; rentals at typical pace (median 25d on market — plan ~3-4 weeks tenant-placement turnaround); solid renter incomes; 1,747 units permitted in Kaufman County in 2024 (180 in 5+ unit buildings).
- This rent runs 35% of the median local income ($88k/yr) — at the standard rent-burdened threshold; future hikes will face affordability resistance.
Forward outlook
- Local home prices are declining (-3.0%/yr); year-one equity from $2k of loan paydown is wiped out by about $8k of value loss. Plan a longer hold.
- Kaufman County population projected at +43% by 2050 — long-run rental-demand tailwind backs the buy-and-hold thesis.
Negotiation context
- Only 5 days on market — expect competitive offers; lowballing is unlikely to land.
Questions for the listing agent
- Is there a deadline driving the sale (1031 exchange, divorce, estate, relocation)? That informs how much negotiation room exists.
- Schools are B-rated — typically a magnet for longer-tenancy family renters. What's the average tenant stay here, and is there a school-zone premium baked into asking?
- Crime grade is F in this area — have there been break-ins, vandalism, or insurance claims at this property in the last 3 years? What carrier currently insures it and at what premium?
- The area grade is low — what's the realistic commute time and amenity access for the typical tenant pool here? Any planned neighborhood developments (good or bad) we should know about?
- What's the average days-on-market for RENTAL listings here right now (not sales)? A rising rental-DOM trend means longer vacancies and softer asking-rent achievability than the comps imply.
- What's the recent tenant-quality profile in this submarket — average credit score on applications, eviction rate, late-payment / NSF rate, and stable-employment percentage? A property-management company in the area should have these aggregated.
- How much new for-sale + rental construction is in the pipeline within 1–3 miles? Heavy new supply typically softens prices + rents 12–24 months out; constrained supply supports both.
Investment metrics
- 1% rule
- 0.91% ✗
- Cap rate
- 6.62%
- Cash-on-cash
- 1.15%
- DSCR
- 1.05
- GRM
- 9.2
CMA / ARV
- ARV (on-the-fly)
- $281,464
- Comps found
- 12
Show comp detail 12 sales within ~0.75 mi
| Address | Dist | Beds/Ba | Sqft | Sold | Price | $/sf | Match |
|---|---|---|---|---|---|---|---|
| 2307 Albert Ln | 0.04mi | 4/3.0 | 2,088 (+12%) | 2mo | $315,490 | $151 | 73 |
| 1318 Olivewood Pl | 0.31mi | 3/2.5 (-1) | 1,931 (+4%) | 1mo | $279,990 | $145 | 72 |
| 3103 Kleinbrook Way | 0.35mi | 4/2.0 | 1,760 (-6%) | 3mo | $271,174 | $154 | 72 |
| 3145 Maplehurst Ave | 0.42mi | 4/2.0 | 1,760 (-6%) | 1mo | $237,599 | $135 | 70 |
| 3165 Maplehurst Ave | 0.46mi | 4/2.0 | 1,760 (-6%) | 1mo | $260,999 | $148 | 69 |
| 3175 Maplehurst Ave | 0.48mi | 4/2.0 | 1,760 (-6%) | 0mo | $251,499 | $143 | 68 |
| 3134 Maplehurst Ave | 0.39mi | 4/2.0 | 1,720 (-8%) | 2mo | $234,499 | $136 | 68 |
| 3141 Maplehurst Ave | 0.41mi | 4/2.0 | 1,720 (-8%) | 2mo | $243,499 | $142 | 66 |
| 2131 Thornton Dr | 0.14mi | 3/2.0 (-1) | 1,614 (-13%) | 4mo | $271,990 | $169 | 63 |
| 1427 Canongate Dr | 0.34mi | 3/2.0 (-1) | 1,604 (-14%) | 3mo | $256,490 | $160 | 53 |
| 1256 Barkridge St | 0.39mi | 3/2.0 (-1) | 1,604 (-14%) | 3mo | $256,490 | $160 | 51 |
| 1463 Canongate Dr | 0.41mi | 3/2.0 (-1) | 1,604 (-14%) | 4mo | $256,490 | $160 | 50 |
Match score weights: distance 35% · size 25% · config 20% · recency 20%. Top-matched comps best support the ARV.
Projected returns pro-forma
-3.0% appreciation · 3.0% rent growth · sell at horizon
- IRR
- -14.4%
- Equity multiple
- 0.48×
- Total profit
- $-40,756
- Equity at exit
- $41,967
- IRR
- -5.7%
- Equity multiple
- 0.63×
- Total profit
- $-29,134
- Equity at exit
- $24,336
Cash invested: $78,810 (down + closing). Projections, not guarantees.
Landlord ↔ Tenant lean methodology
- Overall (STATE)
- 87 Strongly Landlord-Friendly
- State Texas
- 87 Strongly Landlord-Friendly · R+5
- County
- — inherits STATE
- City
- — inherits STATE
ZIP-level market 75114
- Home prices YoY
- -26.7%
- Active inventory
- 787
- Price-to-rent
- 9.5×
Monthly cashflow live
- Estimated rent
- $2,558 medium interval (Pro) →
- Mortgage (P&I)
- −$1,476
- Tax est. 1.5%
- −$352 /mo · $4,222/yr
- Insurance
- −$117
- HOA
- −$0
- Vacancy / Maint / Mgmt
- −$537
- Net cashflow
- $76
Break-even live
UW: 25.0% down · 7.5% · 30yr · 1.5% tax · 5.0% vac · 8.0% maint · 8.0% mgmt
Financing live
Cash to close
- Down payment
- $70,366
- Closing costs
- $8,444
- Reserves months
- —
- Total cash needed
- —
Loan-product check · same deal, 3 products live
Conventional
25% down · 7.5% · 30yr
- Down + closing
- —
- Monthly P&I
- —
- Monthly cashflow
- —
- DSCR
- —
- Eligible?
- —
Personal DTI + credit; lowest rate.
DSCR
20% down · 8.5% · 30yr
- Down + closing
- —
- Monthly P&I
- —
- Monthly cashflow
- —
- DSCR
- —
- Eligible?
- —
No personal income docs; deal must DSCR.
Hard money
10% down · 12.0% · 12mo
- Down + closing
- —
- Monthly P&I
- —
- Monthly cashflow
- —
- DSCR
- —
- Eligible?
- —
Short-term bridge; refi at stabilization.
Rent comps 4 comps
| Address | Beds | Baths | Sqft | Rent | $/sqft | DOM | Units | Dist |
|---|---|---|---|---|---|---|---|---|
| 2307 Albert Ln Crandall, TX | 4.0 | 3.0 | 2088 | $2,500 | $1.20 | 24d | 1 | 0.04mi |
| 1322 Olivewood Pl Crandall, TX | 3.0 | 2.0 | 1458 | $2,100 | $1.44 | 7d | 1 | 0.31mi |
| 505 S 5th St Crandall, TX | 3.0 | 2.0 | 1360 | $1,900 | $1.40 | 44d | 1 | 1.23mi |
| 107 Haymeadow Dr Crandall, TX | 3.0 | 2.0 | 1746 | $2,150 | $1.23 | 1d | 1 | 1.46mi |
Listing history 6 events
-
2026-06-18days on market $291,490 Active 5 DOM
-
2026-06-17days on market $291,490 Active 4 DOM
-
2026-06-16days on market $291,490 Active 3 DOM
-
2026-06-15days on market $291,490 Active 2 DOM
-
2026-06-13remarks 699-char remark
-
2026-06-13$291,490 Active 1 DOM
ⓘ Source: listings_history table (triggers on properties + properties_extension) + one-shot
backfill from property_details.listing_events for pre-trigger history.
Nearby sold comps map
Loading sold comps map…
Walkable amenities ~0.75 mi
Loading nearby amenities…
Taxation est. · year 1
- Rental income
- $30,695
- − Mortgage interest
- −$15,766
- − Property taxes
- −$4,222
- − Insurance
- −$1,407
- − Repairs & maintenance
- −$2,456
- − Management
- −$2,456
- − Depreciation
- −$8,188
- Taxable loss
- −$3,800
- Est. tax savings @ 24.0%
- +$912
- After-tax cash flow
- $1,819/yr
For passive investors: Depreciation is non-cash, so a rental often shows a tax loss while cash-flowing — sheltering income. Rental losses are passive: they offset passive income freely, and up to $25,000/yr can offset ordinary (W-2) income if you actively participate and your MAGI is under $100k (phasing out to $0 by $150k); unused losses carry forward. On sale, claimed depreciation is recaptured at up to 25%, and gains may owe capital-gains tax (a 1031 exchange can defer both). Figures are a year-1 estimate at your 24.0% rate — not tax advice; consult a CPA.
Condition & rehab AI · 12 photos
This home is in excellent condition with a good condition score of 80. It features a modern kitchen, good bathrooms, a new roof, and a well-maintained exterior. The home is move-in ready and has a good resale and rental value.
Value-add opportunities
- Both Landscaping and curb appeal improvements — Enhances the home's curb appeal and can attract more buyers or renters.
- Both Painting exterior and interior walls — Fresh paint can make the home look more inviting and maintain its value.
- Both Add smart home features — Modernizes the home and can increase its value in the current market.
Renovation cost estimate screening
Value-add ROI direction
- Both Landscaping and curb appeal improvements — Enhances the home's curb appeal and can attract more buyers or renters. ↑
- Both Painting exterior and interior walls — Fresh paint can make the home look more inviting and maintain its value. ↑
- Both Add smart home features — Modernizes the home and can increase its value in the current market. ↑
ⓘ Cost ranges are severity-bucket heuristics (US national rule-of-thumb). Get contractor quotes + a written scope before underwriting a rehab budget.
Schools (NCES district)
- District
- Crandall ISD
- NCES district ID
- 4815510
- Math proficiency
- 36% ▼ -13.00%
- Reading proficiency
- 42% ▼ -8.00%
- Median HH income
- $70,076
- Composite
- 35.57/100
- National rank
- #4901
- State rank
- #351 of 826 in TX
Livability — Crandall
- Score
- 68/100
- State rank
- #507
- US rank
- #10022
Category grades
Schools grade is shown separately in the Schools card above.
Census & demographics
- Census place
- Crandall, TX
- County
- Kaufman County · 122,338 people
- City population
- 9,333
- Metro
- Dallas-Fort Worth-Arlington, TX
- Population (ZIP)
- 9,333
- Household income
- $88,013
- Rent vs Own
- Severe rent burden
- 33.0
Population outlook (Kaufman County) Hauer SSP2
- Today (2025)
- 138,716 people
- By 2030
- 150,815 · +8.7%
- By 2040
- 174,877 · +26.1%
- By 2050
- 198,020 · +42.8%
- By 2075
- 251,908 · +81.6%
- By 2100
- 285,325 · +105.7%
Race, ethnicity, and origin ACS 2023
- Neighborhood character
- Diverse neighborhood (Simpson 0.62)
- Race & ethnicity
- White 48% Hispanic / Latino 36% Two or more races 14% Black 14%
- Hispanic origin (detail)
- Mexican 34%
- Common ancestry
- Slovak 1%
- Foreign-born
- 18% · Canada, China
- Languages at home
- 71% English-only · Spanish 27% Other Indo-European 1%
Political lean MEDSL · Kaufman
- 2024 margin
- Strong R (+27.9) · D 35.6% · R 63.5%
- 2008→2024 swing
- +7.9pp toward D · 2008: -35.8pp · 2024: -27.9pp
- All cycles
- 2024: R+27.9 2020: R+33.9 2016: R+47.0 2012: R+44.4 2008: R+35.8
Not yet ingested
- Civics
- —
Market trends
- HPI YoY
- ▼ -71.61%
- Current HPI
- 196.4773
- Rent YoY
- —
- Metro
- Dallas-Fort Worth-Arlington, TX
- State GDP YoY
- ▲ 3.95%
- F500 in state
- 110
Industry mix (Fortune 500 HQ in TX)
| Industry | F500 HQs | Revenue |
|---|---|---|
| Energy | 16 | $1,198B |
|
||
| Technology | 5 | $198B |
|
||
| Engineering / Construction | 4 | $72B |
|
||
| Energy Services | 3 | $60B |
|
||
| Utilities | 3 | $41B |
|
||
| Healthcare | 2 | $330B |
|
||
Cash-flow waterfall
monthlySold comps — $/sqft
last 12 mo · ≤1 miLoading sold comps…