 Duplex
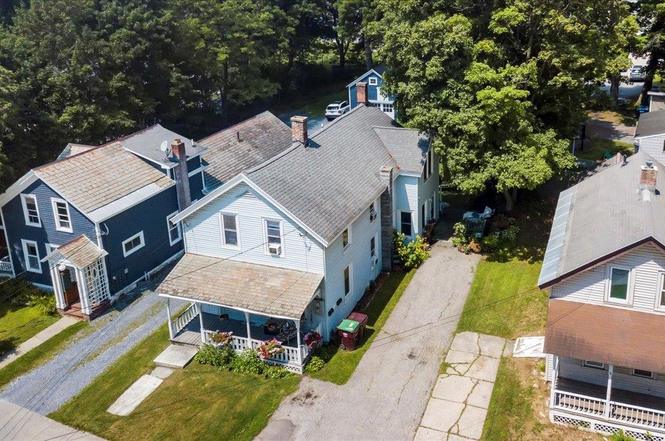
254 Union St · Bennington, VT
Flood risk 8/10 · Major
- FEMA flood zone
- X (shaded)
- Chance of flooding over 30 yrs
- 0.99%
- Est. flood insurance / yr
- $473 – $860
Fire risk 1/10 · Minimal
- Est. fire insurance / yr
- $480 – $892
Heat risk 2/10 · Minimal
- Hot days now (above 92°F)
- 7 days/yr
- Hot days in 30 yrs
- 16 days/yr
Wind risk 3/10 · Minor
- Chance of severe wind over 30 yrs
- 7.0%
Air-quality risk 2/10 · Minimal
- Unhealthy air days now
- 0 days/yr
- Unhealthy air days in 30 yrs
- 1 days/yr
Risk factors via First Street. Map © Google.
Why this score? — see what drove the C grade
The composite is a weighted blend of 9 inputs, each scored 0–100. Each bar is that input's sub-score; the figure is the points it added to the 100-point composite (weight × sub-score).
- Cash flow +27.1/30.0
- DSCR +9.4/10.0
- 1% rule +6.5/10.0
- Schools +5.0/10.0
- Livability +3.2/5.0
- Rent growth +2.5/5.0
- Condition / age +2.5/5.0
- ARV discount +0.3/15.0
- Appreciation +0.0/10.0
$295,000
🖨 Deal sheet 📄 Offer letter ✓ Due diligence
Multi-family units
County records classify this as Multi-Family (2-4 Unit). Listing-text estimate: 2 units. confirmed
Listing remarks
Welcome to this well-maintained, solid income-producing two-family home located in the heart of town—just steps from shops, dining, and downtown events. Perfect for owner-occupants or savvy investors, this property combines classic charm with modern efficiency and low operating costs. Each two-bedroom unit features spacious, light-filled living areas, eat-in kitchen and comfortable bedrooms. Recent energy-efficient upgrades include newer windows, oil tank, insulation, and high-efficiency heating system, helping to keep utility expenses low while enhancing year-round comfort. The property offers separate utilities, off-street parking, private outdoor space, and a strong rental history
Key facts
- Separate utilities
- Off street parking
- 5,662 sq ft lot
Tags
Property features AI
Finance
- Financial info: Net income reported: $26,060; Operating expenses include heat, trash, water/sewer and other expenses
Exterior
- Parking: Paved driveway parking
- Utilities: Public water on-site; Public sewer on-site; 200 Amp electrical service; Cable and high-speed internet available, including fiber optic and cable internet; Trash service handled by owner
- Home design: Freestanding multi-family, multi-level building; Existing construction
- Construction: Built in 1900; Vinyl siding; Architectural/asphalt shingle roof; Foundation details not provided
- Exterior features: Interior, level lot in town with sidewalks, street lights, and neighborhood setting; Paved driveway; Public road frontage (public maintained, paved)
Interior
- Kitchen: Each unit includes an electric range and refrigerator
- Bedrooms: Two 2-bedroom units (one on level 1, one on level 2)
- Flooring: Carpet, laminate, tile, and vinyl plank flooring
- Bathrooms: Two full bathrooms (one in each unit)
- Heating & cooling: Oil-fired baseboard heating; No central air conditioning
- Interior features: Unfinished walk-up basement with exterior bulkhead and exterior stairs; basement is dirt floor with no tenant access
- Laundry & utility: Each unit has laundry hookups; Oil heating provided; heat included for units
Neighborhood map
What this means for you Summary
Snapshot
- This is a 2 × 2-bed/1.0-bath units multifamily listed at $295k.
Deal economics
- At list price, monthly cash flow is $777 ($9k/yr) — positive. Per door: $388/mo.
- The deal already cash-flows at list — no discount required.
- Meets the 1% rule at list price ($3k rent vs $295k).
- Recommended offer: $260k (12.0% below list) — sets the bar for market timing.
- Cap rate 9.7% vs local median 5.4% in Bennington — top-decile yield for the area; either an underpriced asset or a hidden risk that comps aren't pricing in. Stress-test before assuming the spread holds.
Location & tenants
- Location reads 64/100 on livability (#63 in VT) — a middle-class / working-renter tenant base. Strengths: housing A+, health & safety A+, cost of living A; Watch: employment C-, crime D, schools F.
- Market conditions: 65 active listings in the ZIP; 59 units permitted in Bennington County in 2024 (0 in 5+ unit buildings).
- At $3,401/mo this rent would consume 68% of the median local household income ($60k/yr) (locally 982% of renters already pay >50% of income on rent) — very limited rent-growth headroom before tenants either downsize or default.
Forward outlook
- Local home prices are declining (-3.0%/yr); year-one equity from $2k of loan paydown is wiped out by about $9k of value loss. Plan a longer hold.
- Bennington County population projected at -23% by 2050 — secular population decline; favor cash flow + early exit over multi-decade hold.
- At projected returns (-3.0% appreciation + 3.0% rent growth), your $83k cash investment doubles in ~10 years — after that, you're playing with house money.
Negotiation context
- It's been on market 318 days — a 12% lower offer ($260k) is reasonable based on typical stale-listing flexibility.
- Current owner paid $50k; list at $295k implies a 490% gain — meaningful room to come down on a strong offer.
Risks & watch-outs
- Watch-outs: flood insurance adds $56/mo; built in 1900 — expect roof / HVAC / electrical / plumbing capex.
- Climate carrying-cost: severe flood risk — expect insurance premiums to compound above CPI over the hold.
Questions for the listing agent
- It's been on market 318 days. Have you received any prior offers? Is the seller open to a 12% concession, seller financing, or rate buy-down credit?
- Can we see the unit-by-unit rent roll, current vacancy, and any below-market leases? What's the average tenancy length?
- What capital expenditures (roof, boiler, parking lot, exteriors) have been made in the last 5 years, and what's planned in the next 2?
- Built in 1900 — when were the roof, HVAC, electrical panel, plumbing, and water heater last replaced?
- What's the actual annual flood-insurance premium (NFIP or private), and is the property in a SFHA with mandatory coverage?
- Why hasn't it sold? Are there any deal-killer items the seller is aware of (foundation, flood, title, zoning, code violations)?
- Is there a deadline driving the sale (1031 exchange, divorce, estate, relocation)? That informs how much negotiation room exists.
- Schools are F-rated, which usually means shorter tenancies and higher turnover. Who's the typical renter profile here, and what's been the actual vacancy rate?
- Crime grade is D in this area — have there been break-ins, vandalism, or insurance claims at this property in the last 3 years? What carrier currently insures it and at what premium?
- What's the average days-on-market for RENTAL listings here right now (not sales)? A rising rental-DOM trend means longer vacancies and softer asking-rent achievability than the comps imply.
- What's the recent tenant-quality profile in this submarket — average credit score on applications, eviction rate, late-payment / NSF rate, and stable-employment percentage? A property-management company in the area should have these aggregated.
- How much new apartment / multifamily construction is in the pipeline within 1–3 miles? Heavy new supply (>2% of stock underway) typically softens rents 12–24 months out; light construction supports rent growth.
Investment metrics
- 1% rule
- 1.15% ✓
- Cap rate
- 9.68%
- Cash-on-cash
- 12.09%
- DSCR
- 1.54
- GRM
- 7.2
CMA / ARV
- ARV (on-the-fly)
- $254,464
- Comps found
- 5
Show comp detail 5 sales within ~0.75 mi
| Address | Dist | Beds/Ba | Sqft | Sold | Price | $/sf | Match |
|---|---|---|---|---|---|---|---|
| 209 Grove St | 0.39mi | 4/2.0 | 1,652 (-8%) | 1mo | $235,000 | $142 | 68 |
| 216 Union St | 0.13mi | 4/3.0 | 1,887 (+5%) | 20mo | $62,000 | $33 | 64 |
| 215 School St | 0.34mi | 4/2.0 | 1,718 (-4%) | 23mo | $165,000 | $96 | 58 |
| 304-306 Grove St | 0.54mi | 5/3.0 (+1) | 1,810 (+1%) | 23mo | $291,000 | $161 | 44 |
| 330 School St | 0.55mi | 3/3.0 (-1) | 1,712 (-4%) | 24mo | $270,000 | $158 | 38 |
Match score weights: distance 35% · size 25% · config 20% · recency 20%. Top-matched comps best support the ARV.
Projected returns pro-forma
-3.0% appreciation · 3.0% rent growth · sell at horizon
- IRR
- 0.5%
- Equity multiple
- 1.02×
- Total profit
- $1,628
- Equity at exit
- $43,985
- IRR
- 10.2%
- Equity multiple
- 1.79×
- Total profit
- $64,991
- Equity at exit
- $25,506
Cash invested: $82,600 (down + closing). Projections, not guarantees.
Landlord ↔ Tenant lean methodology
- Overall (STATE)
- 41 Moderately Tenant-Leaning
- State Vermont
- 41 Moderately Tenant-Leaning · D+15
- County
- — inherits STATE
- City
- — inherits STATE
ZIP-level market 05201
- Home prices YoY
- -19.3%
- Active inventory
- 65
- Price-to-rent
- 14.5×
Monthly cashflow live
- Estimated rent
- $3,401 medium interval (Pro) →
- Mortgage (P&I)
- −$1,547
- Tax from tax record
- −$185 /mo · $2,217/yr
- Insurance
- −$123
- Flood insurance flood zone
- −$56 /mo · $666/yr
- HOA
- −$0
- Vacancy / Maint / Mgmt
- −$714
- Net cashflow
- $777
Break-even live
2-unit breakdown (identical units grouped — click to expand)
| Units | Beds | Baths | Est. rent |
|---|---|---|---|
| 2× units | 2 | 1 | $3,402 |
| #1 | 2 | 1 | $1,701 |
| #2 | 2 | 1 | $1,701 |
| Total (2 units) | $3,401 | ||
UW: 25.0% down · 7.5% · 30yr · 1.5% tax · 5.0% vac · 8.0% maint · 8.0% mgmt
Financing live
Cash to close
- Down payment
- $73,750
- Closing costs
- $8,850
- Reserves months
- —
- Total cash needed
- —
Loan-product check · same deal, 3 products live
Conventional
25% down · 7.5% · 30yr
- Down + closing
- —
- Monthly P&I
- —
- Monthly cashflow
- —
- DSCR
- —
- Eligible?
- —
Personal DTI + credit; lowest rate.
DSCR
20% down · 8.5% · 30yr
- Down + closing
- —
- Monthly P&I
- —
- Monthly cashflow
- —
- DSCR
- —
- Eligible?
- —
No personal income docs; deal must DSCR.
Hard money
10% down · 12.0% · 12mo
- Down + closing
- —
- Monthly P&I
- —
- Monthly cashflow
- —
- DSCR
- —
- Eligible?
- —
Short-term bridge; refi at stabilization.
Listing history 18 events
-
2026-06-19days on market $295,000 Active 318 DOM
-
2026-06-18days on market $295,000 Active 317 DOM
-
2026-06-17days on market $295,000 Active 316 DOM
-
2026-06-16days on market $295,000 Active 315 DOM
-
2026-06-15days on market $295,000 Active 314 DOM
-
2026-06-14days on market $295,000 Active 312 DOM
-
2026-06-12days on market $295,000 Active 311 DOM
-
2026-06-09days on market $295,000 Active 308 DOM
-
2026-06-08days on market $295,000 Active 307 DOM
-
2026-06-07days on market $295,000 Active 306 DOM
-
2026-06-07days on market $295,000 Active 305 DOM
-
2026-06-04days on market $295,000 Active 302 DOM
-
2026-06-02days on market $295,000 Active 301 DOM
-
2026-06-01days on market $295,000 Active 300 DOM
-
2026-05-31days on market $295,000 Active 299 DOM
-
2026-05-31days on market $295,000 Active 298 DOM
-
2025-08-05$295,000 Active
-
2008-08-29soldstatus $50,000
ⓘ Source: listings_history table (triggers on properties + properties_extension) + one-shot
backfill from property_details.listing_events for pre-trigger history.
Tax reassessment forecast VT · Partial reset (capped growth)
- Current annual tax
- $2,217 · $185/mo
- Projected year-2 tax
- $3,911 · $326/mo
- Expected delta
- +$1,694/yr (+$141/mo · 76.4%)
ⓘ Screening estimate from a state-policy table — verify with the county assessor before closing.
Climate risk First Street
- Flood 8/10 Severe FEMA zone X (shaded) · 99% chance over 30 yrs
- Wildfire 1/10 Low
- Heat 2/10 Low 7 d/yr ≥92°F today · 16 d/yr by 30 yrs out
- Wind 3/10 Moderate 7% chance of damaging wind over 30 yrs
- Air quality 2/10 Low 0 unhealthy d/yr today · 1 by 30 yrs out
Nearby sold comps map
Loading sold comps map…
Walkable amenities ~0.75 mi
Loading nearby amenities…
Taxation est. · year 1
- Rental income
- $40,812
- − Mortgage interest
- −$16,525
- − Property taxes
- −$2,217
- − Insurance
- −$2,142
- − Repairs & maintenance
- −$3,265
- − Management
- −$3,265
- − Depreciation
- −$8,582
- Taxable income
- $4,817
- Est. tax owed @ 24.0%
- −$1,156
- After-tax cash flow
- $8,162/yr
For passive investors: Depreciation is non-cash, so a rental often shows a tax loss while cash-flowing — sheltering income. Rental losses are passive: they offset passive income freely, and up to $25,000/yr can offset ordinary (W-2) income if you actively participate and your MAGI is under $100k (phasing out to $0 by $150k); unused losses carry forward. On sale, claimed depreciation is recaptured at up to 25%, and gains may owe capital-gains tax (a 1031 exchange can defer both). Figures are a year-1 estimate at your 24.0% rate — not tax advice; consult a CPA.
Schools (NCES district)
No district data.
Livability — Bennington
- Score
- 64/100
- State rank
- #63
- US rank
- #14446
Category grades
Schools grade is shown separately in the Schools card above.
Census & demographics
- Census place
- Bennington, VT
- County
- Bennington County · 14,998 people
- City population
- 14,998
- Metro
- Bennington, VT
- Population (ZIP)
- 14,998
- Household income
- $59,798
- Rent vs Own
- Severe rent burden
- 982.0
Population outlook (Bennington County) Hauer SSP2
- Today (2025)
- 34,407 people
- By 2030
- 32,975 · -4.2%
- By 2040
- 29,711 · -13.6%
- By 2050
- 26,638 · -22.6%
- By 2075
- 21,318 · -38.0%
- By 2100
- 16,086 · -53.2%
Race, ethnicity, and origin ACS 2023
- Neighborhood character
- Predominantly White (92%)
- Race & ethnicity
- White 92% Two or more races 4% Hispanic / Latino 3%
- Common ancestry
- Lithuanian 10% Slovak 7% Romanian 3%
- Foreign-born
- 2% · Canada
- Languages at home
- 96% English-only · Spanish 2% Other Indo-European 1%
Political lean MEDSL · Bennington
- 2024 margin
- Strong D (+22.5) · D 60.0% · R 37.5% · Other 2.6%
- 2008→2024 swing
- -10.9pp toward R · 2008: 33.4pp · 2024: 22.5pp
- All cycles
- 2024: D+22.5 2020: D+27.3 2016: D+22.1 2012: D+33.3 2008: D+33.4
Not yet ingested
- Civics
- —
Market trends
- HPI YoY
- ▼ -60.78%
- Current HPI
- 254.5149
- Rent YoY
- —
- Metro
- Bennington, VT
- State GDP YoY
- —
- F500 in state
- 0
Price history
+490.0% since first listed2 events — show timeline
- 2025-08-05 Listed $295,000 PrimeMLS
- 2008-08-29 Sold (Public Records) $50,000 Public Records
Property tax history
-3.0%/yrLatest (2024): $2,217 · +9.6% YoY. Source: county tax records.
Cash-flow waterfall
monthlySold comps — $/sqft
last 12 mo · ≤1 miLoading sold comps…