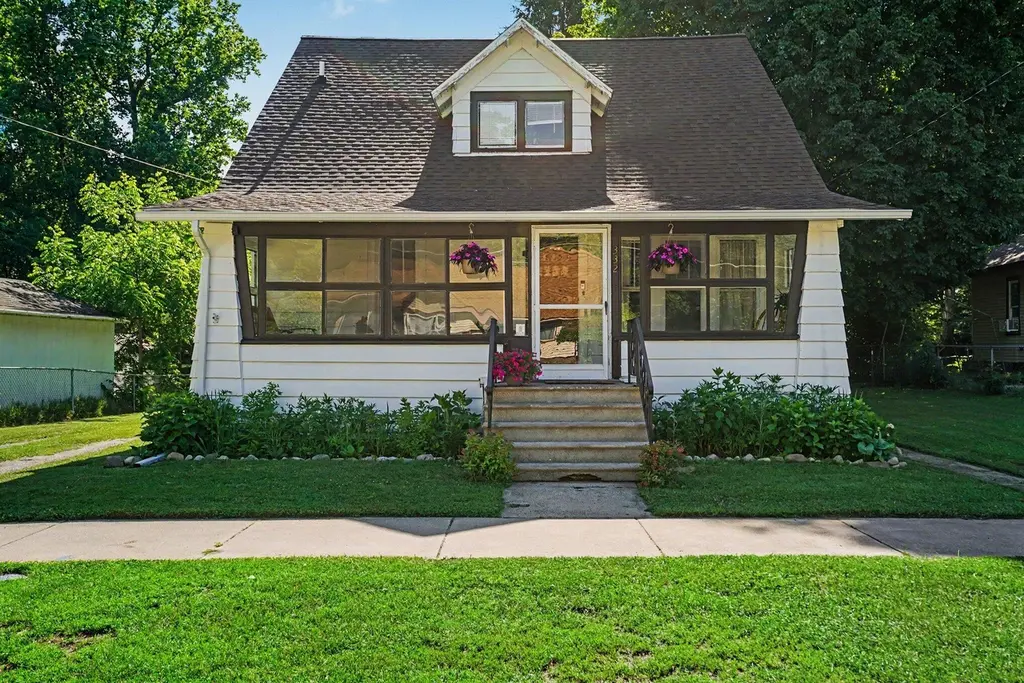
332 High View St · Watervliet, MI
Flood risk 1/10 · Minimal
- FEMA flood zone
- X (unshaded)
- Chance of flooding over 30 yrs
- 0.0%
- Est. flood insurance / yr
- $473 – $860
Fire risk 1/10 · Minimal
- Est. fire insurance / yr
- $784 – $1,456
Heat risk 2/10 · Minimal
- Hot days now (above 99°F)
- 7 days/yr
- Hot days in 30 yrs
- 15 days/yr
Wind risk 2/10 · Minimal
- Chance of severe wind over 30 yrs
- —
Air-quality risk 4/10 · Minor
- Unhealthy air days now
- 4 days/yr
- Unhealthy air days in 30 yrs
- 7 days/yr
Risk factors via First Street. Map © Google.
Why this score? — see what drove the D grade
The composite is a weighted blend of 9 inputs, each scored 0–100. Each bar is that input's sub-score; the figure is the points it added to the 100-point composite (weight × sub-score).
- Cash flow +19.5/30.0
- DSCR +6.2/10.0
- 1% rule +4.7/10.0
- Livability +3.5/5.0
- Schools +3.1/10.0
- Rent growth +2.5/5.0
- Condition / age +2.5/5.0
- ARV discount +0.0/15.0
- Appreciation +0.0/10.0
$210,000
🖨 Deal sheet 📄 Offer letter ✓ Due diligence
Listing remarks MLS
Loaded with charm and thoughtfully updated, this beautiful Craftsman-style home offers 3 bedrooms, 1 updated bathroom, and an inviting layout you'll love coming home to. The spacious main level features oversized living and dining rooms that flow seamlessly into the updated kitchen, complete with newer stainless steel appliances. A convenient main-floor bedroom provides flexibility for guests, a home office, or primary bedroom use. Recent improvements include newer vinyl plank flooring, roof, paint, furnace, air conditioner, water heater, and newly updated front and back porches, providing peace of mind for years to come. The updated bathroom features double vanities and abundant storage, combining style and functionality. Upstairs, you'll find two generously sized bedrooms with ample closet space. Outside, the fully fenced backyard offers the perfect setting for pets, play, gardening, or entertaining. With its blend of classic Craftsman character, modern updates, and spacious livingareas, this move-in-ready home is one you won't want to miss! Book your showing today. .. .. this one won't last!
Key facts
- 0.25 acre lot
- Garage
- Built 1921
Property features AI
Exterior
- Parking: Detached garage (1 car)
- Utilities: Public water; Natural gas connected; Cable connected; High-speed internet available
- Home design: Craftsman-style single family residence; Built in 1921
- Construction: Aluminum siding; Composition/shingle roof; Full basement
- Exterior features: Sidewalk; Paved road access
Interior
- Kitchen: Dishwasher; Range; Microwave; Refrigerator
- Bedrooms: Primary bedroom (approx. 12 x 11); Bedroom 2 (approx. 14 x 14); Bedroom 3 (approx. 14 x 11)
- Bathrooms: 1 full bathroom
- Heating & cooling: Forced air heating; Cooling system present
- Interior features: Pantry; Storm windows with screens and window treatments
- Laundry & utility: Washer; Dryer; Natural gas water heater
Neighborhood map
What this means for you Summary
Snapshot
- This is a 3-bed/1.0-bath single-family listed at $210k.
Deal economics
- At list price, monthly cash flow is $238 ($3k/yr) — positive.
- The deal already cash-flows at list — no discount required.
- To meet the 1% rule (rent ≥ 1% of price), the offer needs to be $204k (3.1% below list).
- Recommended offer: $204k (3.1% below list) — sets the bar for 1% rule.
- Cap rate 7.7% vs local median 4.2% in Watervliet — top-decile yield for the area; either an underpriced asset or a hidden risk that comps aren't pricing in. Stress-test before assuming the spread holds.
Location & tenants
- Location reads 70/100 on livability (#295 in MI) — a middle-class / working-renter tenant base. Strengths: cost of living A+, health & safety A+, housing A; Watch: employment C-, schools D+, crime D+.
- Watervliet School District (town): math 31% / reading 43% proficiency, ranked #260 of 540 in MI (top 48%) — families likely to look elsewhere, expect single-tenant / working-renter base with shorter leases.
- Market conditions: 82 active listings in the ZIP; 3 comparable units currently listed for rent nearby; rentals lingering (median 44d on market — plan ~5-8 weeks vacancy on turnover, expect pricing pressure); 100% of comp listings sitting > 30 days — soft ceiling on asking rent; 397 units permitted in Berrien County in 2024 (40 in 5+ unit buildings).
Forward outlook
- Local home prices are declining (-3.0%/yr); year-one equity from $1k of loan paydown is wiped out by about $6k of value loss. Plan a longer hold.
- Berrien County population projected at -16% by 2050 — secular population decline; favor cash flow + early exit over multi-decade hold.
Negotiation context
- Only 2 days on market — expect competitive offers; lowballing is unlikely to land.
- 8 sale attempts since 14y ago with the ask held roughly flat each time — persistent listings suggest the price (not the market) is what's stuck; bring a comps-based counter.
- Current owner paid $178k; 18% above their basis — modest negotiation headroom, anchor on the comps not their cost.
Risks & watch-outs
- Watch-outs: built in 1921 — expect roof / HVAC / electrical / plumbing capex.
Questions for the listing agent
- Built in 1921 — when were the roof, HVAC, electrical panel, plumbing, and water heater last replaced?
- Is there a deadline driving the sale (1031 exchange, divorce, estate, relocation)? That informs how much negotiation room exists.
- Schools are D-rated, which usually means shorter tenancies and higher turnover. Who's the typical renter profile here, and what's been the actual vacancy rate?
- Crime grade is D in this area — have there been break-ins, vandalism, or insurance claims at this property in the last 3 years? What carrier currently insures it and at what premium?
- The area grade is low — what's the realistic commute time and amenity access for the typical tenant pool here? Any planned neighborhood developments (good or bad) we should know about?
- What's the average days-on-market for RENTAL listings here right now (not sales)? A rising rental-DOM trend means longer vacancies and softer asking-rent achievability than the comps imply.
- What's the recent tenant-quality profile in this submarket — average credit score on applications, eviction rate, late-payment / NSF rate, and stable-employment percentage? A property-management company in the area should have these aggregated.
- How much new for-sale + rental construction is in the pipeline within 1–3 miles? Heavy new supply typically softens prices + rents 12–24 months out; constrained supply supports both.
Investment metrics
- 1% rule
- 0.97% ✗
- Cap rate
- 7.66%
- Cash-on-cash
- 4.86%
- DSCR
- 1.22
- GRM
- 8.6
CMA / ARV
- ARV (on-the-fly)
- $177,415
- Comps found
- 12
Show comp detail 12 sales within ~0.75 mi
| Address | Dist | Beds/Ba | Sqft | Sold | Price | $/sf | Match |
|---|---|---|---|---|---|---|---|
| 234 W Pleasant St | 0.05mi | 3/1.0 | 1,284 (-1%) | 2mo | $192,500 | $150 | 95 |
| 332 Sutherland Ave | 0.33mi | 3/1.5 | 1,261 (-3%) | 6mo | $217,000 | $172 | 73 |
| 925 Forest Park Ave | 0.52mi | 3/1.0 | 1,316 (+2%) | 1mo | $156,000 | $119 | 72 |
| 404 W Saint Joseph St | 0.21mi | 3/1.0 | 1,204 (-7%) | 10mo | $65,000 | $54 | 70 |
| 223 S Pleasant St | 0.31mi | 3/1.0 | 1,362 (+5%) | 13mo | $186,900 | $137 | 66 |
| 423 Paw Paw Ave | 0.31mi | 3/1.0 | 1,392 (+8%) | 16mo | $51,150 | $37 | 60 |
| 314 Riverside Dr | 0.37mi | 3/1.0 | 1,450 (+12%) | 8mo | $215,000 | $148 | 56 |
| 311 Lewis St | 0.48mi | 3/1.0 | 1,464 (+13%) | 2mo | $190,000 | $130 | 54 |
| 363 Riverside Dr | 0.34mi | 3/1.0 | 1,120 (-14%) | 14mo | $210,000 | $188 | 50 |
| 435 E St Joseph St | 0.46mi | 3/1.0 | 1,132 (-13%) | 17mo | $43,000 | $38 | 44 |
| 8376 E Baldwin Ave | 0.68mi | 2/1.0 (-1) | 1,100 (-15%) | 0mo | $99,900 | $91 | 38 |
| 1024 Western Ave | 0.73mi | 3/2.0 | 1,120 (-14%) | 13mo | $318,500 | $284 | 29 |
Match score weights: distance 35% · size 25% · config 20% · recency 20%. Top-matched comps best support the ARV.
Projected returns pro-forma
-3.0% appreciation · 3.0% rent growth · sell at horizon
- IRR
- -8.7%
- Equity multiple
- 0.68×
- Total profit
- $-18,866
- Equity at exit
- $31,312
- IRR
- 0.7%
- Equity multiple
- 1.05×
- Total profit
- $3,044
- Equity at exit
- $18,157
Cash invested: $58,800 (down + closing). Projections, not guarantees.
Landlord ↔ Tenant lean methodology
- Overall (STATE)
- 62 Landlord-Friendly
- State Michigan
- 62 Landlord-Friendly · EVEN
- County
- — inherits STATE
- City
- — inherits STATE
ZIP-level market 49098
- Active inventory
- 82
- Price-to-rent
- 8.6×
Monthly cashflow live
- Estimated rent
- $2,036 medium interval (Pro) →
- Mortgage (P&I)
- −$1,101
- Tax from tax record
- −$181 /mo · $2,175/yr
- Insurance
- −$88
- HOA
- −$0
- Vacancy / Maint / Mgmt
- −$428
- Net cashflow
- $238
Break-even live
UW: 25.0% down · 7.5% · 30yr · 1.5% tax · 5.0% vac · 8.0% maint · 8.0% mgmt
Financing live
Cash to close
- Down payment
- $52,500
- Closing costs
- $6,300
- Reserves months
- —
- Total cash needed
- —
Loan-product check · same deal, 3 products live
Conventional
25% down · 7.5% · 30yr
- Down + closing
- —
- Monthly P&I
- —
- Monthly cashflow
- —
- DSCR
- —
- Eligible?
- —
Personal DTI + credit; lowest rate.
DSCR
20% down · 8.5% · 30yr
- Down + closing
- —
- Monthly P&I
- —
- Monthly cashflow
- —
- DSCR
- —
- Eligible?
- —
No personal income docs; deal must DSCR.
Hard money
10% down · 12.0% · 12mo
- Down + closing
- —
- Monthly P&I
- —
- Monthly cashflow
- —
- DSCR
- —
- Eligible?
- —
Short-term bridge; refi at stabilization.
Rent comps 3 comps
| Address | Beds | Baths | Sqft | Rent | $/sqft | DOM | Units | Dist |
|---|---|---|---|---|---|---|---|---|
| 4020 Sumner Dr Watervliet, MI | 4.0 | 2.0 | 1750 | $2,395 | $1.37 | 43d | 1 | 0.47mi |
| 3882 Watertown Dr Watervliet, MI | 4.0 | 2.0 | 1750 | $2,195 | $1.25 | 43d | 1 | 0.56mi |
| 7604 Red Arrow Hwy Watervliet, MI | 2.0–3.0 | 2.0 | 1078 | $1,319 | $1.22 | 43d | 1 | 0.77mi |
Listing history 3 events
-
2026-06-18days on market $210,000 Active 2 DOM
-
2026-06-17remarks 699-char remark
-
2026-06-17$210,000 Active 1 DOM
ⓘ Source: listings_history table (triggers on properties + properties_extension) + one-shot
backfill from property_details.listing_events for pre-trigger history.
Tax reassessment forecast MI · Partial reset (capped growth)
- Current annual tax
- $2,175 · $181/mo
- Projected year-2 tax
- $2,704 · $225/mo
- Expected delta
- +$530/yr (+$44/mo · 24.4%)
ⓘ Screening estimate from a state-policy table — verify with the county assessor before closing.
Climate risk First Street
- Flood 1/10 Low FEMA zone X (unshaded) · 0% chance over 30 yrs
- Wildfire 1/10 Low
- Heat 2/10 Low 7 d/yr ≥99°F today · 15 d/yr by 30 yrs out
- Wind 2/10 Low
- Air quality 4/10 Moderate 4 unhealthy d/yr today · 7 by 30 yrs out
Nearby sold comps map
Loading sold comps map…
Walkable amenities ~0.75 mi
Loading nearby amenities…
Taxation est. · year 1
- Rental income
- $24,431
- − Mortgage interest
- −$11,763
- − Property taxes
- −$2,175
- − Insurance
- −$1,050
- − Repairs & maintenance
- −$1,954
- − Management
- −$1,954
- − Depreciation
- −$6,109
- Taxable loss
- −$575
- Est. tax savings @ 24.0%
- +$138
- After-tax cash flow
- $2,999/yr
For passive investors: Depreciation is non-cash, so a rental often shows a tax loss while cash-flowing — sheltering income. Rental losses are passive: they offset passive income freely, and up to $25,000/yr can offset ordinary (W-2) income if you actively participate and your MAGI is under $100k (phasing out to $0 by $150k); unused losses carry forward. On sale, claimed depreciation is recaptured at up to 25%, and gains may owe capital-gains tax (a 1031 exchange can defer both). Figures are a year-1 estimate at your 24.0% rate — not tax advice; consult a CPA.
Schools (NCES district)
- District
- Watervliet School District
- NCES district ID
- 2635460
- Math proficiency
- 31% ▼ -9.00%
- Reading proficiency
- 43% ▼ -1.00%
- Median HH income
- $42,249
- Composite
- 31.22/100
- National rank
- #6034
- State rank
- #260 of 540 in MI
Livability — Watervliet
- Score
- 70/100
- State rank
- #295
- US rank
- #7373
Category grades
Schools grade is shown separately in the Schools card above.
Census & demographics
- Census place
- Watervliet, MI
- Population (ZIP)
- 5,791
Population outlook (Berrien County) Hauer SSP2
- Today (2025)
- 149,273 people
- By 2030
- 145,211 · -2.7%
- By 2040
- 135,435 · -9.3%
- By 2050
- 125,543 · -15.9%
- By 2075
- 103,986 · -30.3%
- By 2100
- 82,256 · -44.9%
Race, ethnicity, and origin ACS 2023
- Neighborhood character
- Predominantly White (81%)
- Race & ethnicity
- White 81% Hispanic / Latino 9% Black 5% Two or more races 3% Asian 1%
- Hispanic origin (detail)
- Mexican 8%
- Common ancestry
- Iranian 7% Romanian 4% Slovak 2%
- Foreign-born
- 3% · Canada, Vietnam
- Languages at home
- 96% English-only · Spanish 3% French/Haitian/Cajun 0%
Political lean MEDSL · Berrien
- 2024 margin
- Lean R (+7.9) · D 45.4% · R 53.2% · Other 1.4%
- 2008→2024 swing
- -13.3pp toward R · 2008: 5.5pp · 2024: -7.9pp
- All cycles
- 2024: R+7.9 2020: R+7.4 2016: R+12.7 2012: R+6.6 2008: D+5.5
Not yet ingested
- Civics
- —
Market trends
- HPI YoY
- ▼ -223.00%
- Current HPI
- 208.2105
- Rent YoY
- —
- Metro
- —
- State GDP YoY
- ▲ 1.37%
- F500 in state
- 28
Industry mix (Fortune 500 HQ in MI)
| Industry | F500 HQs | Revenue |
|---|---|---|
| Automotive Parts | 3 | $48B |
|
||
| Automotive | 2 | $372B |
|
||
| Chemicals | 1 | $45B |
|
||
| Automotive Retail | 1 | $29B |
|
||
| Healthcare / Medical Devices | 1 | $23B |
|
||
| Automotive Technology | 1 | $20B |
|
||
Price history
+743.4% since first listed14 events — show timeline
- 2026-06-16 Listed $210,000 REALCOMP
- 2026-06-16 Listed $210,000 SW Michigan MLS
- 2026-06-16 Listed $210,000 MiRealSource-MiMLS
- 2022-04-18 Sold (MLS) $178,000 SW Michigan MLS
- 2022-04-18 Sold (MLS) $178,000 REALCOMP
- 2022-03-17 Pending — REALCOMP
- 2022-03-17 Pending — SW Michigan MLS
- 2022-03-12 Listed $159,900 MiRealSource-MiMLS
- 2022-03-12 Listed $159,900 SW Michigan MLS
- 2022-03-12 Listed $159,900 REALCOMP
- 2012-07-02 Sold (MLS) $22,000 REALCOMP
- 2012-07-02 Sold (MLS) $22,000 SW Michigan MLS
- 2012-06-14 Listed $24,900 REALCOMP
- 2012-06-14 Listed $24,900 SW Michigan MLS
Property tax history
+11.0%/yrLatest (2024): $2,175 · +3.6% YoY. Source: county tax records.
Cash-flow waterfall
monthlySold comps — $/sqft
last 12 mo · ≤1 miLoading sold comps…