505 N Ft Lauderdale Bch Blvd #903 · Fort Lauderdale, FL
Flood risk No data
- FEMA flood zone
- —
- Chance of flooding over 30 yrs
- —
- Est. flood insurance / yr
- —
Fire risk No data
- Est. fire insurance / yr
- —
Heat risk No data
- Hot days now (above threshold)
- —
- Hot days in 30 yrs
- —
Wind risk No data
- Chance of severe wind over 30 yrs
- —
Air-quality risk No data
- Unhealthy air days now
- —
- Unhealthy air days in 30 yrs
- —
Risk factors via First Street. Map © Google.
Why this score? — see what drove the C+ grade
The composite is a weighted blend of 9 inputs, each scored 0–100. Each bar is that input's sub-score; the figure is the points it added to the 100-point composite (weight × sub-score).
- Cash flow +24.2/30.0
- DSCR +7.8/10.0
- ARV discount +7.5/15.0
- 1% rule +6.7/10.0
- Schools +4.1/10.0
- Livability +4.1/5.0
- Rent growth +3.2/5.0
- Condition / age +2.5/5.0
- Appreciation +0.0/10.0
$219,000
🖨 Deal sheet 📄 Offer letter ✓ Due diligence
Listing remarks MLS
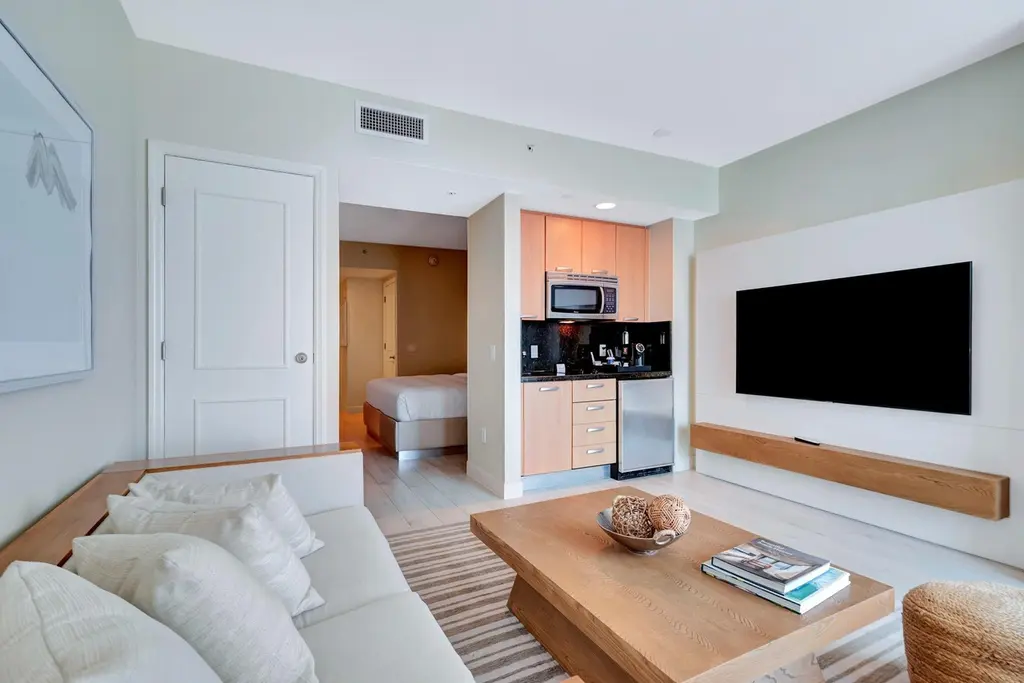
BEAUTIFUL HILTON HOTEL CONDO, OCEAN VIEW, BALCONY JUST REMODELED AND CAN BE IN THE HILTON RENTAL PROGRAM.
Key facts
- Fitness center
- Oceanfront pool
- Ocean access
Tags
Property features AI
Finance
- Financial info: Pets allowed with limits
- HOA & community: Association with amenities: cabana, fitness center, pool, spa/hot tub, bar, cafe/restaurant; Association provides maintenance, pest control, sewer, trash, water, elevator, HVAC maintenance, roof repairs, pool service; HOA fee paid annually
Exterior
- Parking: Valet parking
- Security: Lobby attended; Security system; Closed-circuit cameras; Smoke detectors
- Utilities: Water service available; Sewer service available; Electric service available
- Home design: Condominium; Resale unit; 25-story building
- Construction: CBS construction
- Exterior features: Waterfront property; East of US-1 road frontage
Interior
- Kitchen: Electric range, microwave, refrigerator, disposal
- Bedrooms: One bedroom on the main level
- Flooring: Ceramic tile; Marble
- Bathrooms: One full bathroom on the main level
- Heating & cooling: Electric heating; Central air conditioning (electric)
- Interior features: Furnished; Drapes and curtain rods; Disposal; Electric range; Microwave; Refrigerator
Neighborhood map
What this means for you Summary
Snapshot
- This is a 1-bed/1.0-bath condo listed at $219k.
Deal economics
- At list price, monthly cash flow is $435 ($5k/yr) — positive.
- The deal already cash-flows at list — no discount required.
- Meets the 1% rule at list price ($3k rent vs $219k).
- Recommended offer: $206k (6.0% below list) — sets the bar for market timing.
- Cap rate 8.7% vs local median 2.2% in Fort Lauderdale — top-decile yield for the area; either an underpriced asset or a hidden risk that comps aren't pricing in. Stress-test before assuming the spread holds.
Location & tenants
- Location reads 82/100 on livability (#78 in FL, #1,293 nationally) — a professional / high-income tenant draw. Strengths: crime A+, amenities A+, health & safety A+; Watch: cost of living D-.
- Broward (suburban): math 42% / reading 53% proficiency, ranked #46 of 73 in FL (top 63%) — families likely to look elsewhere, expect single-tenant / working-renter base with shorter leases.
- Zoned schools: Harbordale Elementary School (math 64% / reading 74%, grade A-, #399 of 2,144 statewide, top 19%, 487 students, 38% FRL); Sunrise Middle School (math 50% / reading 52%, grade C, #237 of 571 statewide, top 43%, 1,242 students, 64% FRL); Fort Lauderdale High School (math 38% / reading 67%, grade C-, #154 of 667 statewide, top 24%, 2,228 students, 57% FRL) — zoned schools at 53% FRL track the district average.
- Market conditions: Rents rising (+2.8%/yr); 625 active listings in the ZIP; 40 comparable units currently listed for rent nearby; rentals at typical pace (median 21d on market — plan ~3-4 weeks tenant-placement turnaround); solid renter incomes; 2,111 units permitted in Broward County in 2024 (1,265 in 5+ unit buildings).
- This rent runs 36% of the median local income ($85k/yr) — at the standard rent-burdened threshold; future hikes will face affordability resistance.
Forward outlook
- Local home prices are declining (-3.0%/yr); year-one equity from $2k of loan paydown is wiped out by about $7k of value loss. Plan a longer hold.
- Broward County population projected at +34% by 2050 — long-run rental-demand tailwind backs the buy-and-hold thesis.
Negotiation context
- It's been on market 90 days — a 6% lower offer ($206k) is reasonable based on typical stale-listing flexibility.
Questions for the listing agent
- It's been on market 90 days. Have you received any prior offers? Is the seller open to a 6% concession, seller financing, or rate buy-down credit?
- What does the HOA fee cover, when was the last increase, and are there any pending special assessments or reserve-fund shortfalls?
- Any open or pending special assessments — roof, HVAC, plumbing, elevator, façade? What's the per-unit balance and payoff schedule, and is the seller paying it off at close or rolling it to the buyer?
- Why hasn't it sold? Are there any deal-killer items the seller is aware of (foundation, flood, title, zoning, code violations)?
- Is there a deadline driving the sale (1031 exchange, divorce, estate, relocation)? That informs how much negotiation room exists.
- Schools are B-rated — typically a magnet for longer-tenancy family renters. What's the average tenant stay here, and is there a school-zone premium baked into asking?
- What's the average days-on-market for RENTAL listings here right now (not sales)? A rising rental-DOM trend means longer vacancies and softer asking-rent achievability than the comps imply.
- What's the recent tenant-quality profile in this submarket — average credit score on applications, eviction rate, late-payment / NSF rate, and stable-employment percentage? A property-management company in the area should have these aggregated.
- How much new apartment / multifamily construction is in the pipeline within 1–3 miles? Heavy new supply (>2% of stock underway) typically softens rents 12–24 months out; light construction supports rent growth.
Investment metrics
- 1% rule
- 1.17% ✓
- Cap rate
- 8.68%
- Cash-on-cash
- 8.51%
- DSCR
- 1.38
- GRM
- 7.1
CMA / ARV
No comps found within radius.
Projected returns pro-forma
-3.0% appreciation · 2.75% rent growth · sell at horizon
- IRR
- -3.6%
- Equity multiple
- 0.86×
- Total profit
- $-8,344
- Equity at exit
- $32,654
- IRR
- 5.8%
- Equity multiple
- 1.43×
- Total profit
- $26,127
- Equity at exit
- $18,935
Cash invested: $61,320 (down + closing). Projections, not guarantees.
Landlord ↔ Tenant lean methodology
- Overall (STATE)
- 87 Strongly Landlord-Friendly
- State Florida
- 87 Strongly Landlord-Friendly · R+3
- County
- — inherits STATE
- City
- — inherits STATE
ZIP-level market 33304
- Rents YoY
- 2.8%
- Active inventory
- 625
- Price-to-rent
- 7.1×
Monthly cashflow live
- Estimated rent
- $2,564 high interval (Pro) →
- Mortgage (P&I)
- −$1,148
- Tax from tax record
- −$347 /mo · $4,168/yr
- Insurance
- −$91
- HOA
- −$4
- Vacancy / Maint / Mgmt
- −$539
- Net cashflow
- $435
Break-even live
UW: 25.0% down · 7.5% · 30yr · 1.5% tax · 5.0% vac · 8.0% maint · 8.0% mgmt
Financing live
Cash to close
- Down payment
- $54,750
- Closing costs
- $6,570
- Reserves months
- —
- Total cash needed
- —
Loan-product check · same deal, 3 products live
Conventional
25% down · 7.5% · 30yr
- Down + closing
- —
- Monthly P&I
- —
- Monthly cashflow
- —
- DSCR
- —
- Eligible?
- —
Personal DTI + credit; lowest rate.
DSCR
20% down · 8.5% · 30yr
- Down + closing
- —
- Monthly P&I
- —
- Monthly cashflow
- —
- DSCR
- —
- Eligible?
- —
No personal income docs; deal must DSCR.
Hard money
10% down · 12.0% · 12mo
- Down + closing
- —
- Monthly P&I
- —
- Monthly cashflow
- —
- DSCR
- —
- Eligible?
- —
Short-term bridge; refi at stabilization.
Rent comps 40 comps
| Address | Beds | Baths | Sqft | Rent | $/sqft | DOM | Units | Dist |
|---|---|---|---|---|---|---|---|---|
| 3101 Bayshore Dr Fort Lauderdale, FL | 1.0–2.0 | 1.0–2.0 | 982 | $4,900 | $4.99 | 12d | 6 | 0.03mi |
| 3000 Riomar St Fort Lauderdale, FL | 1.0 | 1.0 | 640 | $2,250 | $3.52 | 3d | 2 | 0.10mi |
| 347 N Birch Rd Unit 1-9 Fort Lauderdale, FL | 1.0 | 1.0 | 650 | $3,500 | $5.38 | 24d | 1 | 0.17mi |
| 2908 Bayshore Dr Unit 1541800P Fort Lauderdale, FL | 1.0 | 1.0 | 613 | $3,085 | $5.03 | 13d | 1 | 0.18mi |
| 341 N Birch Rd #416 Fort Lauderdale, FL | 1.0 | 1.0 | 621 | $3,495 | $5.63 | 24d | 1 | 0.19mi |
| 600 N Birch Rd Unit 605H Fort Lauderdale, FL | 1.0 | 1.0 | 668 | $2,000 | $2.99 | 24d | 1 | 0.20mi |
| 3015 Seville St #6 Fort Lauderdale, FL | 1.0 | 1.0 | 700 | $2,500 | $3.57 | 22d | 1 | 0.21mi |
| 3015 Seville St #7 Fort Lauderdale, FL | 1.0 | 1.0 | 700 | $2,350 | $3.36 | 8d | 1 | 0.21mi |
| 3015 Seville St #6 Fort Lauderdale, FL | 1.0 | 1.0 | 700 | $2,450 | $3.50 | 8d | 1 | 0.21mi |
| 508 Antioch Ave #1 Fort Lauderdale, FL | 1.0 | 1.0 | 748 | $2,500 | $3.34 | 24d | 1 | 0.22mi |
| 624 Orton Ave #19 Fort Lauderdale, FL | 1.0 | 1.0 | 691 | $2,200 | $3.18 | 24d | 1 | 0.27mi |
| 625 Antioch Ave #407 Fort Lauderdale, FL | 1.0 | 1.0 | 670 | $2,200 | $3.28 | 3d | 1 | 0.32mi |
| 720 Orton Ave Fort Lauderdale, FL | 1.0–2.0 | 1.0 | 750 | $2,100 | $2.80 | 24d | 2 | 0.33mi |
| 101 N Birch Rd #503 Fort Lauderdale, FL | 1.0 | 1.0 | 696 | $2,200 | $3.16 | 24d | 1 | 0.39mi |
| 95 N Birch Rd Fort Lauderdale, FL | 1.0 | 1.0 | 755 | $3,575 | $4.74 | 13d | 2 | 0.41mi |
| 741 Bayshore Dr Unit 16N Fort Lauderdale, FL | 1.0 | 1.0 | 565 | $2,400 | $4.25 | 5d | 1 | 0.43mi |
| 9 N Birch Rd #601 Fort Lauderdale, FL | 1.0 | 1.0 | 640 | $2,500 | $3.91 | 17d | 1 | 0.43mi |
| 9 N Birch Rd Fort Lauderdale, FL | 1.0 | 1.0 | 640 | $2,350 | $3.67 | 15d | 2 | 0.43mi |
| 901 N Birch Rd Fort Lauderdale, FL | 1.0 | 1.0 | 550 | $2,300 | $4.18 | 5d | 1 | 0.54mi |
| 901 N Birch Rd Unit A2 Fort Lauderdale, FL | 1.0 | 1.0 | 490 | $2,500 | $5.10 | 24d | 1 | 0.55mi |
| 200 S Birch Rd Fort Lauderdale, FL | 1.0 | 1.0 | 647 | $2,050 | $3.17 | 10d | 2 | 0.60mi |
| 2670 E Sunrise Blvd #1428 Fort Lauderdale, FL | 1.0 | 1.0 | 585 | $1,589 | $2.72 | 24d | 1 | 0.67mi |
| 2555 NE 11th St Fort Lauderdale, FL | 1.0–2.0 | 1.0 | 840 | $1,550 | $1.85 | 24d | 2 | 0.87mi |
| 300 Sunset Dr Unit 5 Fort Lauderdale, FL | 2.0 | 1.0 | 350 | $2,500 | $7.14 | 24d | 1 | 0.90mi |
| 300 Sunset Dr Unit 15 Fort Lauderdale, FL | — | 1.0 | 350 | $1,600 | $4.57 | 5d | 1 | 0.90mi |
| 300 Sunset Dr Unit 4 Fort Lauderdale, FL | — | 1.0 | 350 | $1,500 | $4.29 | 24d | 1 | 0.90mi |
| 815 Middle River Dr #203 Fort Lauderdale, FL | 1.0 | 1.0 | 660 | $1,900 | $2.88 | 20d | 1 | 0.99mi |
| 100 Isle of Venice Dr Fort Lauderdale, FL | 1.0 | 1.0 | 750 | $1,725 | $2.30 | 24d | 1 | 1.07mi |
| 90 Isle of Venice Dr #10 Fort Lauderdale, FL | 1.0 | 1.0 | 700 | $2,000 | $2.86 | 24d | 1 | 1.07mi |
| 125 Isle of Venice Dr #4 Fort Lauderdale, FL | 1.0 | 1.0 | 580 | $3,500 | $6.03 | 5d | 1 | 1.08mi |
| 125 Isle of Venice Dr #4 Fort Lauderdale, FL | 1.0 | 1.0 | 580 | $2,500 | $4.31 | 15d | 1 | 1.08mi |
| 508 Hendricks Isle #3 Fort Lauderdale, FL | 1.0 | 1.0 | 490 | $2,700 | $5.51 | 5d | 1 | 1.11mi |
| 508 Hendricks Isle #3 Fort Lauderdale, FL | 1.0 | 1.0 | 490 | $2,800 | $5.71 | 14d | 1 | 1.11mi |
| 1200 N Fort Lauderdale Beach Blvd #204 Fort Lauderdale, FL | 1.0 | 1.0 | 702 | $2,500 | $3.56 | 24d | 1 | 1.12mi |
| 1911 NE 8th Ct Fort Lauderdale, FL | 1.0 | 1.0 | 650 | $1,650 | $2.54 | 24d | 1 | 1.13mi |
| 1354 Bayview Dr Apt E Fort Lauderdale, FL | 1.0 | 1.0 | 634 | $1,800 | $2.84 | 24d | 1 | 1.16mi |
| 37 Hendricks Isle Unit 1504034P Fort Lauderdale, FL | 1.0 | 1.0 | 564 | $3,462 | $6.13 | 3d | 2 | 1.24mi |
| 37 Hendricks Isle Unit 1504034P Fort Lauderdale, FL | — | 1.0 | 527 | $2,841 | $5.39 | 21d | 1 | 1.24mi |
| 37 Hendricks Isle Unit 1503944P Fort Lauderdale, FL | 1.0 | 1.0 | 602 | $3,314 | $5.50 | 14d | 1 | 1.24mi |
| 1770 E Las Olas Blvd Fort Lauderdale, FL | 1.0–2.0 | 1.0–2.0 | 822 | $2,500 | $3.04 | 22d | 2 | 1.33mi |
HOA detail condo
- Monthly dues
- $4 · $48/yr
- Assessments
- None detected in remarks — confirm with the listing agent.
Listing history 14 events
-
2026-06-13status $219,000 Pending 90 DOM
-
2026-06-09days on market $219,000 Active Under Contract 90 DOM
-
2026-06-07days on market $219,000 Active Under Contract 88 DOM
-
2026-06-04days on market $219,000 Active Under Contract 85 DOM
-
2026-06-03days on market $219,000 Active Under Contract 84 DOM
-
2026-06-02days on market $219,000 Active Under Contract 83 DOM
-
2026-06-01days on market $219,000 Active Under Contract 82 DOM
-
2026-05-31days on market $219,000 Active Under Contract 81 DOM
-
2026-05-16historical Active Under Contract
-
2025-12-01$219,000 Active
-
2013-08-28soldstatus $240,000
-
2011-08-31soldstatus $184,000 105-char remark
Show marketing remark (105 chars)
BEAUTIFUL HILTON HOTEL CONDO, OCEAN VIEW, BALCONY JUST REMODELED AND CAN BE IN THE HILTON RENTAL PROGRAM.
-
2011-08-26soldstatus $184,000
-
2006-12-18soldstatus $318,500
ⓘ Source: listings_history table (triggers on properties + properties_extension) + one-shot
backfill from property_details.listing_events for pre-trigger history.
Tax reassessment forecast FL · Resets to sale price
- Current annual tax
- $4,168 · $347/mo
- Projected year-2 tax
- $4,168 · $347/mo
- Expected delta
- $0/yr ($0/mo · 0.0%)
ⓘ Screening estimate from a state-policy table — verify with the county assessor before closing.
Nearby sold comps map
Loading sold comps map…
Walkable amenities ~0.75 mi
Loading nearby amenities…
Taxation est. · year 1
- Rental income
- $30,774
- − Mortgage interest
- −$12,267
- − Property taxes
- −$4,168
- − Insurance
- −$1,095
- − Repairs & maintenance
- −$2,462
- − Management
- −$2,462
- − HOA
- −$48
- − Depreciation
- −$6,371
- Taxable income
- $1,901
- Est. tax owed @ 24.0%
- −$456
- After-tax cash flow
- $4,763/yr
For passive investors: Depreciation is non-cash, so a rental often shows a tax loss while cash-flowing — sheltering income. Rental losses are passive: they offset passive income freely, and up to $25,000/yr can offset ordinary (W-2) income if you actively participate and your MAGI is under $100k (phasing out to $0 by $150k); unused losses carry forward. On sale, claimed depreciation is recaptured at up to 25%, and gains may owe capital-gains tax (a 1031 exchange can defer both). Figures are a year-1 estimate at your 24.0% rate — not tax advice; consult a CPA.
Schools (NCES district)
- District
- Broward
- NCES district ID
- 1200180
- Math proficiency
- 42% ▼ -18.00%
- Reading proficiency
- 53% ▼ -5.00%
- Median HH income
- $52,139
- Composite
- 40.88/100
- National rank
- #3621
- State rank
- #46 of 73 in FL
Livability — Fort Lauderdale
- Score
- 82/100
- State rank
- #78
- US rank
- #1293
Category grades
Schools grade is shown separately in the Schools card above.
Census & demographics
- Census place
- Fort Lauderdale, FL
- County
- Broward County · 1,963,430 people
- City population
- 235,769
- Metro
- Miami-Fort Lauderdale-Pompano Beach, FL
- Population (ZIP)
- 18,332
- Household income
- $84,920
- Rent vs Own
- Severe rent burden
- 1534.0
Population outlook (Broward County) Hauer SSP2
- Today (2025)
- 2,207,033 people
- By 2030
- 2,360,704 · +7.0%
- By 2040
- 2,661,208 · +20.6%
- By 2050
- 2,946,698 · +33.5%
- By 2075
- 3,602,273 · +63.2%
- By 2100
- 3,970,984 · +79.9%
Race, ethnicity, and origin ACS 2023
- Neighborhood character
- Diverse neighborhood (Simpson 0.63)
- Race & ethnicity
- White 56% Hispanic / Latino 19% Two or more races 17% Black 13% Asian 4%
- Hispanic origin (detail)
- Mexican 2% Puerto Rican 4% Cuban 3%
- Common ancestry
- Hispanic 5% Scotch-Irish 3% Romanian 2%
- Foreign-born
- 32% · Canada, Jamaica, Vietnam
- Languages at home
- 61% English-only · Spanish 20% Other Indo-European 6% French/Haitian/Cajun 5%
Political lean MEDSL · Broward
- 2024 margin
- D (+17.0) · D 58.0% · R 41.0%
- 2008→2024 swing
- -17.8pp toward R · 2008: 34.7pp · 2024: 17.0pp
- All cycles
- 2024: D+17.0 2020: D+29.8 2016: D+35.0 2012: D+34.9 2008: D+34.7
Not yet ingested
- Civics
- —
Market trends
- HPI YoY
- ▼ -522.22%
- Current HPI
- 348.0065
- Rent YoY
- ▲ 2.75%
- Metro
- Miami-Fort Lauderdale-Pompano Beach, FL
- State GDP YoY
- ▲ 3.28%
- F500 in state
- 36
Industry mix (Fortune 500 HQ in FL)
| Industry | F500 HQs | Revenue |
|---|---|---|
| Industrial Technology | 2 | $29B |
|
||
| Insurance | 2 | $17B |
|
||
| Retail | 1 | $60B |
|
||
| Technology Distribution | 1 | $58B |
|
||
| Homebuilding | 1 | $35B |
|
||
| Technology Manufacturing | 1 | $35B |
|
||
Price history
-31.2% since first listed6 events — show timeline
- 2026-05-16 Contingent — Beaches MLS
- 2025-12-01 Listed $219,000 Beaches MLS
- 2013-08-28 Sold (Public Records) $240,000 Public Records
- 2011-08-31 Sold (MLS) $184,000 MARMLS
- 2011-08-26 Sold (Public Records) $184,000 Public Records
- 2006-12-18 Sold (Public Records) $318,500 Public Records
Property tax history
+1.6%/yrLatest (2025): $4,168 · -6.0% YoY. Source: county tax records.
Cash-flow waterfall
monthlySold comps — $/sqft
last 12 mo · ≤1 miLoading sold comps…