 Duplex
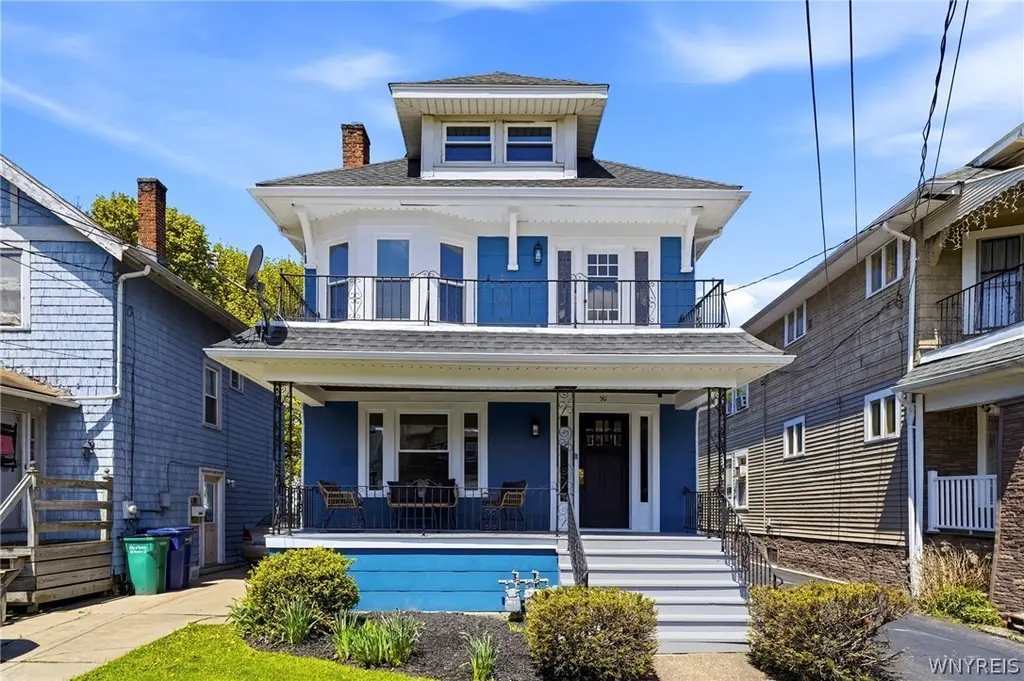
90 Armin Pl · Buffalo, NY
Flood risk 7/10 · Major
- FEMA flood zone
- X (unshaded)
- Chance of flooding over 30 yrs
- 0.75%
- Est. flood insurance / yr
- $473 – $860
Fire risk 1/10 · Minimal
- Est. fire insurance / yr
- $691 – $1,283
Heat risk 3/10 · Minor
- Hot days now (above 92°F)
- 7 days/yr
- Hot days in 30 yrs
- 15 days/yr
Wind risk 1/10 · Minimal
- Chance of severe wind over 30 yrs
- —
Air-quality risk 3/10 · Minor
- Unhealthy air days now
- 2 days/yr
- Unhealthy air days in 30 yrs
- 3 days/yr
Risk factors via First Street. Map © Google.
Why this score? — see what drove the B- grade
The composite is a weighted blend of 9 inputs, each scored 0–100. Each bar is that input's sub-score; the figure is the points it added to the 100-point composite (weight × sub-score).
- Cash flow +18.6/30.0
- ARV discount +15.0/15.0
- Appreciation +10.0/10.0
- DSCR +5.8/10.0
- Rent growth +5.0/5.0
- Livability +3.9/5.0
- 1% rule +3.6/10.0
- Schools +3.3/10.0
- Condition / age +2.5/5.0
$299,900
🖨 Deal sheet (PDF) 📄 Offer letter ✓ Due diligence
Multi-family units
County records classify this as Multi-Family (2-4 Unit). Listing-text estimate: 2 units. confirmed
Listing remarks
Hands down one of the finest two-family homes in South Buffalo, this completely gutted and fully remodeled showstopper is truly move-in ready. Perfect for investors or owner-occupants alike, both the upper and lower units have been thoughtfully redesigned with high-end finishes and modern conveniences throughout. Each unit features a stunning brand new eat-in kitchen complete with custom soft-close cabinetry with crown molding, full-extension drawers, granite countertops, stainless steel appliances, recessed lighting, and all-new flooring. The beautifully updated bathrooms showcase striking ceramic wave-tile tub/shower surrounds and quartz-topped vanities, blending style and sophistication.
Key facts
- Fully remodeled
- Granite countertops
- 5,075 sq ft lot
Tags
Property features AI
Finance
- Financial info: Multi-family property with 2 units; Each unit has separate gas and electric meters; Operating expenses include insurance, maintenance (structure and general), trash, and water/sewer; Owner pays trash collection and water; rent includes trash collection and water
Exterior
- Parking: Attached or detached garage with approximately 2.5 spaces; Paved parking; Multiple parking spaces
- Utilities: Electricity connected with circuit breakers; Public water connection; Sewer connected; High-speed internet available; Cable available
- Home design: 2-story property; Existing structure
- Construction: Composite siding; Copper and PEX plumbing; Architectural shingle roof; Block and poured foundation; Resale condition
- Exterior features: Balcony; Covered and open porch; Fully fenced yard; Near public transit; Rectangular residential lot; City street frontage
Interior
- Kitchen: Dishwasher; Oven/Range; Refrigerator; Microwave; Eat-in kitchen; Formal dining room
- Bedrooms: Each unit has 2 bedrooms
- Flooring: Ceramic tile; Hardwood; Luxury vinyl; Varied flooring types
- Bathrooms: Two full bathrooms total (one full bathroom in each unit)
- Heating & cooling: Gas forced-air heating
- Interior features: Ceiling fans; Storage space; Natural woodwork; Programmable thermostat; Leaded glass windows; Thermal windows
- Laundry & utility: Washer hookup; Gas water heater; Satellite dish
Neighborhood map
What this means for you Summary
Snapshot
- This is a 2 × 2-bed/1.0-bath units multifamily listed at $300k.
Deal economics
- At list price, monthly cash flow is $233 ($3k/yr) — positive. Per door: $116/mo.
- The deal already cash-flows at list — no discount required.
- To meet the 1% rule (rent ≥ 1% of price), the offer needs to be $259k (13.7% below list).
- Recommended offer: $259k (13.7% below list) — sets the bar for 1% rule.
Location & tenants
- Location reads 77/100 on livability (#195 in NY, #3,011 nationally) — a middle-class / working-renter tenant base. Strengths: commute A+, housing A+, health & safety A+; Watch: crime F, employment D-.
- Buffalo City School District (urban): math 41% / reading 40% proficiency, ranked #535 of 590 in NY (top 91%) — families likely to look elsewhere, expect single-tenant / working-renter base with shorter leases; 75% free/reduced lunch — lower-income household profile, screen leases tightly.
- Market conditions: Rents rising fast (+12.7%/yr); 94 active listings in the ZIP; 1 comparable units currently listed for rent nearby; 1,244 units permitted in Erie County in 2024 (563 in 5+ unit buildings).
- At $2,589/mo this rent would consume 57% of the median local household income ($54k/yr) (locally 959% of renters already pay >50% of income on rent) — very limited rent-growth headroom before tenants either downsize or default.
Forward outlook
- In year one you build about $32k of equity ($2k loan paydown + $30k appreciation (10.0% local appreciation)).
- At projected returns (10.0% appreciation + 8.0% rent growth), your $84k cash investment doubles in ~3 years — after that, you're playing with house money.
- By year 2, paydown + projected appreciation supports a ~$52k cash-out refi (75% LTV) — recoverable capital for the next deal without selling this one.
Negotiation context
- It's been on market 15 days — a 2% lower offer ($295k) is reasonable based on typical stale-listing flexibility.
- Current owner paid $32k; list at $300k implies a 837% gain — meaningful room to come down on a strong offer.
Risks & watch-outs
- Watch-outs: flood insurance adds $56/mo; built in 1928 — expect roof / HVAC / electrical / plumbing capex.
- Climate carrying-cost: major flood risk — expect insurance premiums to compound above CPI over the hold.
Questions for the listing agent
- Can we see the unit-by-unit rent roll, current vacancy, and any below-market leases? What's the average tenancy length?
- What capital expenditures (roof, boiler, parking lot, exteriors) have been made in the last 5 years, and what's planned in the next 2?
- Built in 1928 — when were the roof, HVAC, electrical panel, plumbing, and water heater last replaced?
- What's the actual annual flood-insurance premium (NFIP or private), and is the property in a SFHA with mandatory coverage?
- Is there a deadline driving the sale (1031 exchange, divorce, estate, relocation)? That informs how much negotiation room exists.
- Crime grade is F in this area — have there been break-ins, vandalism, or insurance claims at this property in the last 3 years? What carrier currently insures it and at what premium?
- What's the average days-on-market for RENTAL listings here right now (not sales)? A rising rental-DOM trend means longer vacancies and softer asking-rent achievability than the comps imply.
- What's the recent tenant-quality profile in this submarket — average credit score on applications, eviction rate, late-payment / NSF rate, and stable-employment percentage? A property-management company in the area should have these aggregated.
- How much new apartment / multifamily construction is in the pipeline within 1–3 miles? Heavy new supply (>2% of stock underway) typically softens rents 12–24 months out; light construction supports rent growth.
Investment metrics
- 1% rule
- 0.86% ✗
- Cap rate
- 7.45%
- Cash-on-cash
- 4.12%
- DSCR
- 1.18
- GRM
- 9.7
CMA / ARV
- ARV (median comp)
- $366,997
- List price
- $299,900
- Delta
- -18.28%
- Verdict
- UNDERPRICED
- Comps
- 20 within 1.0 mi
Show comp detail 12 sales within ~0.75 mi
| Address | Dist | Beds/Ba | Sqft | Sold | Price | $/sf | Match |
|---|---|---|---|---|---|---|---|
| 110 Armin Pl | 0.04mi | 5/2.0 (+1) | 2,366 (+5%) | 1mo | $235,000 | $99 | 85 |
| 28 Paul Pl | 0.30mi | 4/2.0 | 2,144 (-5%) | 0mo | $230,000 | $107 | 77 |
| 48 Ryan St | 0.29mi | 4/2.0 | 2,084 (-8%) | 8mo | $213,000 | $102 | 67 |
| 81 Melrose St | 0.51mi | 4/2.0 | 2,116 (-6%) | 5mo | $264,000 | $125 | 62 |
| 218 Stevenson St | 0.24mi | 5/2.0 (+1) | 2,552 (+13%) | 7mo | $145,000 | $57 | 57 |
| 89 Melrose St | 0.49mi | 4/2.0 | 2,038 (-10%) | 7mo | $318,000 | $156 | 55 |
| 116 Melrose St | 0.44mi | 4/2.0 | 2,001 (-12%) | 8mo | $223,000 | $111 | 54 |
| 71 Buffum St | 0.69mi | 5/2.0 (+1) | 2,136 (-6%) | 6mo | $160,000 | $75 | 48 |
| 132 Weiss St | 0.65mi | 4/2.0 | 2,484 (+10%) | 6mo | $165,000 | $66 | 48 |
| 120 Weiss St | 0.63mi | 5/2.0 (+1) | 2,040 (-10%) | 2mo | $80,000 | $39 | 48 |
| 129 Gorski St | 0.64mi | 3/2.0 (-1) | 2,054 (-9%) | 7mo | $130,000 | $63 | 44 |
| 204 Cable St | 0.69mi | 5/2.0 (+1) | 2,047 (-9%) | 7mo | $190,000 | $93 | 41 |
Match score weights: distance 35% · size 25% · config 20% · recency 20%. Top-matched comps best support the ARV.
Projected returns pro-forma
10.0% appreciation · 8.0% rent growth · sell at horizon
- IRR
- 28.4%
- Equity multiple
- 3.28×
- Total profit
- $191,713
- Equity at exit
- $270,174
- IRR
- 26.0%
- Equity multiple
- 7.99×
- Total profit
- $586,567
- Equity at exit
- $582,640
Cash invested: $83,972 (down + closing). Projections, not guarantees.
Landlord ↔ Tenant lean methodology
- Overall (STATE)
- 15 Strongly Tenant-Friendly
- State New York
- 15 Strongly Tenant-Friendly · D+10
- County
- — inherits STATE
- City
- — inherits STATE
ZIP-level market 14210
- Home prices YoY
- 13.8%
- Rents YoY
- 12.7%
- Active inventory
- 94
- Price-to-rent
- 19.3×
Monthly cashflow live
- Estimated rent
- $2,589 high interval (Pro) →
- Mortgage (P&I)
- −$1,573
- Tax from tax record
- −$59 /mo · $713/yr
- Insurance
- −$125
- Flood insurance flood zone
- −$56 /mo · $666/yr
- HOA
- −$0
- Vacancy / Maint / Mgmt
- −$544
- Net cashflow
- $233
Break-even live
Sensitivity live
| Price | -10% $402 | -5% $318 | +0% $233 | +5% $148 | +10% $63 |
|---|---|---|---|---|---|
| Rent | -10% $28 | -5% $130 | +0% $233 | +5% $335 | +10% $437 |
| Rate | -1.0pp $384 | -0.5pp $309 | base $233 | +0.5pp $155 | +1.0pp $76 |
2-unit breakdown (identical units grouped — click to expand)
| Units | Beds | Baths | Est. rent |
|---|---|---|---|
| 2× units | 2 | 1 | $2,590 |
| #1 | 2 | 1 | $1,295 |
| #2 | 2 | 1 | $1,295 |
| Total (2 units) | $2,589 | ||
UW: 25.0% down · 7.5% · 30yr · 1.5% tax · 5.0% vac · 8.0% maint · 8.0% mgmt
Financing live
Cash to close
- Down payment
- $74,975
- Closing costs
- $8,997
- Reserves months
- —
- Total cash needed
- —
Loan-product check · same deal, 3 products live
Conventional
25% down · 7.5% · 30yr
- Down + closing
- —
- Monthly P&I
- —
- Monthly cashflow
- —
- DSCR
- —
- Eligible?
- —
Personal DTI + credit; lowest rate.
DSCR
20% down · 8.5% · 30yr
- Down + closing
- —
- Monthly P&I
- —
- Monthly cashflow
- —
- DSCR
- —
- Eligible?
- —
No personal income docs; deal must DSCR.
Hard money
10% down · 12.0% · 12mo
- Down + closing
- —
- Monthly P&I
- —
- Monthly cashflow
- —
- DSCR
- —
- Eligible?
- —
Short-term bridge; refi at stabilization.
Rent comps 1 comps
| Address | Beds | Baths | Sqft | Rent | $/sqft | DOM | Units | Dist |
|---|---|---|---|---|---|---|---|---|
| 181 Willett St Buffalo, NY | 3.0 | 1.0 | 2704 | $1,550 | $0.57 | 2d | 1 | 0.62mi |
Listing history 2 events
-
2026-05-11$300,000 Active 1896-char remark
-
2025-09-18soldstatus $32,000
ⓘ Source: listings_history table (triggers on properties + properties_extension) + one-shot
backfill from property_details.listing_events for pre-trigger history.
Tax reassessment forecast NY · Partial reset (capped growth)
- Current annual tax
- $713 · $59/mo
- Projected year-2 tax
- $2,891 · $241/mo
- Expected delta
- +$2,178/yr (+$181/mo · 305.3%)
ⓘ Screening estimate from a state-policy table — verify with the county assessor before closing.
Climate risk First Street
- Flood 7/10 Severe FEMA zone X (unshaded) · 75% chance over 30 yrs
- Wildfire 1/10 Low
- Heat 3/10 Moderate 7 d/yr ≥92°F today · 15 d/yr by 30 yrs out
- Wind 1/10 Low
- Air quality 3/10 Moderate 2 unhealthy d/yr today · 3 by 30 yrs out
Nearby sold comps map
Loading sold comps map…
Walkable amenities ~0.75 mi
Loading nearby amenities…
Taxation est. · year 1
- Rental income
- $31,068
- − Mortgage interest
- −$16,799
- − Property taxes
- −$713
- − Insurance
- −$2,166
- − Repairs & maintenance
- −$2,485
- − Management
- −$2,485
- − Depreciation
- −$8,724
- Taxable loss
- −$2,306
- Est. tax savings @ 24.0%
- +$553
- After-tax cash flow
- $3,345/yr
For passive investors: Depreciation is non-cash, so a rental often shows a tax loss while cash-flowing — sheltering income. Rental losses are passive: they offset passive income freely, and up to $25,000/yr can offset ordinary (W-2) income if you actively participate and your MAGI is under $100k (phasing out to $0 by $150k); unused losses carry forward. On sale, claimed depreciation is recaptured at up to 25%, and gains may owe capital-gains tax (a 1031 exchange can defer both). Figures are a year-1 estimate at your 24.0% rate — not tax advice; consult a CPA.
Schools (NCES district)
- District
- Buffalo City School District
- NCES district ID
- 3605850
- Math proficiency
- 41% ▲ 11.00%
- Reading proficiency
- 40% ▲ 7.00%
- Median HH income
- $31,665
- Composite
- 33.17/100
- National rank
- #5544
- State rank
- #535 of 590 in NY
Livability — Buffalo
- Score
- 77/100
- State rank
- #195
- US rank
- #3011
Category grades
Schools grade is shown separately in the Schools card above.
Census & demographics
- Census place
- Buffalo, NY
- County
- Erie County · 714,559 people
- City population
- 440,021
- Metro
- Buffalo-Cheektowaga, NY
- Population (ZIP)
- 15,563
- Household income
- $54,197
- Rent vs Own
- Severe rent burden
- 959.0
Population outlook (Erie County) Hauer SSP2
- Today (2025)
- 933,037 people
- By 2030
- 935,181 · +0.2%
- By 2040
- 928,531 · -0.5%
- By 2050
- 905,725 · -2.9%
- By 2075
- 834,037 · -10.6%
- By 2100
- 708,033 · -24.1%
Race, ethnicity, and origin ACS 2023
- Neighborhood character
- Predominantly White (79%)
- Race & ethnicity
- White 79% Two or more races 8% Black 8% Hispanic / Latino 7% Asian 1%
- Hispanic origin (detail)
- Puerto Rican 6%
- Common ancestry
- Romanian 21% Lithuanian 2% Serbian 1%
- Foreign-born
- 2% · Canada, China
- Languages at home
- 95% English-only · Spanish 2% Arabic 1% Other Indo-European 1%
Political lean MEDSL · Erie
- 2024 margin
- Lean D (+9.7) · D 54.8% · R 45.2%
- 2008→2024 swing
- -7.9pp toward R · 2008: 17.5pp · 2024: 9.7pp
- All cycles
- 2024: D+9.7 2020: D+14.7 2016: D+4.8 2012: D+15.6 2008: D+17.5
Not yet ingested
- Civics
- —
Market trends
- HPI YoY
- ▲ 52.34%
- Current HPI
- 431.7951
- Rent YoY
- ▲ 12.67%
- Metro
- Buffalo-Cheektowaga, NY
- State GDP YoY
- ▲ 2.60%
- F500 in state
- 92
Industry mix (Fortune 500 HQ in NY)
| Industry | F500 HQs | Revenue |
|---|---|---|
| Financial Services | 10 | $950B |
|
||
| Consumer Goods | 9 | $162B |
|
||
| Insurance | 4 | $225B |
|
||
| Telecommunications | 2 | $144B |
|
||
| Pharmaceuticals | 2 | $112B |
|
||
| Media / Entertainment | 2 | $69B |
|
||
Price history
+837.2% since first listed4 events — show timeline
- 2026-05-27 Pending — WNYREIS
- 2026-05-22 Price Changed $299,900 WNYREIS
- 2026-05-11 Listed $300,000 WNYREIS
- 2025-09-18 Sold (Public Records) $32,000 Public Records
Property tax history
+8.0%/yrLatest (2025): $713 · +31.2% YoY. Source: county tax records.
Cash-flow waterfall
monthlySold comps — $/sqft
last 12 mo · ≤1 miLoading sold comps…