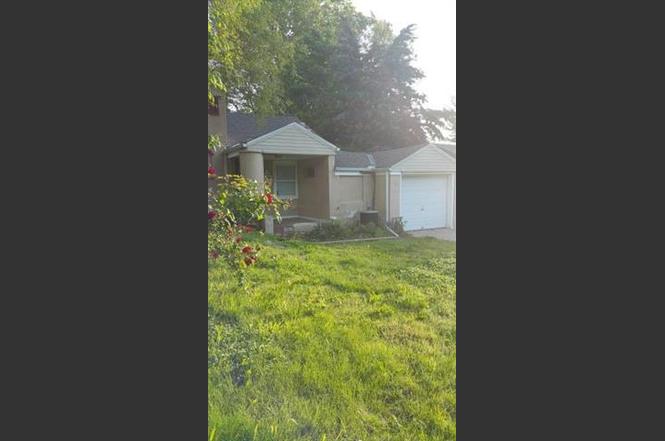
1180 E 77th St · Kansas City, MO
Flood risk 1/10 · Minimal
- FEMA flood zone
- X (unshaded)
- Chance of flooding over 30 yrs
- 0.0%
- Est. flood insurance / yr
- $507 – $1,088
Fire risk 1/10 · Minimal
- Est. fire insurance / yr
- $1,054 – $1,958
Heat risk 4/10 · Minor
- Hot days now (above 106°F)
- 7 days/yr
- Hot days in 30 yrs
- 17 days/yr
Wind risk 2/10 · Minimal
- Chance of severe wind over 30 yrs
- —
Air-quality risk 3/10 · Minor
- Unhealthy air days now
- 2 days/yr
- Unhealthy air days in 30 yrs
- 4 days/yr
Risk factors via First Street. Map © Google.
Why this score? — see what drove the C+ grade
The composite is a weighted blend of 9 inputs, each scored 0–100. Each bar is that input's sub-score; the figure is the points it added to the 100-point composite (weight × sub-score).
- Cash flow +25.2/30.0
- ARV discount +12.9/15.0
- DSCR +8.3/10.0
- 1% rule +5.6/10.0
- Livability +3.9/5.0
- Rent growth +3.5/5.0
- Condition / age +2.5/5.0
- Schools +1.5/10.0
- Appreciation +0.0/10.0
$119,900
🖨 Deal sheet (PDF) 📄 Offer letter ✓ Due diligence
Listing remarks MLS
Great investor property. .. 2 bed, 1 bath, 1 car garage. Needs some TLC and it's ready to rent. BRING ALL OFFERS!!
Key facts
- 7,564 sq ft lot
- Garage
- Listed 2 days
Property features AI
Finance
- Other: Living area listed as 967 (public records)
Exterior
- Parking: Attached garage (1 car) with garage facing front; Off-street parking
- Utilities: Public water
- Home design: Single-family residential; Residential property; Composition roof; Home age approximately 76–100 years
- Construction: Other construction materials
- Exterior features: Public water; Lot approximately 7,564 square feet
Interior
- Bedrooms: 2 bedrooms
- Bathrooms: 1 full bathroom
- Heating & cooling: Natural gas heating; Electric cooling
- Interior features: Crawl space basement; One fireplace
Neighborhood map
What this means for you Summary
Snapshot
- This is a 2-bed/1.0-bath single-family listed at $120k.
Deal economics
- At list price, monthly cash flow is $269 ($3k/yr) — positive.
- The deal already cash-flows at list — no discount required.
- Meets the 1% rule at list price ($1k rent vs $120k).
- Cap rate 9.0% vs local median 3.9% in Kansas City — top-decile yield for the area; either an underpriced asset or a hidden risk that comps aren't pricing in. Stress-test before assuming the spread holds.
Location & tenants
- Location reads 78/100 on livability (#28 in MO, #2,671 nationally) — a middle-class / working-renter tenant base. Strengths: amenities A+, commute A+, cost of living A+; Watch: crime F.
- Kansas City 33 (urban): math 12% / reading 24% proficiency, ranked #308 of 324 in MO (top 95%) — low school quality limits family demand, transient renter base, plan for 1-2y turnover; 75% free/reduced lunch — lower-income household profile, screen leases tightly.
- Zoned schools: Ac Prep Elementary (math 12% / reading 27%, grade F, #941 of 1,115 statewide, top 86%, 341 students, 99% FRL); Central Middle School (math 0% / reading 9%, grade F, #388 of 391 statewide, top 99%, 428 students, 99% FRL); Southeast High School (math 2% / reading 12%, grade F, #512 of 521 statewide, top 99%, 487 students, 99% FRL) — zoned schools average 99% FRL vs 75% district-wide (24 pts higher); higher-poverty schools than district average — tighter screening recommended.
- Market conditions: Rents rising (+4.0%/yr); 133 active listings in the ZIP; 40 comparable units currently listed for rent nearby; rentals at typical pace (median 18d on market — plan ~3-4 weeks tenant-placement turnaround); 4,002 units permitted in Jackson County in 2024 (2,271 in 5+ unit buildings).
Forward outlook
- Local home prices are declining (-3.0%/yr); year-one equity from $829 of loan paydown is wiped out by about $4k of value loss. Plan a longer hold.
- Jackson County population projected at +4% by 2050 — modest demand growth; plan on rents tracking national, not racing it.
- At projected returns (-3.0% appreciation + 4.0% rent growth), your $34k cash investment doubles in ~10 years — after that, you're playing with house money.
Negotiation context
- Only 3 days on market — expect competitive offers; lowballing is unlikely to land.
Risks & watch-outs
- Watch-outs: built in 1937 — expect roof / HVAC / electrical / plumbing capex.
Questions for the listing agent
- Built in 1937 — when were the roof, HVAC, electrical panel, plumbing, and water heater last replaced?
- Is there a deadline driving the sale (1031 exchange, divorce, estate, relocation)? That informs how much negotiation room exists.
- Crime grade is F in this area — have there been break-ins, vandalism, or insurance claims at this property in the last 3 years? What carrier currently insures it and at what premium?
- What's the average days-on-market for RENTAL listings here right now (not sales)? A rising rental-DOM trend means longer vacancies and softer asking-rent achievability than the comps imply.
- What's the recent tenant-quality profile in this submarket — average credit score on applications, eviction rate, late-payment / NSF rate, and stable-employment percentage? A property-management company in the area should have these aggregated.
- How much new for-sale + rental construction is in the pipeline within 1–3 miles? Heavy new supply typically softens prices + rents 12–24 months out; constrained supply supports both.
Investment metrics
- 1% rule
- 1.06% ✓
- Cap rate
- 8.99%
- Cash-on-cash
- 9.63%
- DSCR
- 1.43
- GRM
- 7.9
CMA / ARV
- ARV (on-the-fly)
- $136,347
- Comps found
- 12
Show comp detail 12 sales within ~0.75 mi
| Address | Dist | Beds/Ba | Sqft | Sold | Price | $/sf | Match |
|---|---|---|---|---|---|---|---|
| 1404 E 77th St | 0.07mi | 1/1.0 (-1) | 1,014 (+5%) | 1mo | $118,000 | $116 | 83 |
| 1518 E 76th St | 0.21mi | 2/1.0 | 1,039 (+7%) | 2mo | $185,000 | $178 | 77 |
| 7930 Michigan St | 0.46mi | 2/1.0 | 960 (-1%) | 3mo | $60,000 | $63 | 74 |
| 1429 E 79th St | 0.30mi | 3/1.5 (+1) | 986 (+2%) | 3mo | $139,000 | $141 | 74 |
| 8028 Flora Ave | 0.42mi | 2/1.0 | 906 (-6%) | 1mo | $130,000 | $143 | 69 |
| 1421 E 77th St | 0.10mi | 3/1.5 (+1) | 1,087 (+12%) | 2mo | $205,000 | $189 | 66 |
| 8116 Wayne Ave | 0.54mi | 3/1.0 (+1) | 996 (+3%) | 1mo | $112,500 | $113 | 64 |
| 7202 Lydia Ave | 0.62mi | 2/1.0 | 934 (-3%) | 2mo | $119,900 | $128 | 64 |
| 801 E 72nd St | 0.72mi | 2/1.0 | 991 (+2%) | 2mo | $257,500 | $260 | 61 |
| 8119 Wayne Ave | 0.56mi | 2/1.0 | 882 (-9%) | 4mo | $85,000 | $96 | 56 |
| 2121 E 77th Ter | 0.52mi | 2/1.0 | 832 (-14%) | 2mo | $78,000 | $94 | 51 |
| 8236 Flora Ave | 0.67mi | 3/2.0 (+1) | 864 (-11%) | 1mo | $195,000 | $226 | 42 |
Match score weights: distance 35% · size 25% · config 20% · recency 20%. Top-matched comps best support the ARV.
Projected returns pro-forma
-3.0% appreciation · 3.97% rent growth · sell at horizon
- IRR
- -0.8%
- Equity multiple
- 0.97×
- Total profit
- $-1,064
- Equity at exit
- $17,877
- IRR
- 9.7%
- Equity multiple
- 1.78×
- Total profit
- $26,227
- Equity at exit
- $10,367
Cash invested: $33,572 (down + closing). Projections, not guarantees.
Landlord ↔ Tenant lean methodology
- Overall (STATE)
- 81 Strongly Landlord-Friendly
- State Missouri
- 81 Strongly Landlord-Friendly · R+10
- County
- — inherits STATE
- City
- — inherits STATE
ZIP-level market 64131
- Rents YoY
- 4.0%
- Active inventory
- 133
- Price-to-rent
- 7.9×
Monthly cashflow live
- Estimated rent
- $1,267 high interval (Pro) →
- Mortgage (P&I)
- −$629
- Tax from tax record
- −$53 /mo · $632/yr
- Insurance
- −$50
- HOA
- −$0
- Vacancy / Maint / Mgmt
- −$266
- Net cashflow
- $269
Break-even live
Sensitivity live
| Price | -10% $337 | -5% $303 | +0% $269 | +5% $235 | +10% $202 |
|---|---|---|---|---|---|
| Rent | -10% $169 | -5% $219 | +0% $269 | +5% $319 | +10% $369 |
| Rate | -1.0pp $330 | -0.5pp $300 | base $269 | +0.5pp $238 | +1.0pp $207 |
UW: 25.0% down · 7.5% · 30yr · 1.5% tax · 5.0% vac · 8.0% maint · 8.0% mgmt
Financing live
Cash to close
- Down payment
- $29,975
- Closing costs
- $3,597
- Reserves months
- —
- Total cash needed
- —
Loan-product check · same deal, 3 products live
Conventional
25% down · 7.5% · 30yr
- Down + closing
- —
- Monthly P&I
- —
- Monthly cashflow
- —
- DSCR
- —
- Eligible?
- —
Personal DTI + credit; lowest rate.
DSCR
20% down · 8.5% · 30yr
- Down + closing
- —
- Monthly P&I
- —
- Monthly cashflow
- —
- DSCR
- —
- Eligible?
- —
No personal income docs; deal must DSCR.
Hard money
10% down · 12.0% · 12mo
- Down + closing
- —
- Monthly P&I
- —
- Monthly cashflow
- —
- DSCR
- —
- Eligible?
- —
Short-term bridge; refi at stabilization.
Rent comps 40 comps
| Address | Beds | Baths | Sqft | Rent | $/sqft | DOM | Units | Dist |
|---|---|---|---|---|---|---|---|---|
| 1830 E 78th St Kansas City, MO | 3.0 | 1.0 | 1000 | $1,350 | $1.35 | 14d | 1 | 0.42mi |
| 1861 E 78th St Kansas City, MO | 3.0 | 1.0 | 864 | $1,095 | $1.27 | 18d | 1 | 0.51mi |
| 7427 Arleta Blvd Kansas City, MO | 2.0 | 1.0 | 805 | $1,150 | $1.43 | 45d | 1 | 0.52mi |
| 8101 Campbell St Kansas City, MO | 2.0 | 1.0 | 820 | $888 | $1.08 | 3d | 1 | 0.56mi |
| 8150 Troost Ave Unit 53 Kansas City, MO | 2.0 | 1.0 | 900 | $1,200 | $1.33 | 45d | 1 | 0.61mi |
| 7605 Locust St Kansas City, MO | 2.0 | 1.0 | 744 | $1,325 | $1.78 | 9d | 1 | 0.63mi |
| 8222 Troost Ave Unit 8222-1 Kansas City, MO | 2.0 | 1.0 | 825 | $1,400 | $1.70 | 16d | 1 | 0.65mi |
| 8208 Troost Ave Unit 8218-3 Kansas City, MO | 2.0 | 1.0 | 750 | $1,345 | $1.79 | 45d | 1 | 0.66mi |
| 8208 Troost Ave Kansas City, MO | 1.0–2.0 | 1.0 | 761 | $1,395 | $1.83 | 9d | 2 | 0.67mi |
| 8226 Flora Ave Kansas City, MO | 2.0 | 1.0 | 862 | $1,200 | $1.39 | 4d | 1 | 0.67mi |
| 7560 Prospect Ave Unit G Kansas City, MO | 1.0 | 1.0 | 900 | $925 | $1.03 | 5d | 1 | 0.74mi |
| 7560 Prospect Ave Unit F Kansas City, MO | 1.0 | 1.0 | 900 | $925 | $1.03 | 45d | 1 | 0.76mi |
| 320 E 79th Ter Kansas City, MO | 3.0 | 1.0 | 1100 | $1,700 | $1.55 | 45d | 1 | 0.78mi |
| 7411 Montgall Ave Kansas City, MO | 3.0 | 1.0 | 840 | $1,200 | $1.43 | 45d | 1 | 0.91mi |
| 8104 McGee St Kansas City, MO | 2.0 | 1.0 | 1100 | $1,350 | $1.23 | 25d | 1 | 0.96mi |
| 7524 Baltimore Ave Kansas City, MO | 2.0 | 1.0 | 1000 | $1,300 | $1.30 | 18d | 1 | 1.05mi |
| 316 E Gregory Blvd Unit 3W Kansas City, MO | 1.0 | 1.0 | 700 | $1,149 | $1.64 | 18d | 1 | 1.07mi |
| 2422 E 70th Ter Kansas City, MO | 2.0 | 1.0 | 748 | $1,356 | $1.81 | 14d | 1 | 1.10mi |
| 202 E Gregory Blvd Kansas City, MO | 1.0 | 1.0 | 600 | $1,149 | $1.92 | 3d | 2 | 1.11mi |
| 7317 Agnes Ave Kansas City, MO | 2.0 | 1.0 | 767 | $895 | $1.17 | 25d | 1 | 1.13mi |
| 7412 Bellefontaine Ave Unit A Kansas City, MO | 2.0 | 1.0 | 780 | $1,200 | $1.54 | 4d | 1 | 1.13mi |
| 3106 E 75th St Kansas City, MO | 3.0 | 1.5 | 985 | $1,225 | $1.24 | 23d | 1 | 1.15mi |
| 1831 E 68th St Kansas City, MO | 3.0 | 1.0 | 1043 | $1,250 | $1.20 | 18d | 1 | 1.15mi |
| 7131 Main St Kansas City, MO | 1.0 | 1.0 | 850 | $1,250 | $1.47 | 5d | 1 | 1.16mi |
| 2120 E 68th Ter Kansas City, MO | 2.0 | 1.0 | 930 | $1,200 | $1.29 | 25d | 1 | 1.18mi |
| 6921 Prospect Ave Unit C Kansas City, MO | 1.0 | 1.0 | 538 | $850 | $1.58 | 5d | 1 | 1.22mi |
| 7133 Agnes Ave Kansas City, MO | 3.0 | 2.0 | 1100 | $1,645 | $1.50 | 25d | 1 | 1.23mi |
| 7022 S Benton Ave Kansas City, MO | 3.0 | 1.5 | 1100 | $1,095 | $1.00 | 16d | 1 | 1.24mi |
| 6653 Lydia Ave Kansas City, MO | 3.0 | 1.0 | 962 | $1,500 | $1.56 | 18d | 1 | 1.25mi |
| 1805 E 67th St Kansas City, MO | 2.0 | 1.0 | 1064 | $1,200 | $1.13 | 18d | 1 | 1.25mi |
| 1435 E 66th Ter Kansas City, MO | 3.0 | 1.0 | 988 | $1,340 | $1.36 | 14d | 1 | 1.29mi |
| 7426 Indiana Ave Kansas City, MO | 3.0 | 1.0 | 1100 | $1,400 | $1.27 | 45d | 1 | 1.30mi |
| 7036 Bellefontaine Ave Unit A Kansas City, MO | 2.0 | 1.0 | 810 | $1,200 | $1.48 | 4d | 1 | 1.32mi |
| 7425 Pennsylvania Ave Kansas City, MO | 3.0 | 2.0 | 1000 | $1,695 | $1.70 | 9d | 1 | 1.36mi |
| 2421 E 67th Ter Kansas City, MO | 2.0 | 1.0 | 816 | $1,125 | $1.38 | 18d | 1 | 1.36mi |
| 2430 E 67th Ter Kansas City, MO | 3.0 | 2.0 | 960 | $1,195 | $1.24 | 45d | 1 | 1.39mi |
| 8701 Chestnut Cir Kansas City, MO | 1.0–2.0 | 1.0–2.0 | 925 | $1,115 | $1.21 | 3d | 15 | 1.41mi |
| 6551 Rockhill Rd Kansas City, MO | 1.0–2.0 | 1.0–2.0 | 912 | $2,128 | $2.33 | 3d | 10 | 1.46mi |
| 6518 Rockhill Rd Kansas City, MO | 2.0 | 1.0 | 900 | $2,090 | $2.32 | 45d | 1 | 1.48mi |
| 6512 Rockhill Rd Kansas City, MO | 2.0 | 1.0 | 900 | $1,990 | $2.21 | 3d | 1 | 1.49mi |
Listing history 2 events
-
2026-06-21statusdays on market $119,900 Active 3 DOM
-
2026-06-19$119,900 Coming Soon 1 DOM
ⓘ Source: listings_history table (triggers on properties + properties_extension) + one-shot
backfill from property_details.listing_events for pre-trigger history.
Tax reassessment forecast MO · Resets to sale price
- Current annual tax
- $632 · $53/mo
- Projected year-2 tax
- $1,163 · $97/mo
- Expected delta
- +$531/yr (+$44/mo · 84.0%)
ⓘ Screening estimate from a state-policy table — verify with the county assessor before closing.
Climate risk First Street
- Flood 1/10 Low FEMA zone X (unshaded) · 0% chance over 30 yrs
- Wildfire 1/10 Low
- Heat 4/10 Moderate 7 d/yr ≥106°F today · 17 d/yr by 30 yrs out
- Wind 2/10 Low
- Air quality 3/10 Moderate 2 unhealthy d/yr today · 4 by 30 yrs out
Nearby sold comps map
Loading sold comps map…
Walkable amenities ~0.75 mi
Loading nearby amenities…
Taxation est. · year 1
- Rental income
- $15,202
- − Mortgage interest
- −$6,716
- − Property taxes
- −$632
- − Insurance
- −$600
- − Repairs & maintenance
- −$1,216
- − Management
- −$1,216
- − Depreciation
- −$3,488
- Taxable income
- $1,334
- Est. tax owed @ 24.0%
- −$320
- After-tax cash flow
- $2,913/yr
For passive investors: Depreciation is non-cash, so a rental often shows a tax loss while cash-flowing — sheltering income. Rental losses are passive: they offset passive income freely, and up to $25,000/yr can offset ordinary (W-2) income if you actively participate and your MAGI is under $100k (phasing out to $0 by $150k); unused losses carry forward. On sale, claimed depreciation is recaptured at up to 25%, and gains may owe capital-gains tax (a 1031 exchange can defer both). Figures are a year-1 estimate at your 24.0% rate — not tax advice; consult a CPA.
Schools (NCES district)
- District
- Kansas City 33
- NCES district ID
- 2916400
- Math proficiency
- 12% ▼ -8.00%
- Reading proficiency
- 24% ▬ 0.00%
- Median HH income
- $35,227
- Composite
- 14.8/100
- National rank
- #9387
- State rank
- #308 of 324 in MO
Livability — Kansas City
- Score
- 78/100
- State rank
- #28
- US rank
- #2671
Category grades
Schools grade is shown separately in the Schools card above.
Census & demographics
- Census place
- Kansas City, MO
- County
- Jackson County · 687,798 people
- City population
- 439,467
- Metro
- Kansas City, MO-KS
- Population (ZIP)
- 21,942
- Household income
- $64,201
- Rent vs Own
- Severe rent burden
- 1249.0
Population outlook (Jackson County) Hauer SSP2
- Today (2025)
- 719,589 people
- By 2030
- 731,456 · +1.6%
- By 2040
- 746,689 · +3.8%
- By 2050
- 749,289 · +4.1%
- By 2075
- 736,227 · +2.3%
- By 2100
- 668,210 · -7.1%
Race, ethnicity, and origin ACS 2023
- Neighborhood character
- Diverse neighborhood (Simpson 0.61)
- Race & ethnicity
- White 48% Black 39% Hispanic / Latino 7% Two or more races 7% Asian 1%
- Hispanic origin (detail)
- Mexican 3%
- Common ancestry
- Italian 5% Slovak 1% Lithuanian 1%
- Foreign-born
- 5% · Canada, Vietnam
- Languages at home
- 93% English-only · Spanish 3% French/Haitian/Cajun 1%
Political lean MEDSL · Jackson
- 2024 margin
- D (+19.3) · D 58.9% · R 39.5% · Other 1.6%
- 2008→2024 swing
- -6.1pp toward R · 2008: 25.4pp · 2024: 19.3pp
- All cycles
- 2024: D+19.3 2020: D+22.0 2016: D+16.6 2012: D+19.0 2008: D+25.4
Not yet ingested
- Civics
- —
Market trends
- HPI YoY
- ▼ -253.25%
- Current HPI
- 340.8202
- Rent YoY
- ▲ 3.97%
- Metro
- Kansas City, MO-KS
- State GDP YoY
- ▲ 1.84%
- F500 in state
- 20
Industry mix (Fortune 500 HQ in MO)
| Industry | F500 HQs | Revenue |
|---|---|---|
| Healthcare | 1 | $163B |
|
||
| Insurance | 1 | $21B |
|
||
| Industrial Technology | 1 | $17B |
|
||
| Retail | 1 | $16B |
|
||
| Industrial Distribution | 1 | $10B |
|
||
| Utilities | 1 | $9B |
|
||
Price history
+432.9% since first listed8 events — show timeline
- 2026-06-18 Coming Soon $119,900 Heartland MLS as Distributed by MLS Grid
- 2015-06-12 Sold (MLS) — Heartland MLS as Distributed by MLS Grid
- 2015-05-11 Listed $22,500 Heartland MLS as Distributed by MLS Grid
- 2005-04-19 Sold (Public Records) — Public Records
- 2004-09-15 Sold (Public Records) — Public Records
- 1998-08-06 Sold (Public Records) — Public Records
- 1998-01-08 Sold (Public Records) — Public Records
- 1996-12-30 Sold (Public Records) — Public Records
Property tax history
+4.1%/yrLatest (2025): $632 · -27.1% YoY. Source: county tax records.
Cash-flow waterfall
monthlySold comps — $/sqft
last 12 mo · ≤1 miLoading sold comps…