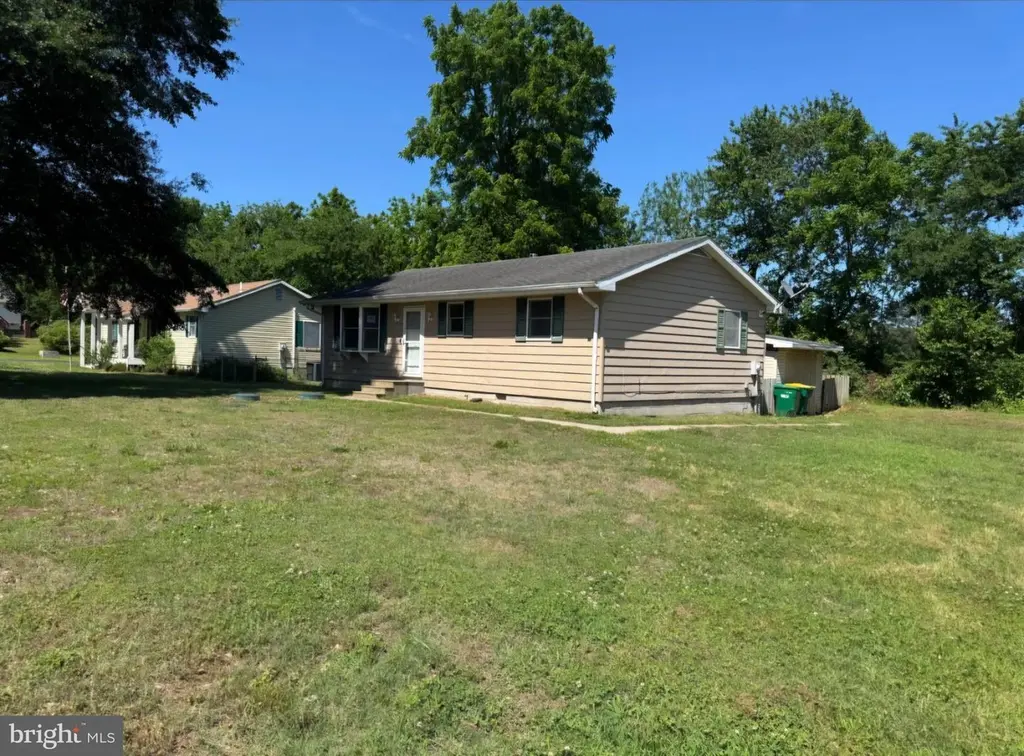
32123 Hidden Acre Dr · Millville, DE
Flood risk 1/10 · Minimal
- FEMA flood zone
- X (unshaded)
- Chance of flooding over 30 yrs
- 0.0%
- Est. flood insurance / yr
- $473 – $860
Fire risk 1/10 · Minimal
- Est. fire insurance / yr
- $476 – $884
Heat risk 8/10 · Major
- Hot days now (above 101°F)
- 7 days/yr
- Hot days in 30 yrs
- 18 days/yr
Wind risk 8/10 · Major
- Chance of severe wind over 30 yrs
- 80.0%
Air-quality risk 2/10 · Minimal
- Unhealthy air days now
- 2 days/yr
- Unhealthy air days in 30 yrs
- 2 days/yr
Risk factors via First Street. Map © Google.
Why this score? — see what drove the C- grade
The composite is a weighted blend of 9 inputs, each scored 0–100. Each bar is that input's sub-score; the figure is the points it added to the 100-point composite (weight × sub-score).
- Cash flow +20.5/30.0
- Appreciation +10.0/10.0
- DSCR +6.5/10.0
- 1% rule +4.1/10.0
- Livability +3.2/5.0
- Schools +2.9/10.0
- Rent growth +2.5/5.0
- Condition / age +2.5/5.0
- ARV discount +1.3/15.0
$232,750
🖨 Deal sheet 📄 Offer letter ✓ Due diligence
Listing remarks MLS
New paint, new carpet and a freshened up outside is waiting for you. If you are looking for a nice quiet home close to the beach but not in all the traffic this could be what you are looking for. This home would make a great starter home, a retirement home or an investment property.
Key facts
- Attic storage
- Outbuilding storage
- Driveway parking
Tags
Property features AI
Finance
- Other: Fee simple ownership; Not in a federal flood zone; Lot dimensions approximately 100 x 100; Above-grade finished area reported by assessor
Exterior
- Parking: Driveway and off-street parking
- Utilities: Well water; Gravity septic field; Electric hot water
- Home design: Detached structure; Estimated year built; Building is winterized
- Construction: Stick-built with vinyl siding; Block foundation with crawl space; Asphalt shingle roof
- Exterior features: Deck(s); Outbuilding(s); Fully wood fenced; Cleared lot
Interior
- Kitchen: Refrigerator; Dishwasher; Exhaust fan; Electric water heater
- Bedrooms: Two bedrooms on the main level
- Flooring: Carpet
- Bathrooms: Two full bathrooms (both on the main level)
- Heating & cooling: Heat pump heating and cooling (electric)
- Interior features: Attic; Ceiling fan(s); Entry-level bedroom; Not furnished; No basement
- Laundry & utility: Washer/dryer hookup
Neighborhood map
What this means for you Summary
Snapshot
- This is a 3-bed/2.0-bath single-family listed at $233k.
Deal economics
- At list price, monthly cash flow is $307 ($4k/yr) — positive.
- The deal already cash-flows at list — no discount required.
- To meet the 1% rule (rent ≥ 1% of price), the offer needs to be $212k (9.0% below list).
- Recommended offer: $212k (9.0% below list) — sets the bar for 1% rule.
- Cap rate 7.9% vs local median 2.4% in Millville — top-decile yield for the area; either an underpriced asset or a hidden risk that comps aren't pricing in. Stress-test before assuming the spread holds.
Location & tenants
- Location reads 64/100 on livability (#49 in DE) — a middle-class / working-renter tenant base. Strengths: crime A+, employment A, housing A; Watch: schools F, amenities F, commute F.
- Indian River School District (rural): math 25% / reading 41% proficiency, ranked #14 of 26 in DE (top 54%) — families likely to look elsewhere, expect single-tenant / working-renter base with shorter leases.
- Market conditions: 281 active listings in the ZIP; 2 comparable units currently listed for rent nearby; 4,354 units permitted in Sussex County in 2024 (344 in 5+ unit buildings).
Forward outlook
- In year one you build about $25k of equity ($2k loan paydown + $23k appreciation (10.0% local appreciation)).
- Sussex County population projected at +25% by 2050 — long-run rental-demand tailwind backs the buy-and-hold thesis.
- At projected returns (10.0% appreciation + 3.0% rent growth), your $65k cash investment doubles in ~3 years — after that, you're playing with house money.
- By year 2, paydown + projected appreciation supports a ~$40k cash-out refi (75% LTV) — recoverable capital for the next deal without selling this one.
Negotiation context
- It's been on market 20 days — a 2% lower offer ($229k) is reasonable based on typical stale-listing flexibility.
- 2 sale attempts since 16y ago; this cycle's ask has dropped $42k (15%) from the opening price — seller is motivated, your offer sets the floor, not the list.
Risks & watch-outs
- Climate carrying-cost: severe wind risk, 80% chance of damaging wind over 30y; extreme-heat days projected 7→18/yr by 2055 (HVAC capex compounding) — expect insurance premiums to compound above CPI over the hold.
Questions for the listing agent
- Built in 1975 — when were the roof, HVAC, electrical panel, plumbing, and water heater last replaced?
- Is there a deadline driving the sale (1031 exchange, divorce, estate, relocation)? That informs how much negotiation room exists.
- Schools are F-rated, which usually means shorter tenancies and higher turnover. Who's the typical renter profile here, and what's been the actual vacancy rate?
- What's the average days-on-market for RENTAL listings here right now (not sales)? A rising rental-DOM trend means longer vacancies and softer asking-rent achievability than the comps imply.
- What's the recent tenant-quality profile in this submarket — average credit score on applications, eviction rate, late-payment / NSF rate, and stable-employment percentage? A property-management company in the area should have these aggregated.
- How much new for-sale + rental construction is in the pipeline within 1–3 miles? Heavy new supply typically softens prices + rents 12–24 months out; constrained supply supports both.
Investment metrics
- 1% rule
- 0.91% ✗
- Cap rate
- 7.88%
- Cash-on-cash
- 5.65%
- DSCR
- 1.25
- GRM
- 9.2
CMA / ARV
- ARV (on-the-fly)
- $204,480
- Comps found
- 4
Show comp detail 4 sales within ~0.75 mi
| Address | Dist | Beds/Ba | Sqft | Sold | Price | $/sf | Match |
|---|---|---|---|---|---|---|---|
| 34256 Whispering Ln | 0.32mi | 2/1.5 (-1) | 952 (-1%) | 2mo | $100,000 | $105 | 75 |
| 32246 Hidden Acre Dr | 0.23mi | 2/2.0 (-1) | 924 (-4%) | 9mo | $200,000 | $216 | 71 |
| 34214 Vines Creek Rd | 0.49mi | 3/1.0 | 960 (0%) | 5mo | $204,800 | $213 | 69 |
| 32230 Hidden Acre Dr | 0.22mi | 2/1.0 (-1) | 860 (-10%) | 23mo | $125,000 | $145 | 45 |
Match score weights: distance 35% · size 25% · config 20% · recency 20%. Top-matched comps best support the ARV.
Projected returns pro-forma
10.0% appreciation · 3.0% rent growth · sell at horizon
- IRR
- 28.4%
- Equity multiple
- 3.24×
- Total profit
- $146,194
- Equity at exit
- $209,680
- IRR
- 24.7%
- Equity multiple
- 7.37×
- Total profit
- $414,910
- Equity at exit
- $452,182
Cash invested: $65,170 (down + closing). Projections, not guarantees.
Landlord ↔ Tenant lean methodology
- Overall (STATE)
- 70 Landlord-Friendly
- State Delaware
- 70 Landlord-Friendly · D+7
- County
- — inherits STATE
- City
- — inherits STATE
ZIP-level market 19945
- Home prices YoY
- 16.9%
- Active inventory
- 281
- Price-to-rent
- 9.2×
Monthly cashflow live
- Estimated rent
- $2,117 medium interval (Pro) →
- Mortgage (P&I)
- −$1,221
- Tax from tax record
- −$48 /mo · $576/yr
- Insurance
- −$97
- HOA
- −$0
- Vacancy / Maint / Mgmt
- −$445
- Net cashflow
- $307
Break-even live
UW: 25.0% down · 7.5% · 30yr · 1.5% tax · 5.0% vac · 8.0% maint · 8.0% mgmt
Financing live
Cash to close
- Down payment
- $58,188
- Closing costs
- $6,982
- Reserves months
- —
- Total cash needed
- —
Loan-product check · same deal, 3 products live
Conventional
25% down · 7.5% · 30yr
- Down + closing
- —
- Monthly P&I
- —
- Monthly cashflow
- —
- DSCR
- —
- Eligible?
- —
Personal DTI + credit; lowest rate.
DSCR
20% down · 8.5% · 30yr
- Down + closing
- —
- Monthly P&I
- —
- Monthly cashflow
- —
- DSCR
- —
- Eligible?
- —
No personal income docs; deal must DSCR.
Hard money
10% down · 12.0% · 12mo
- Down + closing
- —
- Monthly P&I
- —
- Monthly cashflow
- —
- DSCR
- —
- Eligible?
- —
Short-term bridge; refi at stabilization.
Rent comps 2 comps
| Address | Beds | Baths | Sqft | Rent | $/sqft | DOM | Units | Dist |
|---|---|---|---|---|---|---|---|---|
| 35205 Tupelo Cir Frankford, DE | 1.0–3.0 | 1.0–2.0 | 1046 | $2,444 | $2.34 | 13d | 21 | 1.34mi |
| 38307 Thistle Ln #36 Frankford, DE | 3.0 | 2.5 | 1000 | $1,800 | $1.80 | 43d | 1 | 1.36mi |
Listing history 16 events
-
2026-06-18days on market $232,750 Active 20 DOM
-
2026-06-17days on market $232,750 Active 19 DOM
-
2026-06-16price $232,750 Active 18 DOM
-
2026-06-16days on market $245,000 Active 18 DOM
-
2026-06-15days on market $245,000 Active 17 DOM
-
2026-06-14days on market $245,000 Active 15 DOM
-
2026-06-13days on market $245,000 Active 14 DOM
-
2026-06-10days on market $245,000 Active 12 DOM
-
2026-06-09days on market $245,000 Active 11 DOM
-
2026-06-08days on market $245,000 Active 10 DOM
-
2026-06-07days on market $245,000 Active 9 DOM
-
2026-06-02pricedays on market $245,000 Active 4 DOM
-
2026-06-01days on market $275,000 Active 3 DOM
-
2026-05-31days on market $275,000 Active 2 DOM
-
2026-05-30remarks 699-char remark
-
2026-05-30$275,000 Active 1 DOM
ⓘ Source: listings_history table (triggers on properties + properties_extension) + one-shot
backfill from property_details.listing_events for pre-trigger history.
Tax reassessment forecast DE · Partial reset (capped growth)
- Current annual tax
- $576 · $48/mo
- Projected year-2 tax
- $963 · $80/mo
- Expected delta
- +$387/yr (+$32/mo · 67.2%)
ⓘ Screening estimate from a state-policy table — verify with the county assessor before closing.
Climate risk First Street
- Flood 1/10 Low FEMA zone X (unshaded) · 0% chance over 30 yrs
- Wildfire 1/10 Low
- Heat 8/10 Severe 7 d/yr ≥101°F today · 18 d/yr by 30 yrs out
- Wind 8/10 Severe 80% chance of damaging wind over 30 yrs
- Air quality 2/10 Low 2 unhealthy d/yr today · 2 by 30 yrs out
Nearby sold comps map
Loading sold comps map…
Walkable amenities ~0.75 mi
Loading nearby amenities…
Taxation est. · year 1
- Rental income
- $25,405
- − Mortgage interest
- −$13,038
- − Property taxes
- −$576
- − Insurance
- −$1,164
- − Repairs & maintenance
- −$2,032
- − Management
- −$2,032
- − Depreciation
- −$6,771
- Taxable loss
- −$208
- Est. tax savings @ 24.0%
- +$50
- After-tax cash flow
- $3,733/yr
For passive investors: Depreciation is non-cash, so a rental often shows a tax loss while cash-flowing — sheltering income. Rental losses are passive: they offset passive income freely, and up to $25,000/yr can offset ordinary (W-2) income if you actively participate and your MAGI is under $100k (phasing out to $0 by $150k); unused losses carry forward. On sale, claimed depreciation is recaptured at up to 25%, and gains may owe capital-gains tax (a 1031 exchange can defer both). Figures are a year-1 estimate at your 24.0% rate — not tax advice; consult a CPA.
Schools (NCES district)
- District
- Indian River School District
- NCES district ID
- 1000680
- Math proficiency
- 25% ▼ -27.00%
- Reading proficiency
- 41% ▼ -17.00%
- Median HH income
- $53,838
- Composite
- 28.99/100
- National rank
- #6620
- State rank
- #14 of 26 in DE
Livability — Millville
- Score
- 64/100
- State rank
- #49
- US rank
- #13839
Category grades
Schools grade is shown separately in the Schools card above.
Census & demographics
- City population
- 2,093
- Population (ZIP)
- 8,917
Population outlook (Sussex County) Hauer SSP2
- Today (2025)
- 248,853 people
- By 2030
- 264,464 · +6.3%
- By 2040
- 290,980 · +16.9%
- By 2050
- 311,259 · +25.1%
- By 2075
- 352,488 · +41.6%
- By 2100
- 367,406 · +47.6%
Race, ethnicity, and origin ACS 2023
- Neighborhood character
- Predominantly White (77%)
- Race & ethnicity
- White 77% Black 12% Hispanic / Latino 8% Two or more races 7%
- Hispanic origin (detail)
- Mexican 4%
- Common ancestry
- Romanian 3% Slovak 3% Lithuanian 1%
- Foreign-born
- 5% · Canada
- Languages at home
- 91% English-only · Spanish 8%
Political lean MEDSL · Sussex
- 2024 margin
- R (+11.0) · D 43.9% · R 54.9% · Other 1.2%
- 2008→2024 swing
- -2.4pp toward R · 2008: -8.6pp · 2024: -11.0pp
- All cycles
- 2024: R+11.0 2020: R+11.2 2016: R+22.0 2012: R+13.0 2008: R+8.6
Not yet ingested
- Civics
- —
Market trends
- HPI YoY
- ▲ 46.51%
- Current HPI
- 322.2407
- Rent YoY
- —
- Metro
- —
- State GDP YoY
- —
- F500 in state
- 0
Price history
+125.4% since first listed6 events — show timeline
- 2026-05-29 Listed $275,000 BRIGHT MLS
- 2022-01-28 Sold (Public Records) $213,000 Public Records
- 2013-04-24 Sold (Public Records) $122,000 Public Records
- 2013-04-22 Sold (MLS) $122,000 BRIGHT MLS
- 2010-09-21 Listed $128,000 BRIGHT MLS
- 2003-12-24 Sold (Public Records) $122,000 Public Records
Property tax history
+4.8%/yrLatest (2025): $576 · +35.2% YoY. Source: county tax records.
Cash-flow waterfall
monthlySold comps — $/sqft
last 12 mo · ≤1 miLoading sold comps…