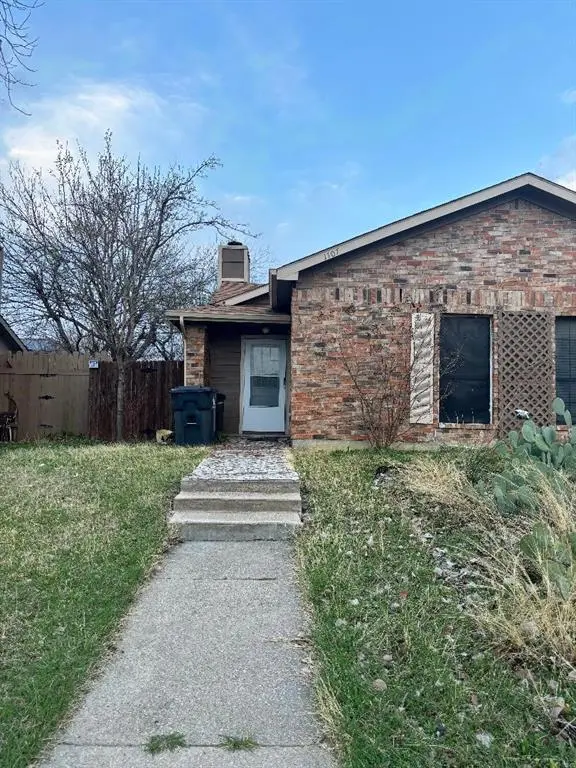
1107 Rimcrest Dr · Arlington, TX
Flood risk 1/10 · Minimal
- FEMA flood zone
- X (unshaded)
- Chance of flooding over 30 yrs
- 0.0%
- Est. flood insurance / yr
- $507 – $1,088
Fire risk 4/10 · Minor
- Est. fire insurance / yr
- $1,222 – $2,270
Heat risk 7/10 · Major
- Hot days now (above 110°F)
- 7 days/yr
- Hot days in 30 yrs
- 23 days/yr
Wind risk 5/10 · Moderate
- Chance of severe wind over 30 yrs
- 26.0%
Air-quality risk 3/10 · Minor
- Unhealthy air days now
- 2 days/yr
- Unhealthy air days in 30 yrs
- 4 days/yr
Risk factors via First Street. Map © Google.
Why this score? — see what drove the C- grade
The composite is a weighted blend of 9 inputs, each scored 0–100. Each bar is that input's sub-score; the figure is the points it added to the 100-point composite (weight × sub-score).
- Cash flow +14.7/30.0
- ARV discount +13.5/15.0
- 1% rule +5.4/10.0
- Schools +4.6/10.0
- DSCR +4.5/10.0
- Livability +3.9/5.0
- Condition / age +2.5/5.0
- Rent growth +2.3/5.0
- Appreciation +0.0/10.0
$199,000
🖨 Deal sheet 📄 Offer letter ✓ Due diligence
Listing remarks MLS
Half duplex with 3 bedrooms and 2 baths. Needs work. Large living room with vaulted ceiling and wood burning fireplace. Kitchen, dining and living room are open. Kitchen has breakfast bar. Split bedrooms for some privacy with a courtyard off the master suite.
Key facts
- Vaulted ceiling
- Large living room
- Split bedrooms
Tags
Neighborhood map
What this means for you Summary
Snapshot
- This is a 3-bed/2.0-bath townhouse listed at $199k.
Deal economics
- At list price, monthly cash flow is $53 ($633/yr) — positive.
- The deal already cash-flows at list — no discount required.
- Meets the 1% rule at list price ($2k rent vs $199k).
- Recommended offer: $187k (6.0% below list) — sets the bar for market timing.
- Cap rate 6.6% vs local median 3.7% in Arlington — top-decile yield for the area; either an underpriced asset or a hidden risk that comps aren't pricing in. Stress-test before assuming the spread holds.
Location & tenants
- Location reads 78/100 on livability (#75 in TX, #2,697 nationally) — a middle-class / working-renter tenant base. Strengths: amenities A+, cost of living A+, housing A+; Watch: schools D+, crime F, commute F.
- Mansfield ISD (suburban): math 47% / reading 53% proficiency, ranked #125 of 826 in TX (top 15%) — acceptable for families but not a draw, mixed tenant base, ~2y average lease.
- Market conditions: Rents soft (-0.8%/yr); 205 active listings in the ZIP; 40 comparable units currently listed for rent nearby; rentals at typical pace (median 24d on market — plan ~3-4 weeks tenant-placement turnaround); solid renter incomes; 18,938 units permitted in Tarrant County in 2024 (8,336 in 5+ unit buildings).
Forward outlook
- Local home prices are declining (-3.0%/yr); year-one equity from $1k of loan paydown is wiped out by about $6k of value loss. Plan a longer hold.
- Tarrant County population projected at +41% by 2050 — long-run rental-demand tailwind backs the buy-and-hold thesis.
Negotiation context
- It's been on market 76 days — a 6% lower offer ($187k) is reasonable based on typical stale-listing flexibility.
- 4 sale attempts since 19y ago with the ask held roughly flat each time — persistent listings suggest the price (not the market) is what's stuck; bring a comps-based counter.
Risks & watch-outs
- Watch-outs: property tax is 2.8% of price.
- Climate carrying-cost: moderate wind risk, 26% chance of damaging wind over 30y; extreme-heat days projected 7→23/yr by 2055 (HVAC capex compounding) — expect insurance premiums to compound above CPI over the hold.
Questions for the listing agent
- It's been on market 76 days. Have you received any prior offers? Is the seller open to a 6% concession, seller financing, or rate buy-down credit?
- Property tax is high relative to price — has the assessment been appealed recently, and will the sale trigger a re-assessment?
- Why hasn't it sold? Are there any deal-killer items the seller is aware of (foundation, flood, title, zoning, code violations)?
- Is there a deadline driving the sale (1031 exchange, divorce, estate, relocation)? That informs how much negotiation room exists.
- Schools are D-rated, which usually means shorter tenancies and higher turnover. Who's the typical renter profile here, and what's been the actual vacancy rate?
- Crime grade is F in this area — have there been break-ins, vandalism, or insurance claims at this property in the last 3 years? What carrier currently insures it and at what premium?
- What's the average days-on-market for RENTAL listings here right now (not sales)? A rising rental-DOM trend means longer vacancies and softer asking-rent achievability than the comps imply.
- What's the recent tenant-quality profile in this submarket — average credit score on applications, eviction rate, late-payment / NSF rate, and stable-employment percentage? A property-management company in the area should have these aggregated.
- How much new for-sale + rental construction is in the pipeline within 1–3 miles? Heavy new supply typically softens prices + rents 12–24 months out; constrained supply supports both.
Investment metrics
- 1% rule
- 1.04% ✓
- Cap rate
- 6.61%
- Cash-on-cash
- 1.14%
- DSCR
- 1.05
- GRM
- 8.0
CMA / ARV
- ARV (median comp)
- $229,568
- List price
- $199,000
- Delta
- -13.32%
- Verdict
- UNDERPRICED
- Comps
- 20 within 1.0 mi
Show comp detail 6 sales within ~0.75 mi
| Address | Dist | Beds/Ba | Sqft | Sold | Price | $/sf | Match |
|---|---|---|---|---|---|---|---|
| 5811 Timbercrest Dr | 0.05mi | 3/2.0 | 1,401 (+1%) | 14mo | $255,000 | $182 | 84 |
| 1010 Cheddar Ct | 0.21mi | 3/3.0 | 1,470 (+6%) | 1mo | $240,000 | $163 | 75 |
| 1008 Tennessee Trl | 0.24mi | 2/1.5 (-1) | 1,242 (-10%) | 2mo | $209,499 | $169 | 63 |
| 5401 Whisper Glen Dr | 0.53mi | 3/2.5 | 1,344 (-3%) | 7mo | $200,000 | $149 | 62 |
| 5925 Timbercrest Dr | 0.21mi | 2/2.0 (-1) | 1,180 (-15%) | 9mo | $200,000 | $169 | 53 |
| 5900 Baroncrest Dr | 0.14mi | 2/2.0 (-1) | 1,180 (-15%) | 20mo | $225,000 | $191 | 47 |
Match score weights: distance 35% · size 25% · config 20% · recency 20%. Top-matched comps best support the ARV.
Projected returns pro-forma
-3.0% appreciation · 0.0% rent growth · sell at horizon
- IRR
- -18.4%
- Equity multiple
- 0.38×
- Total profit
- $-34,814
- Equity at exit
- $29,672
- IRR
- -19.6%
- Equity multiple
- 0.12×
- Total profit
- $-48,867
- Equity at exit
- $17,206
Cash invested: $55,720 (down + closing). Projections, not guarantees.
Landlord ↔ Tenant lean methodology
- Overall (STATE)
- 87 Strongly Landlord-Friendly
- State Texas
- 87 Strongly Landlord-Friendly · R+5
- County
- — inherits STATE
- City
- — inherits STATE
ZIP-level market 76017
- Rents YoY
- -0.8%
- Active inventory
- 205
- Price-to-rent
- 8.0×
Monthly cashflow live
- Estimated rent
- $2,079 high interval (Pro) →
- Mortgage (P&I)
- −$1,044
- Tax from tax record
- −$463 /mo · $5,554/yr
- Insurance
- −$83
- HOA
- −$0
- Vacancy / Maint / Mgmt
- −$437
- Net cashflow
- $53
Break-even live
UW: 25.0% down · 7.5% · 30yr · 1.5% tax · 5.0% vac · 8.0% maint · 8.0% mgmt
Financing live
Cash to close
- Down payment
- $49,750
- Closing costs
- $5,970
- Reserves months
- —
- Total cash needed
- —
Loan-product check · same deal, 3 products live
Conventional
25% down · 7.5% · 30yr
- Down + closing
- —
- Monthly P&I
- —
- Monthly cashflow
- —
- DSCR
- —
- Eligible?
- —
Personal DTI + credit; lowest rate.
DSCR
20% down · 8.5% · 30yr
- Down + closing
- —
- Monthly P&I
- —
- Monthly cashflow
- —
- DSCR
- —
- Eligible?
- —
No personal income docs; deal must DSCR.
Hard money
10% down · 12.0% · 12mo
- Down + closing
- —
- Monthly P&I
- —
- Monthly cashflow
- —
- DSCR
- —
- Eligible?
- —
Short-term bridge; refi at stabilization.
Rent comps 40 comps
| Address | Beds | Baths | Sqft | Rent | $/sqft | DOM | Units | Dist |
|---|---|---|---|---|---|---|---|---|
| 1043 Cheddar Ct Arlington, TX | 3.0 | 2.5 | 1590 | $1,970 | $1.24 | 24d | 1 | 0.12mi |
| 1105 Cloudcrest Ct Arlington, TX | 2.0 | 2.0 | 1513 | $1,700 | $1.12 | 43d | 1 | 0.19mi |
| 5901 Valleycreek Ln Arlington, TX | 1.0–2.0 | 1.0–2.0 | 838 | $1,764 | $2.11 | 2d | 29 | 0.20mi |
| 5907 Valleycreek Ln Arlington, TX | 2.0 | 2.0 | 976 | $1,450 | $1.49 | 43d | 1 | 0.22mi |
| 1009 Danforth Ct Arlington, TX | 3.0 | 2.0 | 1436 | $2,050 | $1.43 | 2d | 1 | 0.28mi |
| 5540 White Dove Dr Arlington, TX | 3.0 | 2.0 | 1636 | $3,350 | $2.05 | 43d | 1 | 0.28mi |
| 5821 Mansfield Rd Arlington, TX | 2.0 | 1.5 | 917 | $1,400 | $1.53 | 24d | 1 | 0.33mi |
| 5821 Mansfield Rd Arlington, TX | 2.0 | 1.0 | 917 | $1,400 | $1.53 | 21d | 1 | 0.33mi |
| 5516 White Dove Dr Arlington, TX | 3.0 | 2.0 | 1672 | $2,106 | $1.26 | 21d | 1 | 0.35mi |
| 5501 White Dove Dr Arlington, TX | 3.0 | 2.0 | 1455 | $1,950 | $1.34 | 24d | 1 | 0.39mi |
| 911 Pinion Dr Arlington, TX | 3.0 | 2.0 | 1299 | $1,400 | $1.08 | 43d | 1 | 0.45mi |
| 920 Tennessee Trl Arlington, TX | 3.0 | 2.0 | 1500 | $2,095 | $1.40 | 1d | 1 | 0.51mi |
| 916 Ashmount Ln Arlington, TX | 3.0 | 2.0 | 1185 | $1,899 | $1.60 | 43d | 1 | 0.54mi |
| 1802 Wimbledon Oaks Ln Arlington, TX | 1.0–2.0 | 1.0–2.0 | 870 | $1,908 | $2.19 | 1d | 23 | 0.55mi |
| 2127 Chapel Downs Dr Arlington, TX | 3.0 | 2.0 | 1480 | $1,115 | $0.75 | 24d | 1 | 0.62mi |
| 6036 Maple Leaf Dr Arlington, TX | 4.0 | 2.0 | 1673 | $2,000 | $1.20 | 12d | 1 | 0.63mi |
| 1003 Prado Real Dr Arlington, TX | 3.0 | 2.0 | 1446 | $2,391 | $1.65 | 7d | 1 | 0.64mi |
| 822 Foxridge Dr Arlington, TX | 3.0 | 2.5 | 1679 | $2,089 | $1.24 | 43d | 1 | 0.64mi |
| 2132 Turf Club Dr Arlington, TX | 3.0 | 2.0 | 1622 | $2,250 | $1.39 | 3d | 1 | 0.67mi |
| 6322 Woolwich Dr Arlington, TX | 3.0 | 2.0 | 1728 | $2,200 | $1.27 | 20d | 1 | 0.68mi |
| 6216 Fairlane Dr Arlington, TX | 3.0 | 2.0 | 1270 | $1,966 | $1.55 | 21d | 1 | 0.69mi |
| 6216 Fairlane Dr Arlington, TX | 3.0 | 2.0 | 1270 | $1,900 | $1.50 | 12d | 1 | 0.69mi |
| 2127 Reverchon Dr Arlington, TX | 3.0 | 2.0 | 1542 | $2,150 | $1.39 | 12d | 1 | 0.70mi |
| 6301 Fairlane Dr Arlington, TX | 3.0 | 2.0 | 1420 | $1,900 | $1.34 | 24d | 1 | 0.71mi |
| 2122 Rainwood Ct Arlington, TX | 3.0 | 2.0 | 1661 | $2,300 | $1.38 | 43d | 1 | 0.73mi |
| 1224 Deuce Dr Arlington, TX | 1.0–2.0 | 1.0–2.0 | 743 | $1,475 | $1.98 | 24d | 3 | 0.76mi |
| 6406 Mercedes Dr Arlington, TX | 3.0 | 2.0 | 1495 | $2,395 | $1.60 | 43d | 1 | 0.76mi |
| 6014 Hollyleaf Dr Arlington, TX | 3.0 | 2.5 | 1389 | $2,145 | $1.54 | 1d | 1 | 0.77mi |
| 5907 Lovingham Ct Unit 5907 Arlington, TX | 3.0 | 2.0 | 1200 | $2,050 | $1.71 | 43d | 1 | 0.80mi |
| 2239 Turf Club Dr Arlington, TX | 3.0 | 2.5 | 1635 | $2,300 | $1.41 | 18d | 1 | 0.80mi |
| 805 Greenridge Dr Arlington, TX | 3.0 | 2.0 | 1361 | $2,050 | $1.51 | 19d | 1 | 0.81mi |
| 914 Pierce Arrow Dr Arlington, TX | 3.0 | 2.0 | 1301 | $2,000 | $1.54 | 43d | 1 | 0.83mi |
| 805 Hillbrooke Dr Arlington, TX | 3.0 | 3.0 | 1873 | $2,200 | $1.17 | 43d | 1 | 0.84mi |
| 6501 Topaz Dr Arlington, TX | 3.0 | 2.0 | 1130 | $1,995 | $1.77 | 24d | 1 | 0.88mi |
| 863 Valleybrooke Dr Arlington, TX | 3.0 | 2.0 | 1123 | $1,950 | $1.74 | 43d | 1 | 0.89mi |
| 780 Bonnet Trl Arlington, TX | 3.0 | 2.5 | 1661 | $2,350 | $1.41 | 24d | 1 | 0.90mi |
| 6504 Eldorado Dr Arlington, TX | 3.0 | 2.0 | 1690 | $2,125 | $1.26 | 12d | 1 | 0.91mi |
| 6504 Eldorado Dr Arlington, TX | 3.0 | 2.0 | 1690 | $2,125 | $1.26 | 7d | 1 | 0.91mi |
| 816 W Colony Dr Arlington, TX | 3.0 | 2.0 | 1296 | $2,025 | $1.56 | 18d | 1 | 0.91mi |
| 6463 Blue Trl Arlington, TX | 3.0 | 2.5 | 1661 | $2,399 | $1.44 | 21d | 1 | 0.91mi |
Listing history 29 events
-
2026-06-18days on market $199,000 Active 76 DOM
-
2026-06-17days on market $199,000 Active 75 DOM
-
2026-06-16days on market $199,000 Active 74 DOM
-
2026-06-15days on market $199,000 Active 73 DOM
-
2026-06-13days on market $199,000 Active 71 DOM
-
2026-06-13days on market $199,000 Active 70 DOM
-
2026-06-09days on market $199,000 Active 67 DOM
-
2026-06-08days on market $199,000 Active 66 DOM
-
2026-06-07days on market $199,000 Active 65 DOM
-
2026-06-04days on market $199,000 Active 62 DOM
-
2026-06-03days on market $199,000 Active 61 DOM
-
2026-06-02days on market $199,000 Active 60 DOM
-
2026-06-01days on market $199,000 Active 59 DOM
-
2026-05-31days on market $199,000 Active 58 DOM
-
2026-04-03$199,000 Active 259-char remark
Show marketing remark (259 chars)
Half duplex with 3 bedrooms and 2 baths. Needs work. Large living room with vaulted ceiling and wood burning fireplace. Kitchen, dining and living room are open. Kitchen has breakfast bar. Split bedrooms for some privacy with a courtyard off the master suite.
-
2018-06-15soldstatus
-
2018-06-14soldstatus Sold 528-char remark
Show marketing remark (528 chars)
Multiple offers. Highest and best due by 5:00 PM Saturday, May 12, 2018. Nice, well kept, 3 bed room, 2 bath duplex located conveniently between Cooper and Matlock in the south Arlington area. Warm and inviting this home features a large living room with a vaulted ceiling and a wood burning fireplace. The living room is open to a nice size dining area. The kitchen features a breakfast bar and looks out on to the dining and living areas. The bedrooms are split for privacy. There is a private patio off of the master bedroom.
-
2018-05-23status Pending 528-char remark
Show marketing remark (528 chars)
Multiple offers. Highest and best due by 5:00 PM Saturday, May 12, 2018. Nice, well kept, 3 bed room, 2 bath duplex located conveniently between Cooper and Matlock in the south Arlington area. Warm and inviting this home features a large living room with a vaulted ceiling and a wood burning fireplace. The living room is open to a nice size dining area. The kitchen features a breakfast bar and looks out on to the dining and living areas. The bedrooms are split for privacy. There is a private patio off of the master bedroom.
-
2018-05-13historical Active Option Contract 528-char remark
Show marketing remark (528 chars)
Multiple offers. Highest and best due by 5:00 PM Saturday, May 12, 2018. Nice, well kept, 3 bed room, 2 bath duplex located conveniently between Cooper and Matlock in the south Arlington area. Warm and inviting this home features a large living room with a vaulted ceiling and a wood burning fireplace. The living room is open to a nice size dining area. The kitchen features a breakfast bar and looks out on to the dining and living areas. The bedrooms are split for privacy. There is a private patio off of the master bedroom.
-
2018-05-09$135,000 Active 528-char remark
Show marketing remark (528 chars)
Multiple offers. Highest and best due by 5:00 PM Saturday, May 12, 2018. Nice, well kept, 3 bed room, 2 bath duplex located conveniently between Cooper and Matlock in the south Arlington area. Warm and inviting this home features a large living room with a vaulted ceiling and a wood burning fireplace. The living room is open to a nice size dining area. The kitchen features a breakfast bar and looks out on to the dining and living areas. The bedrooms are split for privacy. There is a private patio off of the master bedroom.
-
2012-11-16soldstatus Closed
-
2012-10-20status Pending
-
2012-09-21$55,000 Active
-
2007-07-17soldstatus
-
2007-06-27soldstatus
-
2007-05-27historical
-
2007-04-19$84,900
-
2002-02-19soldstatus
-
1992-05-06soldstatus
ⓘ Source: listings_history table (triggers on properties + properties_extension) + one-shot
backfill from property_details.listing_events for pre-trigger history.
Tax reassessment forecast TX · Resets to sale price
- Current annual tax
- $5,554 · $463/mo
- Projected year-2 tax
- $5,554 · $463/mo
- Expected delta
- $0/yr ($0/mo · 0.0%)
ⓘ Screening estimate from a state-policy table — verify with the county assessor before closing.
Climate risk First Street
- Flood 1/10 Low FEMA zone X (unshaded) · 0% chance over 30 yrs
- Wildfire 4/10 Moderate
- Heat 7/10 Severe 7 d/yr ≥110°F today · 23 d/yr by 30 yrs out
- Wind 5/10 Major 26% chance of damaging wind over 30 yrs
- Air quality 3/10 Moderate 2 unhealthy d/yr today · 4 by 30 yrs out
Nearby sold comps map
Loading sold comps map…
Walkable amenities ~0.75 mi
Loading nearby amenities…
Taxation est. · year 1
- Rental income
- $24,943
- − Mortgage interest
- −$11,147
- − Property taxes
- −$5,554
- − Insurance
- −$995
- − Repairs & maintenance
- −$1,995
- − Management
- −$1,995
- − Depreciation
- −$5,789
- Taxable loss
- −$2,533
- Est. tax savings @ 24.0%
- +$608
- After-tax cash flow
- $1,241/yr
For passive investors: Depreciation is non-cash, so a rental often shows a tax loss while cash-flowing — sheltering income. Rental losses are passive: they offset passive income freely, and up to $25,000/yr can offset ordinary (W-2) income if you actively participate and your MAGI is under $100k (phasing out to $0 by $150k); unused losses carry forward. On sale, claimed depreciation is recaptured at up to 25%, and gains may owe capital-gains tax (a 1031 exchange can defer both). Figures are a year-1 estimate at your 24.0% rate — not tax advice; consult a CPA.
Schools (NCES district)
- District
- Mansfield ISD
- NCES district ID
- 4828920
- Math proficiency
- 47% ▼ -17.00%
- Reading proficiency
- 53% ▼ -6.00%
- Median HH income
- $81,934
- Composite
- 45.82/100
- National rank
- #2558
- State rank
- #125 of 826 in TX
Livability — Arlington
- Score
- 78/100
- State rank
- #75
- US rank
- #2697
Category grades
Schools grade is shown separately in the Schools card above.
Census & demographics
- Census place
- Arlington, TX
- County
- Tarrant County · 2,033,669 people
- City population
- 366,588
- Metro
- Dallas-Fort Worth-Arlington, TX
- Population (ZIP)
- 47,074
- Household income
- $90,083
- Rent vs Own
- Severe rent burden
- 1311.0
Population outlook (Tarrant County) Hauer SSP2
- Today (2025)
- 2,380,417 people
- By 2030
- 2,578,900 · +8.3%
- By 2040
- 2,974,995 · +25.0%
- By 2050
- 3,350,489 · +40.8%
- By 2075
- 4,216,909 · +77.2%
- By 2100
- 4,741,527 · +99.2%
Race, ethnicity, and origin ACS 2023
- Neighborhood character
- Diverse neighborhood (Simpson 0.68)
- Race & ethnicity
- White 48% Black 21% Hispanic / Latino 20% Two or more races 11% Asian 6%
- Hispanic origin (detail)
- Mexican 15% Puerto Rican 2%
- Common ancestry
- Italian 2% Slovak 2% Romanian 1%
- Foreign-born
- 13% · Canada, Vietnam, China
- Languages at home
- 78% English-only · Spanish 12% Vietnamese 2% Other Indo-European 2%
Political lean MEDSL · Tarrant
- 2024 margin
- Lean R (+5.1) · D 46.7% · R 51.9% · Other 1.4%
- 2008→2024 swing
- +6.6pp toward D · 2008: -11.7pp · 2024: -5.1pp
- All cycles
- 2024: R+5.1 2020: D+0.2 2016: R+8.7 2012: R+15.7 2008: R+11.7
Not yet ingested
- Civics
- —
Market trends
- HPI YoY
- ▼ -184.11%
- Current HPI
- 268.3139
- Rent YoY
- ▼ -0.80%
- Metro
- Dallas-Fort Worth-Arlington, TX
- State GDP YoY
- ▲ 3.95%
- F500 in state
- 110
Industry mix (Fortune 500 HQ in TX)
| Industry | F500 HQs | Revenue |
|---|---|---|
| Energy | 16 | $1,198B |
|
||
| Technology | 5 | $198B |
|
||
| Engineering / Construction | 4 | $72B |
|
||
| Energy Services | 3 | $60B |
|
||
| Utilities | 3 | $41B |
|
||
| Healthcare | 2 | $330B |
|
||
Price history
+134.4% since first listed15 events — show timeline
- 2026-04-03 Listed $199,000 NTREIS
- 2018-06-15 Sold (Public Records) — Public Records
- 2018-06-14 Sold (MLS) — NTREIS
- 2018-05-23 Pending — NTREIS
- 2018-05-13 Contingent — NTREIS
- 2018-05-09 Listed $135,000 NTREIS
- 2012-11-16 Sold (MLS) — NTREIS
- 2012-10-20 Pending — NTREIS
- 2012-09-21 Listed $55,000 NTREIS
- 2007-07-17 Sold (Public Records) — Public Records
- 2007-06-27 Sold (MLS) — NTREIS
- 2007-05-27 Listing Removed — NTREIS
- 2007-04-19 Listed $84,900 NTREIS
- 2002-02-19 Sold (Public Records) — Public Records
- 1992-05-06 Sold (Public Records) — Public Records
Property tax history
+6.8%/yrLatest (2025): $5,554 · +10.6% YoY. Source: county tax records.
Cash-flow waterfall
monthlySold comps — $/sqft
last 12 mo · ≤1 miLoading sold comps…