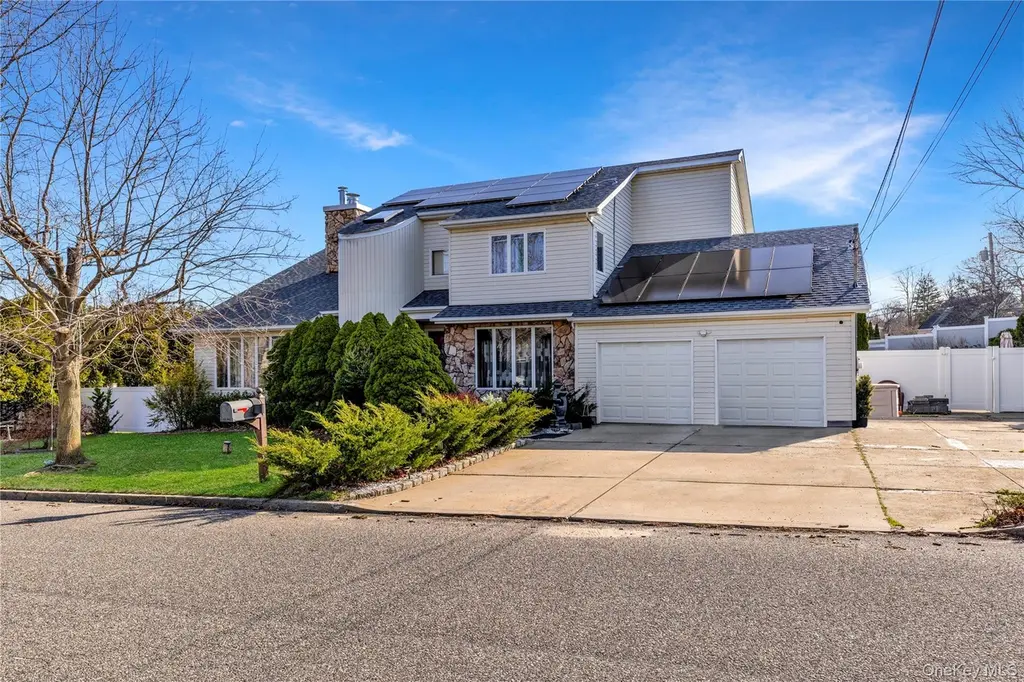
27 Cypress Dr · Kings Park, NY
Flood risk No data
- FEMA flood zone
- —
- Chance of flooding over 30 yrs
- —
- Est. flood insurance / yr
- —
Fire risk No data
- Est. fire insurance / yr
- —
Heat risk No data
- Hot days now (above threshold)
- —
- Hot days in 30 yrs
- —
Wind risk No data
- Chance of severe wind over 30 yrs
- —
Air-quality risk No data
- Unhealthy air days now
- —
- Unhealthy air days in 30 yrs
- —
Risk factors via First Street. Map © Google.
Why this score? — see what drove the B- grade
The composite is a weighted blend of 9 inputs, each scored 0–100. Each bar is that input's sub-score; the figure is the points it added to the 100-point composite (weight × sub-score).
- Cash flow +30.0/30.0
- 1% rule +10.0/10.0
- DSCR +10.0/10.0
- Schools +6.7/10.0
- Livability +3.3/5.0
- Rent growth +2.5/5.0
- Condition / age +2.5/5.0
- ARV discount +2.0/15.0
- Appreciation +0.0/10.0
$950,000
🖨 Deal sheet 📄 Offer letter ✓ Due diligence
Listing remarks
A rare find in San Remo — this spacious 4-bedroom, 2.5-bath home sits on a coveted double lot, just a short stroll from the Nissequogue River, San Remo Community Park, and Linda's Riverside Cafe. Move-in ready and thoughtfully updated, the home features a new roof and solar panels (2024) and a stunning heated saltwater inground pool with pavers (2023), set in a very private backyard, ideal for entertaining in the summer and relaxing all season long. Inside, an open floor plan impresses from the moment you enter, with a dramatic two-story living room anchored by a double-sided wood-burning fireplace. The updated kitchen features refreshed cabinetry, stainless steel appliances, and a se
Key facts
- 0.31 acre lot
- 2 garage spots
- Pool
Neighborhood map
What this means for you Summary
Snapshot
- This is a 4-bed/2.5-bath single-family listed at $950k.
Deal economics
- At list price, monthly cash flow is $21k ($253k/yr) — positive.
- The deal already cash-flows at list — no discount required.
- Meets the 1% rule at list price ($35k rent vs $950k).
- Cap rate 32.9% vs local median 3.8% in Kings Park — top-decile yield for the area; either an underpriced asset or a hidden risk that comps aren't pricing in. Stress-test before assuming the spread holds.
Location & tenants
- Location reads 66/100 on livability (#636 in NY) — a middle-class / working-renter tenant base. Strengths: employment A+, housing A, crime A-; Watch: amenities F, commute F, cost of living F.
- Kings Park Central School District (suburban): math 68% / reading 79% proficiency, ranked #71 of 590 in NY (top 12%) — strong family-tenant draw, lease renewals of 3-5y typical; only 6% free/reduced lunch — higher-income household profile.
- Zoned schools: Parkview Elementary School (math 84% / reading 84%, grade A+, #93 of 2,108 statewide, top 6%, 405 students, 17% FRL); William T Rogers Middle School (math 49% / reading 72%, grade B+, #153 of 729 statewide, top 21%, 636 students, 14% FRL); Kings Park High School (math 98% / reading 97%, grade A+, #19 of 1,100 statewide, top 4%, 857 students, 12% FRL).
- Market conditions: 75 active listings in the ZIP; 2 comparable units currently listed for rent nearby; 1,366 units permitted in Suffolk County in 2024 (216 in 5+ unit buildings).
Forward outlook
- Local home prices are declining (-3.0%/yr); year-one equity from $7k of loan paydown is wiped out by about $28k of value loss. Plan a longer hold.
- Suffolk County population projected to shrink 5% by 2050 — rents likely to lag national; underwrite the cash flow, not the appreciation.
- At projected returns (-3.0% appreciation + 3.0% rent growth), your $266k cash investment doubles in ~2 years — after that, you're playing with house money.
Negotiation context
- Only 14 days on market — expect competitive offers; lowballing is unlikely to land.
- 4 sale attempts with the ask held roughly flat each time — persistent listings suggest the price (not the market) is what's stuck; bring a comps-based counter.
- Current owner paid $700k; 36% above their basis — modest negotiation headroom, anchor on the comps not their cost.
Questions for the listing agent
- Is there a deadline driving the sale (1031 exchange, divorce, estate, relocation)? That informs how much negotiation room exists.
- Schools are A-rated — typically a magnet for longer-tenancy family renters. What's the average tenant stay here, and is there a school-zone premium baked into asking?
- What's the average days-on-market for RENTAL listings here right now (not sales)? A rising rental-DOM trend means longer vacancies and softer asking-rent achievability than the comps imply.
- What's the recent tenant-quality profile in this submarket — average credit score on applications, eviction rate, late-payment / NSF rate, and stable-employment percentage? A property-management company in the area should have these aggregated.
- How much new for-sale + rental construction is in the pipeline within 1–3 miles? Heavy new supply typically softens prices + rents 12–24 months out; constrained supply supports both.
Investment metrics
- 1% rule
- 3.72% ✓
- Cap rate
- 32.94%
- Cash-on-cash
- 95.18%
- DSCR
- 5.24
- GRM
- 2.2
CMA / ARV
- ARV (on-the-fly)
- $846,603
- Comps found
- 10
Show comp detail 10 sales within ~0.75 mi
| Address | Dist | Beds/Ba | Sqft | Sold | Price | $/sf | Match |
|---|---|---|---|---|---|---|---|
| 27 Cypress Dr | 0.00mi | 4/2.5 | 2,589 (0%) | 0mo | $965,000 | $373 | 100 |
| 14 Franciscan Ln | 0.22mi | 4/2.5 | 2,742 (+6%) | 12mo | $1,250,000 | $456 | 70 |
| 60 Oak St | 0.58mi | 4/2.5 | 2,660 (+3%) | 5mo | $869,000 | $327 | 64 |
| 115 Cypress Dr | 0.31mi | 4/3.0 | 2,900 (+12%) | 2mo | $880,000 | $303 | 62 |
| 92 Hawthorne Rd | 0.43mi | 4/2.5 | 2,951 (+14%) | 1mo | $860,000 | $291 | 56 |
| 35 Daisy Dr | 0.46mi | 4/2.0 | 2,400 (-7%) | 11mo | $720,000 | $300 | 56 |
| 25 Franciscan Ln | 0.27mi | 5/3.0 (+1) | 2,893 (+12%) | 12mo | $1,265,000 | $437 | 51 |
| 25 Violet Rd | 0.32mi | 5/2.0 (+1) | 2,200 (-15%) | 5mo | $695,000 | $316 | 49 |
| 93 Boxwood Dr | 0.57mi | 4/2.5 | 2,285 (-12%) | 9mo | $810,000 | $354 | 46 |
| 20 Dalewood Ln | 0.73mi | 5/3.5 (+1) | 2,519 (-3%) | 21mo | $795,000 | $316 | 35 |
Match score weights: distance 35% · size 25% · config 20% · recency 20%. Top-matched comps best support the ARV.
Projected returns pro-forma
-3.0% appreciation · 3.0% rent growth · sell at horizon
- IRR
- 96.1%
- Equity multiple
- 5.48×
- Total profit
- $1,190,537
- Equity at exit
- $141,648
- IRR
- 98.8%
- Equity multiple
- 11.41×
- Total profit
- $2,769,860
- Equity at exit
- $82,139
Cash invested: $266,000 (down + closing). Projections, not guarantees.
Landlord ↔ Tenant lean methodology
- Overall (STATE)
- 15 Strongly Tenant-Friendly
- State New York
- 15 Strongly Tenant-Friendly · D+10
- County
- — inherits STATE
- City
- — inherits STATE
ZIP-level market 11754
- Active inventory
- 75
- Price-to-rent
- 2.2×
Monthly cashflow live
- Estimated rent
- $35,353 medium interval (Pro) →
- Mortgage (P&I)
- −$4,982
- Tax from tax record
- −$1,453 /mo · $17,430/yr
- Insurance
- −$396
- HOA
- −$0
- Vacancy / Maint / Mgmt
- −$7,424
- Net cashflow
- $21,099
Break-even live
UW: 25.0% down · 7.5% · 30yr · 1.5% tax · 5.0% vac · 8.0% maint · 8.0% mgmt
Financing live
Cash to close
- Down payment
- $237,500
- Closing costs
- $28,500
- Reserves months
- —
- Total cash needed
- —
Loan-product check · same deal, 3 products live
Conventional
25% down · 7.5% · 30yr
- Down + closing
- —
- Monthly P&I
- —
- Monthly cashflow
- —
- DSCR
- —
- Eligible?
- —
Personal DTI + credit; lowest rate.
DSCR
20% down · 8.5% · 30yr
- Down + closing
- —
- Monthly P&I
- —
- Monthly cashflow
- —
- DSCR
- —
- Eligible?
- —
No personal income docs; deal must DSCR.
Hard money
10% down · 12.0% · 12mo
- Down + closing
- —
- Monthly P&I
- —
- Monthly cashflow
- —
- DSCR
- —
- Eligible?
- —
Short-term bridge; refi at stabilization.
Rent comps 2 comps
| Address | Beds | Baths | Sqft | Rent | $/sqft | DOM | Units | Dist |
|---|---|---|---|---|---|---|---|---|
| 15 Pheasant Run Saint James, NY | 5.0 | 5.5 | 3058 | $60,000 | $19.62 | 24d | 1 | 0.95mi |
| 451 River Rd Saint James, NY | 5.0 | 3.0 | 3000 | $5,800 | $1.93 | 43d | 1 | 1.16mi |
Listing history 11 events
-
2026-04-02status Pending
-
2026-03-20$950,000 Active
-
2026-03-16historical $950,000
-
2025-08-22historical
-
2025-07-22status Active
-
2025-07-16status Active
-
2025-07-16price $970,000
-
2025-04-10$999,000 Active
-
2025-04-07historical
-
2021-08-16soldstatus $700,000
-
2021-08-16soldstatus $700,000
ⓘ Source: listings_history table (triggers on properties + properties_extension) + one-shot
backfill from property_details.listing_events for pre-trigger history.
Tax reassessment forecast NY · Partial reset (capped growth)
- Current annual tax
- $17,430 · $1,453/mo
- Projected year-2 tax
- $17,430 · $1,453/mo
- Expected delta
- $0/yr ($0/mo · 0.0%)
ⓘ Screening estimate from a state-policy table — verify with the county assessor before closing.
Nearby sold comps map
Loading sold comps map…
Walkable amenities ~0.75 mi
Loading nearby amenities…
Taxation est. · year 1
- Rental income
- $424,236
- − Mortgage interest
- −$53,215
- − Property taxes
- −$17,430
- − Insurance
- −$4,750
- − Repairs & maintenance
- −$33,939
- − Management
- −$33,939
- − Depreciation
- −$27,636
- Taxable income
- $253,327
- Est. tax owed @ 24.0%
- −$60,798
- After-tax cash flow
- $192,385/yr
For passive investors: Depreciation is non-cash, so a rental often shows a tax loss while cash-flowing — sheltering income. Rental losses are passive: they offset passive income freely, and up to $25,000/yr can offset ordinary (W-2) income if you actively participate and your MAGI is under $100k (phasing out to $0 by $150k); unused losses carry forward. On sale, claimed depreciation is recaptured at up to 25%, and gains may owe capital-gains tax (a 1031 exchange can defer both). Figures are a year-1 estimate at your 24.0% rate — not tax advice; consult a CPA.
Schools (NCES district)
- District
- Kings Park Central School District
- NCES district ID
- 3616260
- Math proficiency
- 68% ▼ -7.00%
- Reading proficiency
- 79% ▬ 0.00%
- Median HH income
- $101,806
- Composite
- 67.18/100
- National rank
- #388
- State rank
- #71 of 590 in NY
Livability — Kings Park
- Score
- 66/100
- State rank
- #636
- US rank
- #11831
Category grades
Schools grade is shown separately in the Schools card above.
Census & demographics
- Census place
- Kings Park, NY
- City population
- 17,660
- Population (ZIP)
- 17,660
Population outlook (Suffolk County) Hauer SSP2
- Today (2025)
- 1,505,262 people
- By 2030
- 1,498,318 · -0.5%
- By 2040
- 1,471,101 · -2.3%
- By 2050
- 1,424,848 · -5.3%
- By 2075
- 1,337,157 · -11.2%
- By 2100
- 1,217,720 · -19.1%
Race, ethnicity, and origin ACS 2023
- Neighborhood character
- Predominantly White (83%)
- Race & ethnicity
- White 83% Hispanic / Latino 10% Two or more races 7% Asian 3%
- Hispanic origin (detail)
- Puerto Rican 4%
- Common ancestry
- Romanian 5% Scotch-Irish 1% Serbian 1%
- Foreign-born
- 8% · Canada, South Korea, Jamaica
- Languages at home
- 90% English-only · Spanish 4% Other Indo-European 2% Russian/Polish/Slavic 1%
Political lean MEDSL · Suffolk
- 2024 margin
- Lean R (+10.0) · D 45.0% · R 55.0%
- 2008→2024 swing
- -16.0pp toward R · 2008: 6.0pp · 2024: -10.0pp
- All cycles
- 2024: R+10.0 2020: R+0.0 2016: R+8.2 2012: D+2.9 2008: D+6.0
Not yet ingested
- Civics
- —
Market trends
- HPI YoY
- ▼ -652.42%
- Current HPI
- 282.7382
- Rent YoY
- —
- Metro
- —
- State GDP YoY
- ▲ 2.60%
- F500 in state
- 92
Industry mix (Fortune 500 HQ in NY)
| Industry | F500 HQs | Revenue |
|---|---|---|
| Financial Services | 10 | $950B |
|
||
| Consumer Goods | 9 | $162B |
|
||
| Insurance | 4 | $225B |
|
||
| Telecommunications | 2 | $144B |
|
||
| Pharmaceuticals | 2 | $112B |
|
||
| Media / Entertainment | 2 | $69B |
|
||
Price history
+35.7% since first listed11 events — show timeline
- 2026-04-02 Pending — OneKey® MLS as Distributed by MLS Grid
- 2026-03-20 Listed $950,000 OneKey® MLS as Distributed by MLS Grid
- 2026-03-16 Coming Soon $950,000 OneKey® MLS as Distributed by MLS Grid
- 2025-08-22 Listing Removed — OneKey® MLS as Distributed by MLS Grid
- 2025-07-22 Relisted — OneKey® MLS as Distributed by MLS Grid
- 2025-07-16 Relisted — OneKey® MLS as Distributed by MLS Grid
- 2025-07-16 Price Changed $970,000 OneKey® MLS as Distributed by MLS Grid
- 2025-04-10 Listed $999,000 OneKey® MLS as Distributed by MLS Grid
- 2025-04-07 Coming Soon — OneKey® MLS as Distributed by MLS Grid
- 2021-08-16 Sold (Public Records) $700,000 Public Records
- 2021-08-16 Sold (Public Records) $700,000 Public Records
Property tax history
+2.6%/yrLatest (2025): $17,430 · +0.0% YoY. Source: county tax records.
Cash-flow waterfall
monthlySold comps — $/sqft
last 12 mo · ≤1 miLoading sold comps…